Over the last couple of weeks, I've been writing that metals would be turning the corner higher after the Fed. This past week we did move higher in metals and miners.
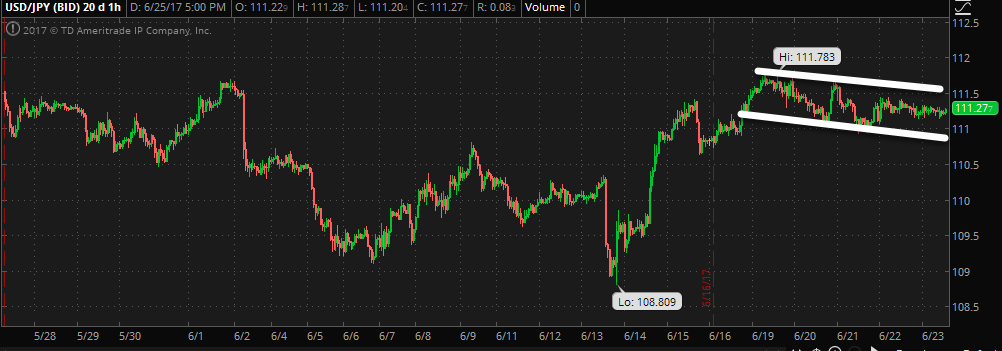
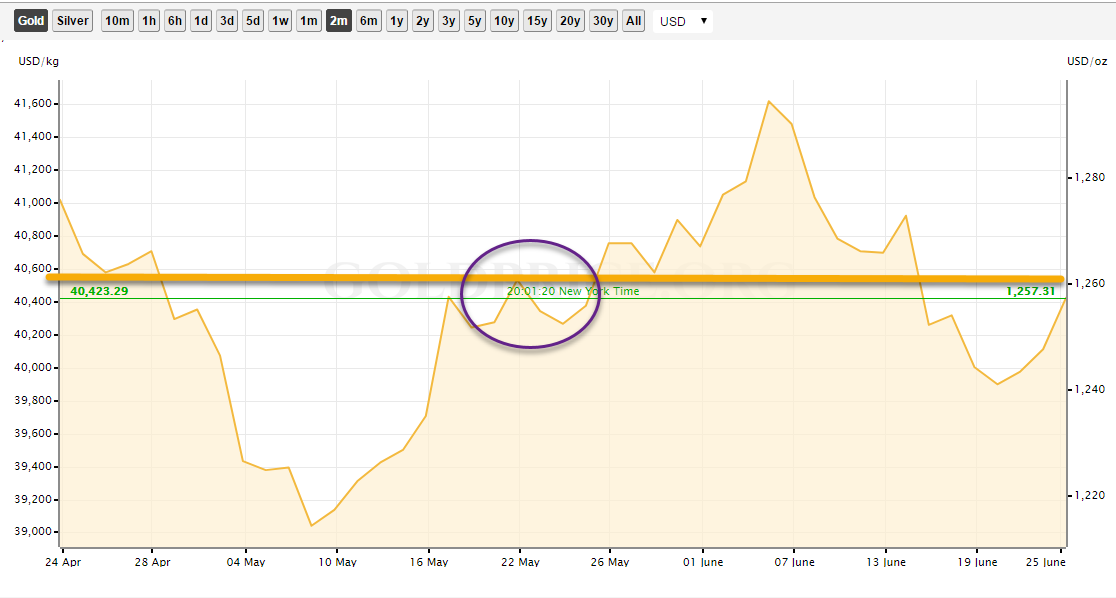
This should continue but there are still some bumps in the road unless we get gold over $1260 and silver over $16.80, preferably $17. We have gold up 1.80 to 1257.10 and silver up 2 cents to 16.70 now in early Asian trading. Until we break those marks we could still see one more trip lower, but it will be because the dollar and USD/JPY have one more trip higher, so still watch those.
We can’t let the USD/JPY get back over 111.78. A break of 111.50 and it looks like it might. On the downside we need to first break 111.15.

You can see in the chart below exactly where we are, zooming out a couple months. That’s why a tick over 1260 and the move higher to 1300 should kick in.
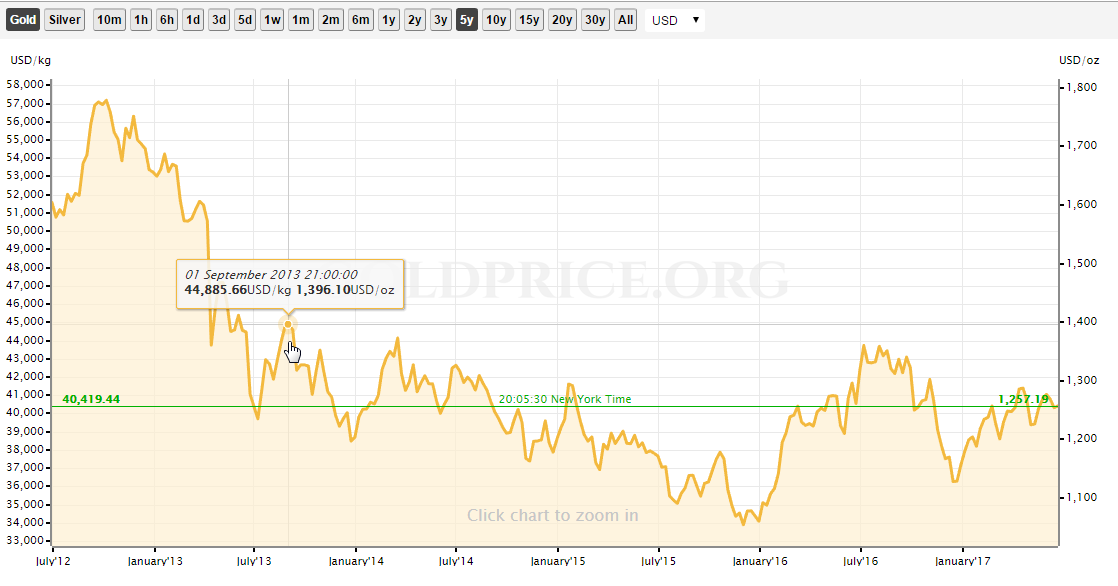
We’ll determine if $1400 is within reach soon enough. Look at that nice 5-year chart though and you can see an opportunity knocking to lock in some gold bulls who think we’ll just head back up to over $1900 again in what we’ll call another gold bull trap (that’s what I would do if I was capable of doing so as a market maker).
But that’s when what I have written about in a deflationary credit contraction will kick in. That’s when I’ll be saying; watch out below. I know it’s difficult for some of you to imagine this, but those of you who have followed me a long time, know I call the ups and downs pretty well and the reason I wrote my book is to help investors see what I see.
I present the data and you decide. Simple as that as an informed investor makes good decisions.


