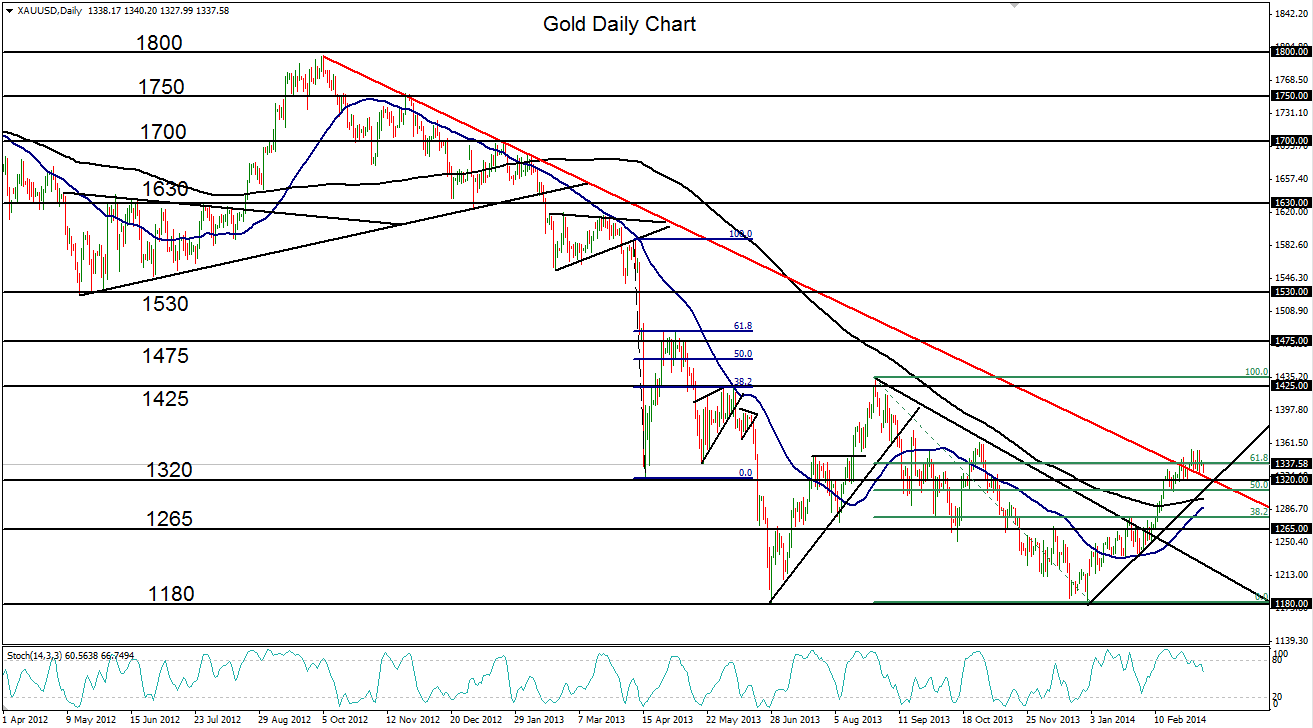
Gold has consolidated its gains after having risen to establish a four-month high around 1355 last week.
That high was a tentative culmination of a two-month bullish trend that launched the precious metal off its long-term low of 1178, which was hit at the very end of 2013 and which formed a major double-bottom pattern.
In the process of the recent bullish run, gold has advanced above several key resistance levels, including 1265 and 1320.

Mid-February saw a rally well above the 200-day moving average; a situation that has not occurred since a year earlier in February of 2013.
Additionally, the 50-day moving average is now closely approaching the 200-day, which could lead the way to a rarely seen bullish cross.
Last week’s noted high of 1355 placed the price of gold above the major downtrend resistance line that has defined the bearish trend since the 1800-area high in October of 2012.
Technical considerations indicate further potential upside momentum on that breakout.
While currently consolidating its gains, a resumption of the recent run could target a key upside resistance level around 1425, last hit in August, which represents the peak of the noted double-bottom pattern.
Disclosure: FX Solutions assumes no responsibility for errors, inaccuracies or omissions in these materials. FX Solutions does not warrant the accuracy or completeness of the information, text, graphics, links or other items contained within these materials. FX Solutions shall not be liable for any special, indirect, incidental, or consequential damages, including without limitation losses, lost revenues, or lost profits that may result from these materials.
The products offered by FX Solutions are leveraged products which carry a high level of risk to your capital with the possibility of losing more than your initial investment and may not be suitable for all investors. Ensure you fully understand the risks involved and seek independent advice if necessary.
