No, Ladies and Gentlemen, not my words. Rather 'twas the opening confabulation as exaggeratingly uttered in ever so bemoaning fashion to commence our Investors Roundtable on Sunday a week ago, two of our best and brightest members mimicking that which they had heard during some financial network television show. "Dowwnn" in unison did they repeatedly say, such that before I could inject a simple sentence of logic, again their chorus would refrain with even more urgency: "Dowwwnnn!" To quote our great and good friend Gold Nanny, at times "They're like children, you know."
But wait, there's more. On Thursday whilst toweling off in the quiet sanctity of the club's locker room, a morose voice suddenly loomed from high above me. I glanced upward toward the second tier of lockers to see one of our esteemed members leaning over the balustrade, extending a fist with thumb earthward, chanting "Dowwnn, Dowwwnnn!" Good grief.
When fated market direction becomes conclusively believed by practically one and all, 'tis a sure bet that instead the opposite ensues. And to me: "Dowwwnnn" is Done. Yes, ABN/Amro and notably GoldmanSachs -- which has morphed from an investment bank into more of a political financial oracle -- is telling us Gold has lower to go. But what do they know? Too often Goldman is respected as gospel and well so beyond the bounds of just Gold.
Indeed Ms. Cohen trotted out mid-week to tell us that price-earnings ratios are lower now than the last time stocks were near these levels... Hullo? The S&P 500 has never been anywhere near these levels!. 'Tis easy to remark that earnings have doubled since the financial crisis. But that's the old "depends upon from where you measure" trick. Directly from S&P's own website: Index Earnings as of June 2007: 84.92 (real 95.66). Index Earnings as of June 2013: 90.95 (real 91.41). Albeit pre-crisis, but if that's a doubling then I need a new abacus.
Sadly there's little scrutiny on the $treet of $hame, (which is why I do my own arithmetic calculations rather than solely take for granted what others expound as fact). And yes: the capitalization-weighted summation of the S&P's current stock prices each divided by their respective twelve-month trailing earnings is right now 36.0x, (yield 1.999% vs. the 10-year T-Note's 2.709%). Yet again ad nausea from the Department of Redundancy Department, it matters not; neither does the downgrading by Moody's yesterday (Friday) of Goldman, Morgan, The Other Morgan, and Bof A; nor does New York's Empire Index having turned negative for November warrant une derrière du rat. What's important is that the S&P finished Friday +7 whilst 'tis a celebrative certainty that Gold can only go "Dowwwnnn!". But 'tisn't just Gold.
When the computers are fired up each day here in the pre-dawn hours, the first screen we see comprises eight panels, each of 21 daily bars for the BEGOS markets, showing their linear regression trend lines and consistency thereof per the baby blue dots. That helps me begin the day in context and yesterday morning I snapped a screenshot of such display: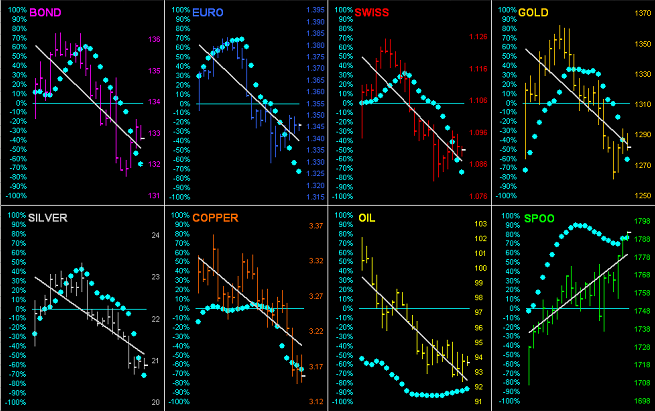
"But isn't that what happens when you get Dollar strength, mmb?"
Nice oxymoron there, Squire. Such "Dollar strength" is being revered by its Index having risen a whopping 2.3% from the October low to the current level of 80.880 (yawn), a mid-point price about which 'tis been fluctuating since the Black Swan Event of 2008. Such financially-secure pillar (arf-arf) certainly is redounding negatively to our bond prices, other bow-wow fiat currencies, hard assets, and StateSide earnings. Yet the above graphic shows the S&P in astonishlingly ascending trend.
Indeed, Q3 Earnings Season has just concluded. And if you look carefully at this next table, of the data collected for 2,282 companies, 55% bettered their year-over-year Q3 results. Which in turns means 45% did not so improve, (but mum's the word: don't wreck the equities party):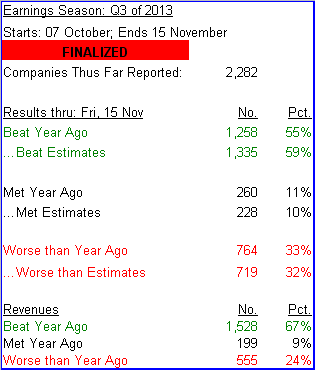
In fact, 'tis probably better to neither mention that the Economic Barometer is hardly keeping pace; (again, mum's the word; don't be that equities party-pooper):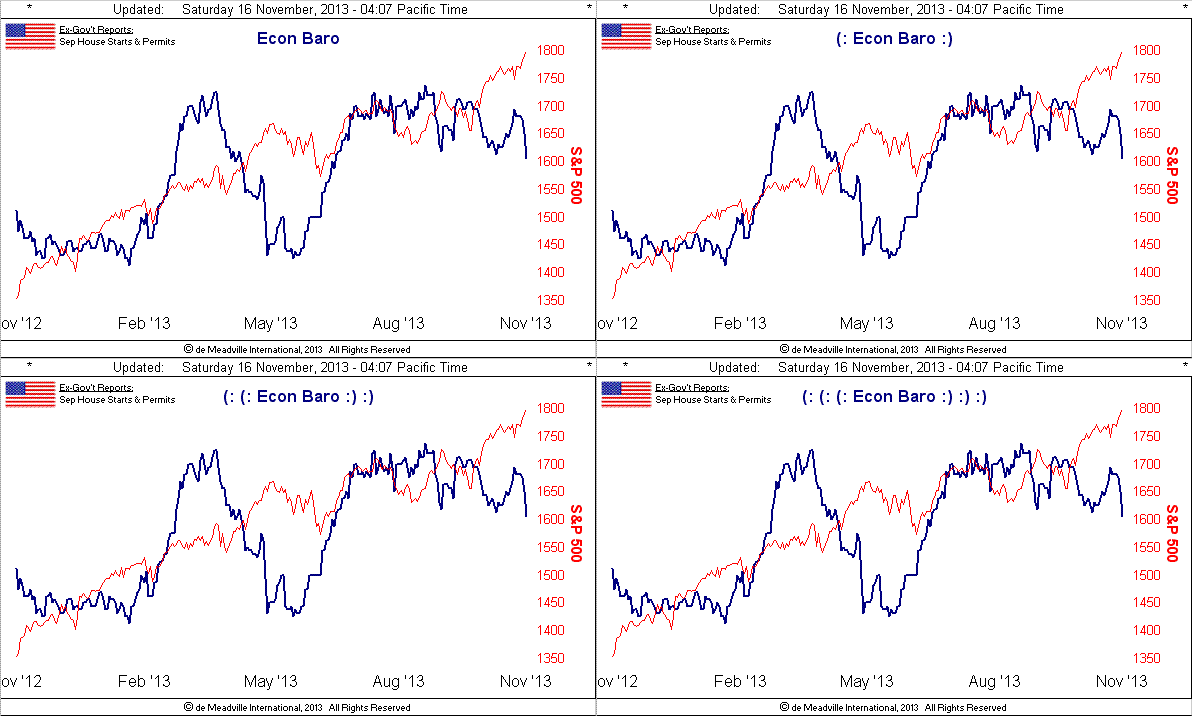
Course, we all know why the S&P continues to soar: Janet Yellen is waiting in the wings to keep the printing tumblers a-spinnin'. That was the rationale earlier this year, the S&P reaching 1500 and thus getting "priced into the market" that the next Fed Head would be dovish. After that, as if it hadn't yet occurred, 'twas further "priced into the market" again and the S&P amazingly reached 1600. And then came Breaking News: Old Yeller just might be dovish, so that unforeseen fact had to be"priced into the market" and the S&P hit 1700. Now, it appears with economic fragility not just here but "unexpectedly" so in the EuroZone, just as all was thought to have been righted, (France actually having gone backwards in Q3), there may have to be a dovish bent to monetary policy as opposed to tapering too quickly and so such news has to be"priced into the market" as the S&P looks to eclipse 1800 on Monday. Honest to Pete, how many times must the same old news be treated as new news such that it has yet to be"priced into the market"?
Here is something that has not been "priced into the market": 'tis called Gold. The following chart puts in into perspective the percentage growth in the S&P, Dollar Debasement, Earnings, Gold and the Euro from November 1980 (the beginning of the St. Louis Fed's "FRED" online database) to date, using monthly closes as that is the smallest time slice of data provided for Real Earnings by S&P: 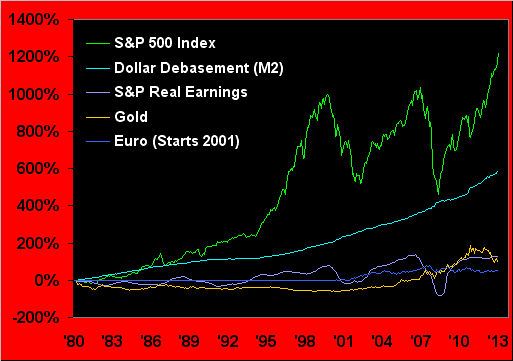
And oh by the way, real GDP growth for the same period? +134%. Population growth? +39%. You tell me which element in that graphic is the bubble and then we can talk about "Dowwwnnn!"
As for Gold, it did just as we thought it might, using this past week to test the "aged" 1281-1271 support band. (We say "aged" as with the passage of time, what was useful nearer-term support and resistance information as gleaned from our Market Profiles is constantly evolving to more current levels through price's ebb and flow in concert with traders' short-term memories, whereas structural support and resistance is borne of broader-based market patterns). 'Twas Gold's narrowest week of the last 18, spanning a mere 33 points in netting a one-point gain to close near the five-day high: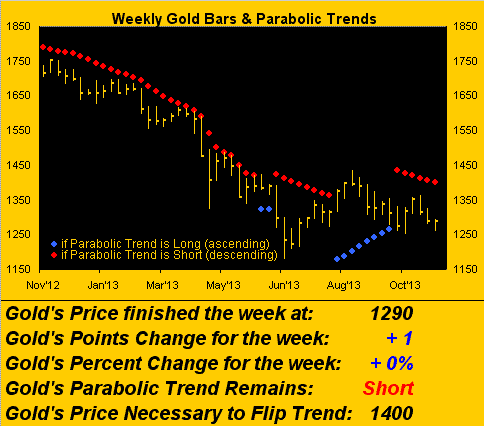
Not much "Dowwwnnn!" there.
Next let's go to Gold's valuation chart, the smooth pearly line representative of price's movement relative to those of the other primary BEGOS Markets. Per the oscillator (price less value in the chart's lower panel), Gold is now only modestly below valuation, that line in turn per the main panel beginning to flatten from its prior descent in this three-month view: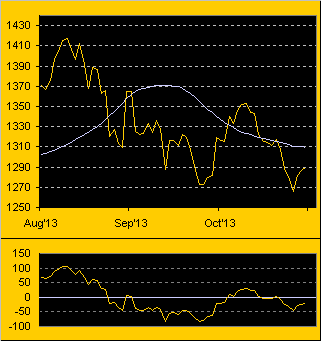
Similarly for three months, here again we've Gold vis-à-vis its Magnet levels (the thicker line and current magnet of 1294 in the box). As 'tis price's wont to not lose attraction to the magnet, the oscillator level being -4.4 and rising suggests Gold shall regain the 1300s in the new week: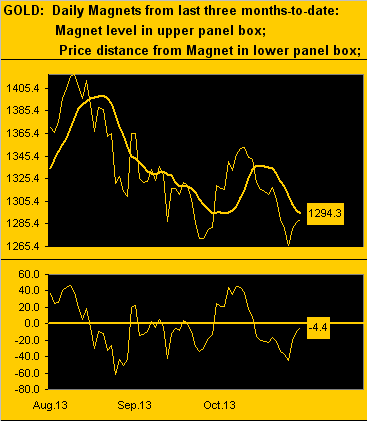
The above magnet levels are culled from the weighted-average data inherent in the Market Profile below, wherein we've now fresh trading supports at both 1285 and 1275, the overhead resistance goal to take out being the 1309-1317 zone: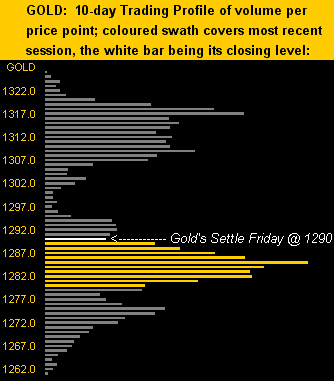
And to thus wrap it all in technical perspective, here is the current state of the Gold Stack:
Gold’s All-Time High: 1923 (06 September 2011)
The Gateway to 2000: 1900+
The Final Frontier: 1800-1900
The Northern Front: 1750-1800
The Floor: 1579-1466
The 300-day Moving Average: 1510
Le Sous-sol: Sub-1466
The Weekly Parabolic Price to flip Long: 1400
Base Camp: 1377
Structural Resistance: 1310-1337 / 1463-1479 / 1524-1535 / 1555
Trading Resistance: 1309 / 1317
10-Session “volume-weighted” average price magnet: 1294, (directional range: 1326 down to 1261 = 65 points or -5%)
Gold Currently: 1290, (weighted-average trading range per day: 19 points)
Trading Support: 1285 / 1275
Structural Support: 1266 / 1227
Year-to-Date Low: 1179
Finally with respect to the so-called "Dollar strength" noted earlier, the great Richard Russell has on occasion pointed out that the estimated life of a fiat currency runs about 40 years. Given that our Federal Reserve Note became fully fiat in 1971, doing the math-to-date we've 2013 - 1971 = 42 years, (combined funded and unfunded national obligations amounting to some $62 trillion). 'Tis coincidentally therefore fitting that ever-controversial parliamentarian Mikhail "The Youngster" Degtyarev wants to ban the U.S. dollar from Russia, having actually proposed a bill to so do and pinpointing our currency failure to occur in 2017, (thus a lifespan of 46 years). I'd say that's close enough for government work -- yet 'tis clearly not "priced into the market" -- but anticipative of one heckova "Dowwwnnn!"
- English (UK)
- English (India)
- English (Canada)
- English (Australia)
- English (South Africa)
- English (Philippines)
- English (Nigeria)
- Deutsch
- Español (España)
- Español (México)
- Français
- Italiano
- Nederlands
- Português (Portugal)
- Polski
- Português (Brasil)
- Русский
- Türkçe
- العربية
- Ελληνικά
- Svenska
- Suomi
- עברית
- 日本語
- 한국어
- 简体中文
- 繁體中文
- Bahasa Indonesia
- Bahasa Melayu
- ไทย
- Tiếng Việt
- हिंदी
Is Gold Going Down, Down, Down?
Latest comments
Loading next article…
Install Our App
Risk Disclosure: Trading in financial instruments and/or cryptocurrencies involves high risks including the risk of losing some, or all, of your investment amount, and may not be suitable for all investors. Prices of cryptocurrencies are extremely volatile and may be affected by external factors such as financial, regulatory or political events. Trading on margin increases the financial risks.
Before deciding to trade in financial instrument or cryptocurrencies you should be fully informed of the risks and costs associated with trading the financial markets, carefully consider your investment objectives, level of experience, and risk appetite, and seek professional advice where needed.
Fusion Media would like to remind you that the data contained in this website is not necessarily real-time nor accurate. The data and prices on the website are not necessarily provided by any market or exchange, but may be provided by market makers, and so prices may not be accurate and may differ from the actual price at any given market, meaning prices are indicative and not appropriate for trading purposes. Fusion Media and any provider of the data contained in this website will not accept liability for any loss or damage as a result of your trading, or your reliance on the information contained within this website.
It is prohibited to use, store, reproduce, display, modify, transmit or distribute the data contained in this website without the explicit prior written permission of Fusion Media and/or the data provider. All intellectual property rights are reserved by the providers and/or the exchange providing the data contained in this website.
Fusion Media may be compensated by the advertisers that appear on the website, based on your interaction with the advertisements or advertisers.
© 2007-2025 - Fusion Media Limited. All Rights Reserved.