The last few days have been relatively traumatic for Gold as the precious metal has declined sharply below intra-day support at the $1760 mark. This largely continues a bearish slide for the metal that started in August of last year and saw a 16% decline in prices. However, there are some interesting signs appearing that might lead to a reversal for the precious metal over the medium term.
As a commodity, none is more exposed to the ravages of failing macroeconomic policy, then gold. The precious metal ebbs and flows according to the whims of the U.S. Federal Reserve, Central Government, and geopolitical risk. Continuing rounds of stimulus, asset purchases, and an exploding Fed balance sheet have created an environment where the precious metal continues to trend lower. In view of this, let's take a quick consideration of the fundamental factors which are presently impacting gold prices and what they could tell us about where a bottom for the precious metal might form.
Real Yields
One of the key factors in pricing for gold is the real yield rate, or to put it plainly, nominal bond yields minus the inflation rate. The real yield rate has been rising recently with the latest 10Y Real Yield having risen from -1.06% to around -0.67% as of today. This represents a rise of circa 40 basis points which is not inconsequential to gold's recent fall. What this means is that inflationary expectations are rising in the market and this flows through to the general yield curve with buyers demanding higher nominal rates for debt instruments.
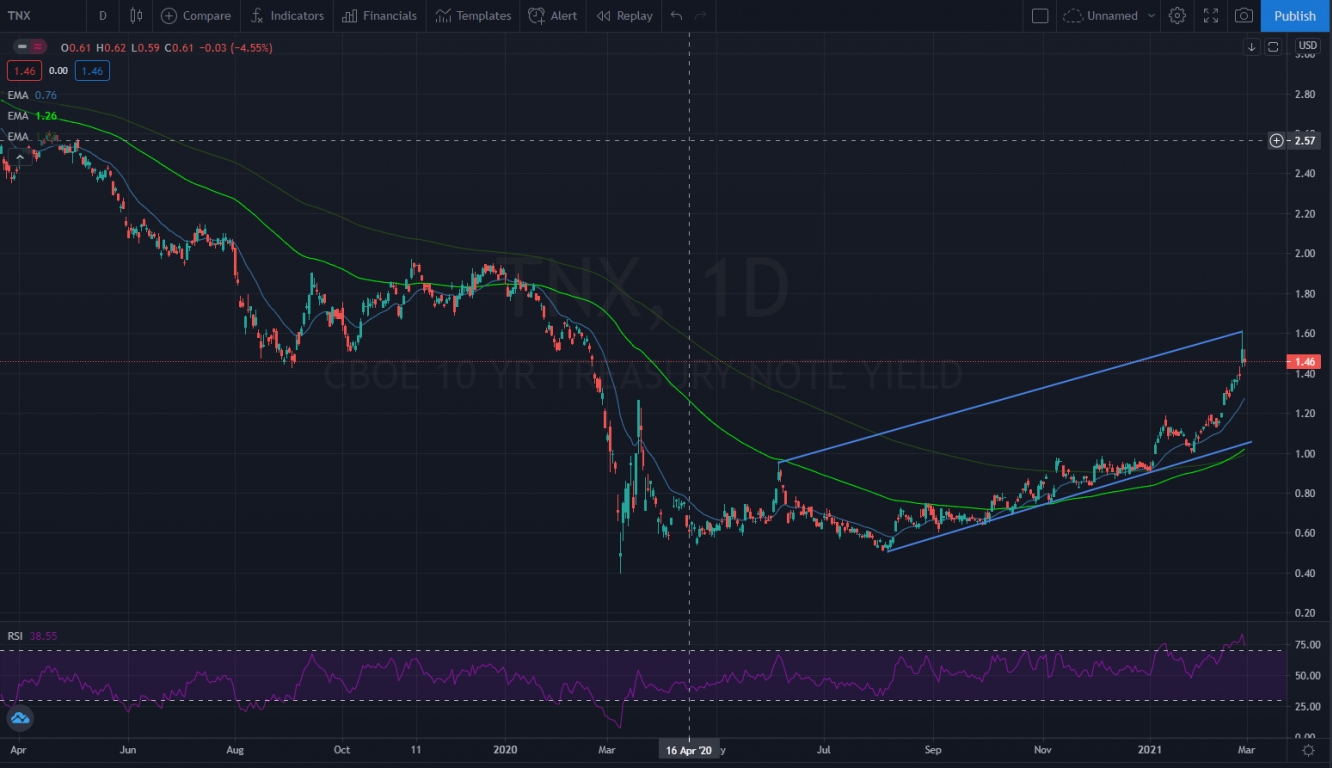
The above chart shows the 10-year Treasury yield and what is particularly interesting is the fact that its move higher starts in August 2020. This is around the start of the recent decline for gold prices and further shows the importance that real yields have on flows into precious metals.
How High Will Bond Yields Go?
Historically, the 30-year Treasury Yield chart shows reversals at the point that the yield reaches the 100-month moving average. At that point we see a significant fall to yields as both real inflation and Fed action catchup and effectively depress the real yield of U.S. Treasury bonds. In turn this leads to sharp capital flows back into the gold markets as individuals seek a safe-haven from the ravages of inflation and Fed monetary policy.
The current level of the 100-month moving average of the 30-year yield is 2.75% and we are quickly closing in on that level with today’s chart on the 10-year timeframe showing yields of 2.32%. Once we hit a yield range of 2.75%-2.95% expect the Fed to step in and start `yield managing’ the market. At this point, gold is likely to soar and we could very likely reach levels not seen before and far exceeding the last high around the $2075 mark.
Time Frame
Ultimately, the Fed has printed a tremendous amount of money in the last 12 months and real inflationary pressures over the medium term are unavoidable. Now that you understand the mechanism and negative correlation between real bond yields and gold prices you should be able to actively monitor this key fundamental factor.
This entry signal is likely to flash within the next two months so keep a close eye on the 10-year and 30-year yield charts for the key 2.75% point as when the move happens it will be a relatively quick snap. Predicting upside prices is difficult given the lack of historical pricing data but a level around the $2300 an ounce mark would not surprise me given the level of dollar stimulus occurring.
