Patience has been a requirement for those that have been bullish on gold. Having dropped nearly 30% last year, the shiny commodity was one of the worst performing asset classes in 2013. That is exactly why its been on my radar for this year. With it’s historically low sentiment readings and lack of interest in the trader community, gold is an asset that could shine in 2014. We just need the right setup.
I'm Watching...
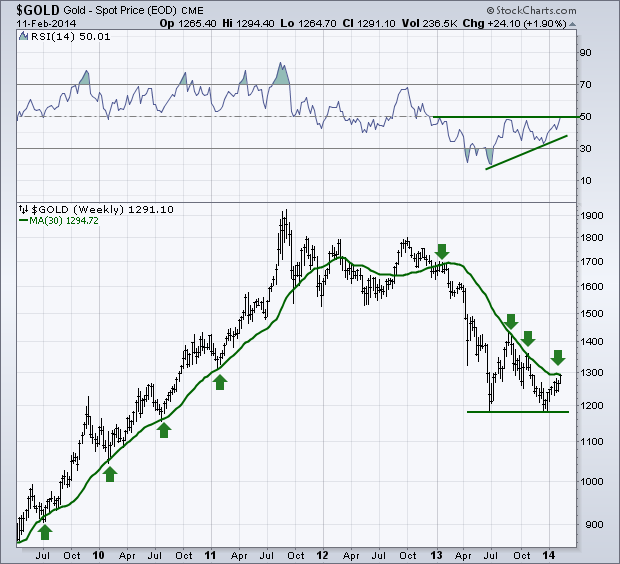
I’ve been watching the 150-day moving average as support and resistance for gold, (which is the 30-week moving average as show on the chart below). I’ve marked arrows to show past instances where gold has met this moving average over the last couple of years. In 2012 as gold began to consolidate the commodity began to whipsaw above and below the moving average before ultimately beginning its decline. During the drop in ’13 we hit the 30-week (150-day) MA three times as it smacked buyers in the face. Price is now back up against this level and I’m watching to see if gold bulls have what it takes to break above and send gold prices higher as it begins a new up trend.
Taking a look at momentum, specifically the Relative Strength Index (RSI) indicator, we can see a positive divergence was been put in place as price created a double bottom just under $1200 and the RSI put in a higher low. With the recent rise in price, the momentum indicator is now testing resistance at the 50 level.
Could Be Bullish
If we see price break above its moving average -- while momentum breaks above its own resistance -- that could be very bullish for this precious metal.
Disclaimer: Do not construe anything written in this post or this blog in its entirety as a recommendation, research, or an offer to buy or sell any securities. Everything in this post is meant for educational and entertainment purposes only. I or my affiliates may hold positions in securities mentioned in the blog. Please see my Disclosure page for full disclaimer. Connect with Andrew on Google+, Twitter, and StockTwits.

