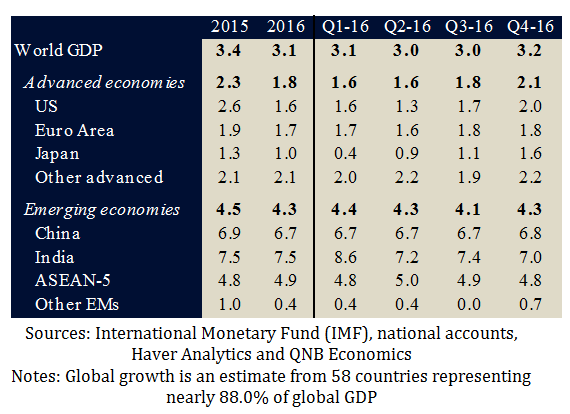
2016 was an eventful year. China kicked off the year with a devaluation of the yuan, then British and American voters defied expectations, OPEC agreed to its first supply cut in eight years and India demonetised nearly 90.0% of its currency in circulation. Now that most countries have released Q4 2016 GDP numbers, we have a final reading on global growth in a year dominated by shocks. Unsurprisingly, we found that growth faltered to 3.1% in 2016 from 3.4% in 2015, marking the slowest pace of growth since the global financial crisis. But this masks an acceleration in growth towards the end of the year.
The final quarter of 2016 showed the first quarterly pickup in global growth in two years and was led by both advanced economies and emerging markets (EMs).The bottom line is that while overall growth slipped in 2016, strong momentum from the second half, particularly from advanced economies, bodes well for growth in 2017.
In advanced economies, the growth story reflects a strong cyclical upturn after weak first half growth, primarily in the US and Japan. In the US, capital expenditure cuts in the energy sector, a sharper-than-expected inventory drawdown and the drag of a stronger dollar on exports explained the depressed first half growth. While in Japan, growth was held back by sluggish exports due to the past appreciation of the yen and weak Chinese import demand with its spill over effects on Japan’s other key trade partners.
But in the second half of the year, higher energy prices reduced the drag from energy investment in the US and a weaker yen revived Japanese exports. Beyond the US and Japan, other advanced economies strengthened in H2 2016. Firming domestic demand from monetary policy stimulus lifted growth in the Euro Area, higher commodity prices benefitted producers such as Australia, Canada and Norway and the UK was resilient on stronger consumption and external demand.
Qatar National Bank

Sources: International Monetary Fund (IMF), national accounts, Haver Analytics and QNB Economics
Notes: Global growth is an estimate from 58 countries representing nearly 88.0% of global GDP
The story for EMs, however, was more complex.There were three key factors explaining the overall slowdown in growth and the pickup in Q4 2016.
First, China continued its growth slowdown but at a much more orderly pace than originally expected and actually saw growth increase in Q4 2016 on monetary policy stimulus. Growth moderated to 6.7% for the first three quarters of the year beforerising slightly to 6.8% in Q4 2016.
Second, commodity producers, such as Brazil and Russia, were mired in long recessions due to the collapse in commodity prices and this continued through the first half of the year when prices reached multi-year lows. But the subsequent recovery in commodity prices in the second half of 2016 supported growth in these countries and helped Russia end its two year long recession in Q4 2016.
Third, countries with strong trade ties with the US, such as Mexico, rebounded in line with stronger US growth in the year after facing weaker US import demand in early 2016.
To conclude, the trend of growth in 2016 has important implications for 2017. Growth in advanced economies finally seems to have momentum after years of support from ultra-loose monetary policy. The era of deflationary dominance appears to be ending and early survey indicators for Q1 2017 point to growth and inflation strengthening across advanced economies. Emerging market growth, on the other hand, is likely to remain fragile. But EM growth will at least benefit from higher commodity prices, greater confidence of an orderly China slowdown and a rebound following India’s demonetisation. All in all, it appears global growth may well be out of the doldrums.
