Is GBP/AUD Set To Continue Trending South?

Published 05/21/2020, 06:57 AM
Updated 07/09/2023, 06:31 AM
GBP/AUD
-

GBP/AUD traded higher on Thursday after it hit support near 1.8530 on Wednesday. Overall, the pair has been trading below a downside resistance line since April 2nd and thus, we would consider the near-term outlook to be negative. Even if the current rebound continues for a while more, as long as it stays below the downside line, we would treat it as a corrective move.

If the bears decide to take back control from near the 1.8765 level, or near the downside resistance line, we would expect them to aim for another test near the 1.8530 barrier. If they don’t stop there, the next potential support hurdle may be at 1.8430, marked by the inside swing highs of October 3rd and 10th. Another break, below 1.8430 may carry more bearish implications, perhaps setting the stage for the low of October 11th, at 1.8275.

Looking at our short-term oscillators, we see that the RSI rebounded and exited its below-30 zone, and now appears to be heading towards 50. The MACD, although below both its zero and trigger lines, shows signs of bottoming. Both indicators detect slowing downside speed, which increases the chances for the current rebound to continue for a while more before the next negative leg.

On the upside, we would like to see a strong break above the psychological round figure of 1.9000 before we start examining whether the bulls have gained the upper hand. The rate would already be above the aforementioned downside line and could initially target the 1.9125 level, marked by the high of May 12th. If that hurdle is broken as well, then the next stop may be the high of May 7th at 1.9330. The bulls may decide to take a break after hitting that zone, thereby allowing the rate to correct lower. However, as long as such a retreat stays limited above the downside line, we would see decent chances for another leg north and a break above 1.9330. The next resistance zone lies at 1.9535, which is the high of May 4th.
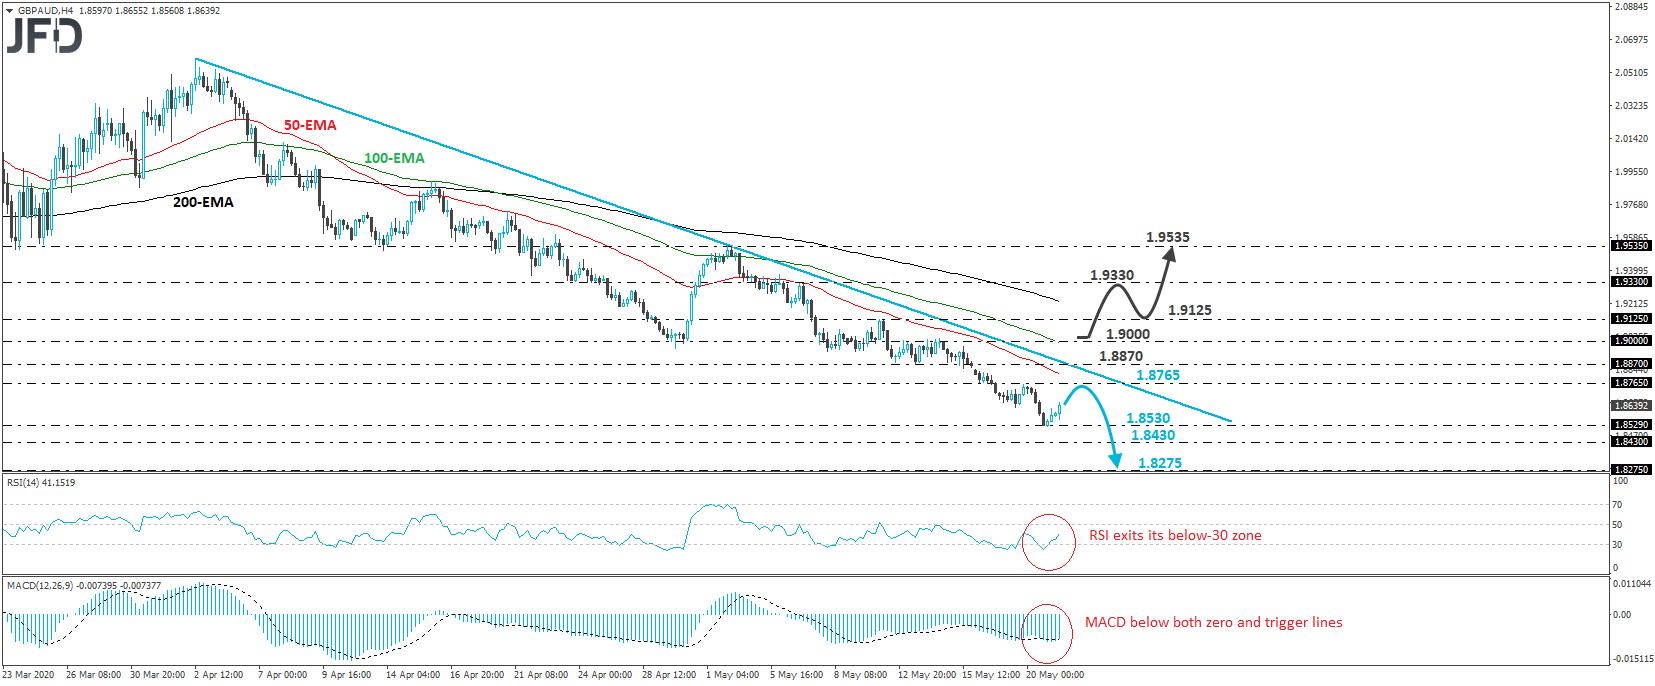
GBP/AUD 4-hour chart technical analysis

Latest comments

Loading next article…
Risk Disclosure: Trading in financial instruments and/or cryptocurrencies involves high risks including the risk of losing some, or all, of your investment amount, and may not be suitable for all investors. Prices of cryptocurrencies are extremely volatile and may be affected by external factors such as financial, regulatory or political events. Trading on margin increases the financial risks.
Before deciding to trade in financial instrument or cryptocurrencies you should be fully informed of the risks and costs associated with trading the financial markets, carefully consider your investment objectives, level of experience, and risk appetite, and seek professional advice where needed.
Fusion Media would like to remind you that the data contained in this website is not necessarily real-time nor accurate. The data and prices on the website are not necessarily provided by any market or exchange, but may be provided by market makers, and so prices may not be accurate and may differ from the actual price at any given market, meaning prices are indicative and not appropriate for trading purposes. Fusion Media and any provider of the data contained in this website will not accept liability for any loss or damage as a result of your trading, or your reliance on the information contained within this website.
It is prohibited to use, store, reproduce, display, modify, transmit or distribute the data contained in this website without the explicit prior written permission of Fusion Media and/or the data provider. All intellectual property rights are reserved by the providers and/or the exchange providing the data contained in this website.
Fusion Media may be compensated by the advertisers that appear on the website, based on your interaction with the advertisements or advertisers.
© 2007-2025 - Fusion Media Limited. All Rights Reserved.