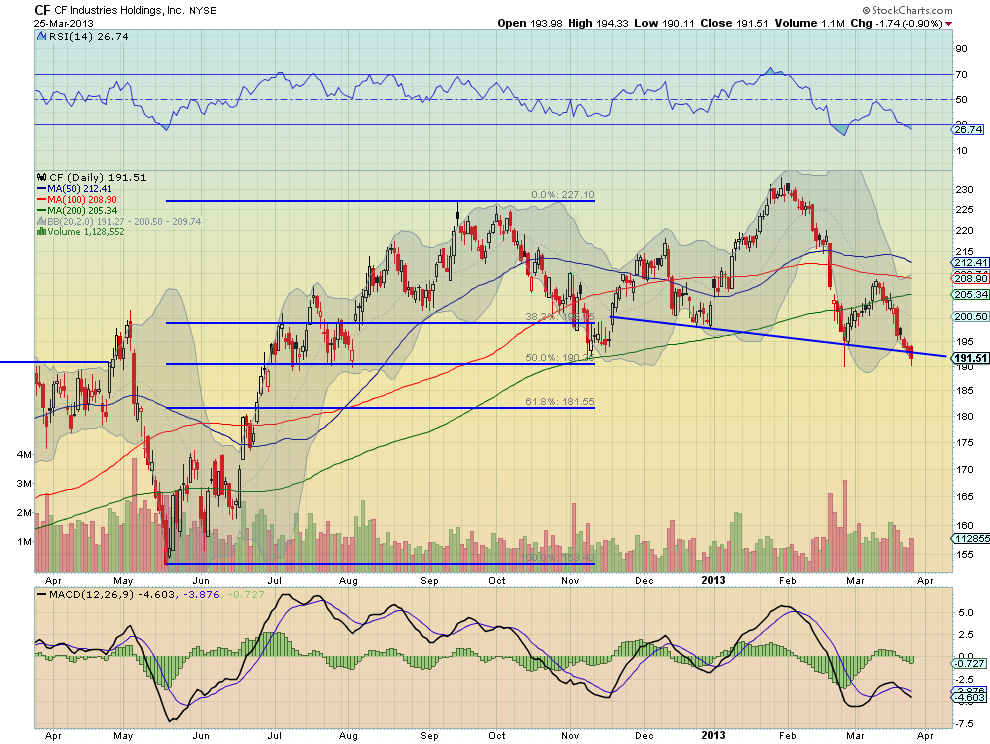
Take a look at fertilizer stocks as another example of the market heading higher, despite previously correlated assets moving in the opposite direction. One I watch, CF Industries, CF, is having a really rough time. From the chart below you can see that today triggered a Head and Shoulders top, with a price objective lower to at least 156. 
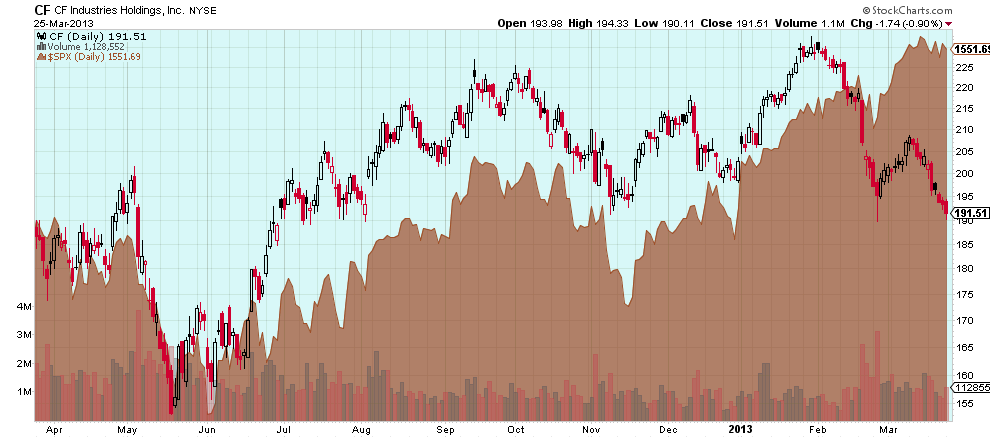
This would coincide closely with a full retracement of the move higher from May 2012, down to 153.40 and the current 3-box Reversal Point and Figure price objective of 144. A pretty good alignment for a short trade. But it becomes a very scary situation for market bulls when you look at the same chart cleared of all the moving averages, Fibonacci’s and trend lines, and comparing it to the S&P 500, SPX. The chart below does that. 
The correlation to the S&P 500 was very tight until the beginning of February. Since then, the S&P has continued higher while CF industries is trending lower. If they should recouple with the S&P falling, then the 1400 level at the beginning of the year seems a reasonable retracement target. Of course the correlation could be permanently broken. There is no need at this point to bet on it reverting. Wait for the price action to show you what it will do - but be prepared.
The information in this blog post represents my own opinions and does not contain a recommendation for any particular security or investment. I or my affiliates may hold positions or other interests in securities mentioned in the Blog, please see my Disclaimer page for my full disclaimer.
Original post
- English (UK)
- English (India)
- English (Canada)
- English (Australia)
- English (South Africa)
- English (Philippines)
- English (Nigeria)
- Deutsch
- Español (España)
- Español (México)
- Français
- Italiano
- Nederlands
- Português (Portugal)
- Polski
- Português (Brasil)
- Русский
- Türkçe
- العربية
- Ελληνικά
- Svenska
- Suomi
- עברית
- 日本語
- 한국어
- 简体中文
- 繁體中文
- Bahasa Indonesia
- Bahasa Melayu
- ไทย
- Tiếng Việt
- हिंदी
Is Fertilizer UnCoupling
Published 03/25/2013, 03:20 AM
Updated 05/14/2017, 06:45 AM
Is Fertilizer UnCoupling
Latest comments
Loading next article…
Install Our App
Risk Disclosure: Trading in financial instruments and/or cryptocurrencies involves high risks including the risk of losing some, or all, of your investment amount, and may not be suitable for all investors. Prices of cryptocurrencies are extremely volatile and may be affected by external factors such as financial, regulatory or political events. Trading on margin increases the financial risks.
Before deciding to trade in financial instrument or cryptocurrencies you should be fully informed of the risks and costs associated with trading the financial markets, carefully consider your investment objectives, level of experience, and risk appetite, and seek professional advice where needed.
Fusion Media would like to remind you that the data contained in this website is not necessarily real-time nor accurate. The data and prices on the website are not necessarily provided by any market or exchange, but may be provided by market makers, and so prices may not be accurate and may differ from the actual price at any given market, meaning prices are indicative and not appropriate for trading purposes. Fusion Media and any provider of the data contained in this website will not accept liability for any loss or damage as a result of your trading, or your reliance on the information contained within this website.
It is prohibited to use, store, reproduce, display, modify, transmit or distribute the data contained in this website without the explicit prior written permission of Fusion Media and/or the data provider. All intellectual property rights are reserved by the providers and/or the exchange providing the data contained in this website.
Fusion Media may be compensated by the advertisers that appear on the website, based on your interaction with the advertisements or advertisers.
© 2007-2025 - Fusion Media Limited. All Rights Reserved.
