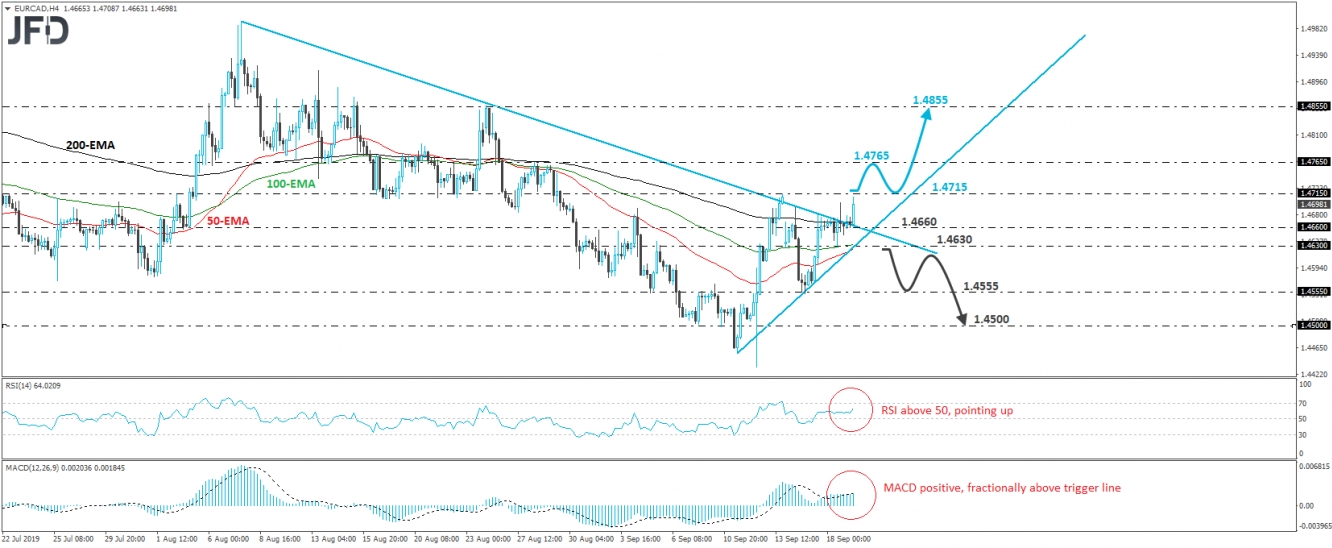
After struggling for a couple of days to overcome the downside resistance line drawn from the peak of August 7th, EUR/CAD bulls eventually managed to distance themselves from that line today. The move also brought the rate decently above the 200-EMA on the 4-hour chart, which combined with the fact that the pair is trading above a new short-term upside support line drawn from the low of September 11th, paints a cautiously positive picture in our view.
Now, the bulls look to be heading towards the 1.4715 barrier, marked as a resistance by the peak of September 13th, the break of which would confirm a forthcoming higher high and make us more comfortable with regards to further advances. We could then see extensions towards the 1.4765 zone, near the high of August 28th, where another break may pave the way towards the 1.4855 zone, marked by the peak of August 26th.
Shifting attention to our short-term momentum studies, we see that the RSI lies above 50 and points up, while the MACD, already positive, stands fractionally above its trigger line, pointing sideways. It could also turn north soon. These indicators detect upside momentum and support the notion for some further near-term advances.
On the downside, we would like to see a clear retreat back below the 1.4630 level before we start examining whether the bulls have left the building, and whether the bears have decided to resume the prior downtrend. Such a dip would bring the rate back below the downside resistance line taken from the high of August 7th, as well as below the new short-term upside one. The sellers could then push the battle towards the low of September 16th, at around 1.4555, the break of which may extend the decline toward the 1.4500 barrier.

