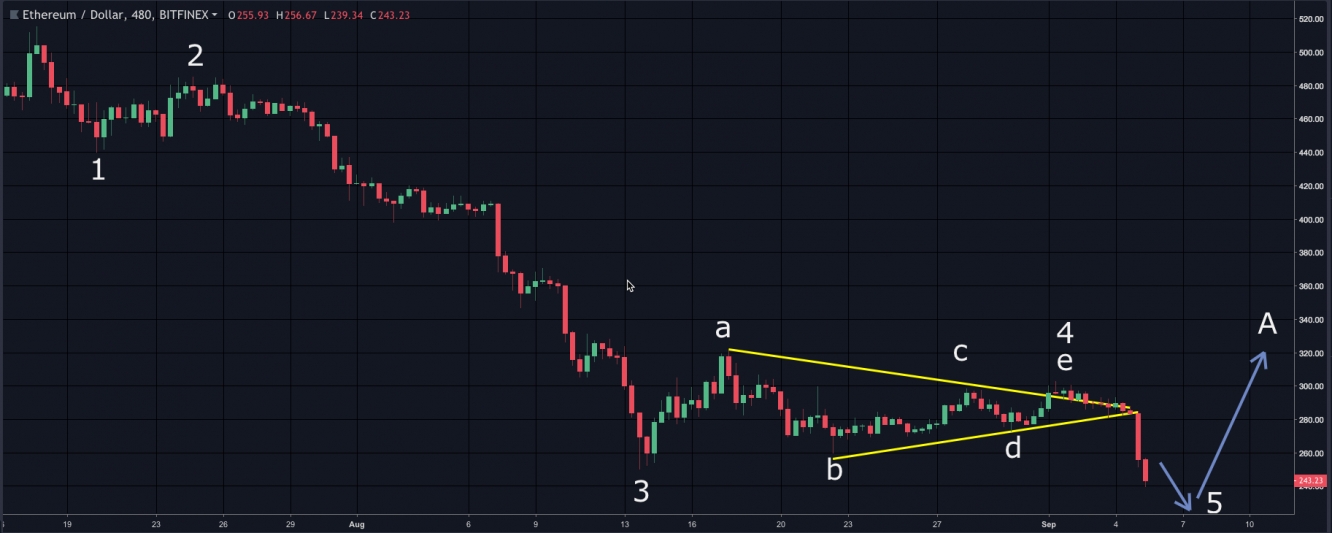
Ethereum has been trading in a tight range over the past few weeks and has recently broken out of the consolidation area and move downward. But will the downtrend continue? I would make the case that is will not, and the next major leg will be to the upside. Let take a look at the 480 minute chart below of Ethereum (ETHUSD) to see why:
As we can clearly see the price of Ethereum, has been under pressure. Ethereum fell from a recent high of 515 back in mid-July to the current price of 244. There is a clear Elliott Wave structure emerging from the price action.
We can see a wave 1 down followed by a fairly deep wave 2 retracement. After that price moved with sharp momentum to the downside. This is characteristic of wave 3 price action. The low of wave 3 was put in place on Aug 18, closing at a price of 249. From there, a contacting triangle began to form. This is denoted with a-b-c-d-e, which marked the end of wave 4.
We can expect one final thrust after wave 4 is complete in the direction of the primary trend. This final leg would be wave 5. So, this is the current condition that we are seeing on the chart. Typically, we can expect the length of wave 5 to equal that of wave 1. Based on this projection. I expect Ethereum to move a bit lower still to around the 230 handle. And then from there, we should begin to see buying demand flow into Ethereum. This would mark the beginning of wave A up. During the wave A move, I expect price to move higher to test the 321 resistance level, which is along the wave a area of the triangle.

