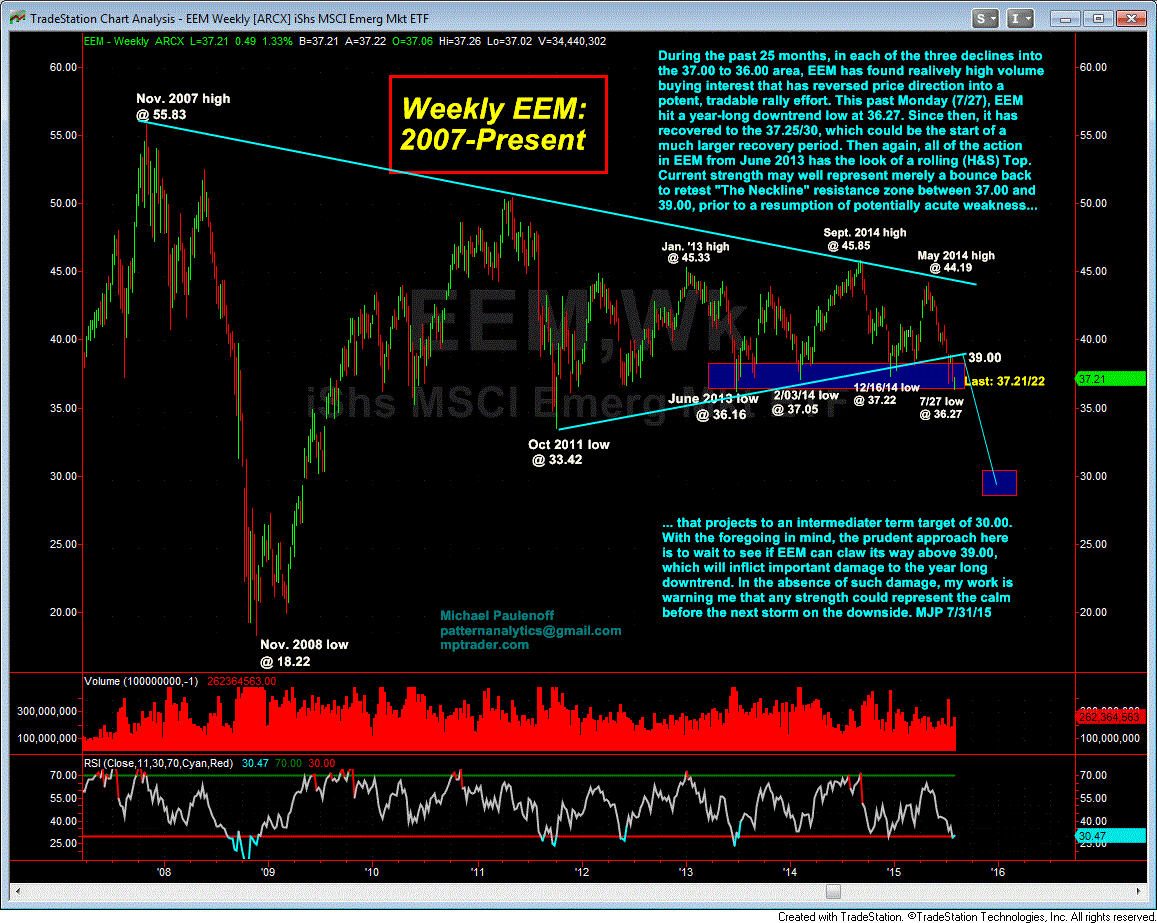
During the past 25 months, in each of the three declines into the 37-to-36 area, EEM has found relatively high-volume buying interest that has reversed price direction into a potent, tradeable rally effort.
This past Monday (July 27), EEM hit a year-long downtrend low at 36.27.
Since then, it has recovered to the 37.25/30, which could be the start of a much larger recovery period.
Then again, all of the action in EEM since June 2013 has the look of a rolling (H&S) top.
Current strength may well represent merely a bounce back to retest the Neckline resistance zone between 37 and 39 prior to a resumption of potentially acute weakness.
That said, the prudent approach here is to wait and see if EEM can claw its way above 39, which will inflict important damage to the year-long downtrend.
In the absence of such damage, my work is warning me that any strength could represent a calm before the next storm on the downside.

