It appeared that the bears firmly took the reins of yesterday’s session, but most of their gains were history before the closing bell. Have we seen an important turning point for oil?
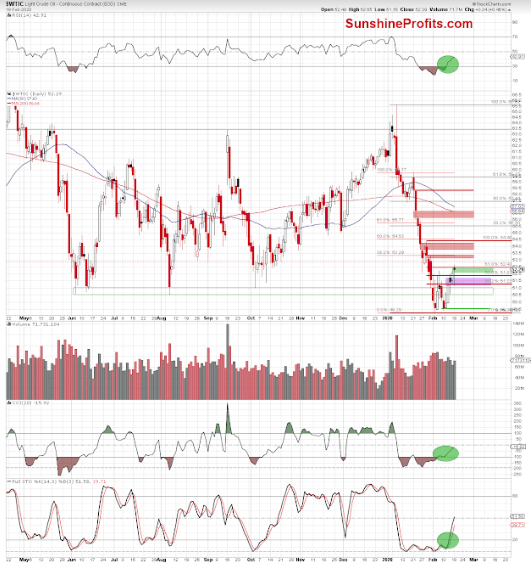
Let’s start with the daily chart examination:

charts courtesy of stockcharts.com and stooq.com

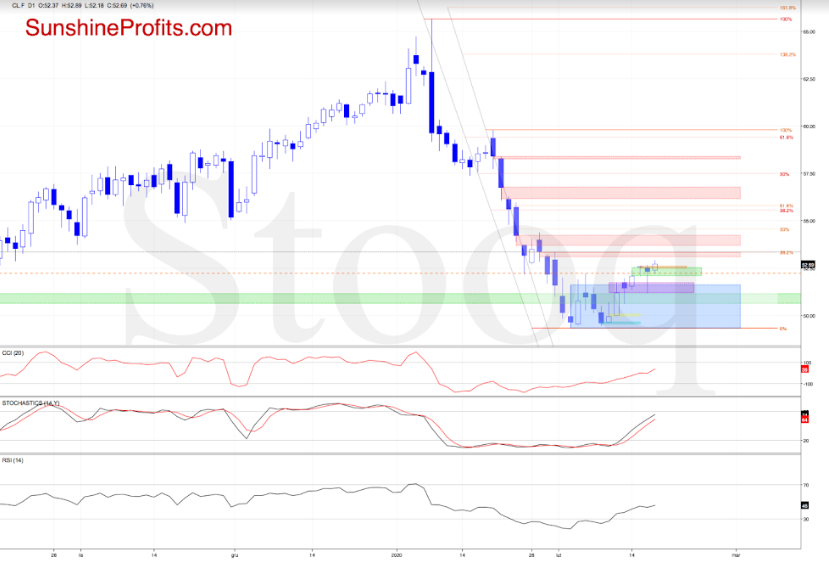
The futures opened today 8 cents above yesterday’s close, creating another bullish gap. This positive development triggered further improvement in the following hours, which resulted in a fresh weekly high and a climb above the bearish orange gap created on Tuesday.
This move also brought the futures above the 61.8% Fibonacci retracement.

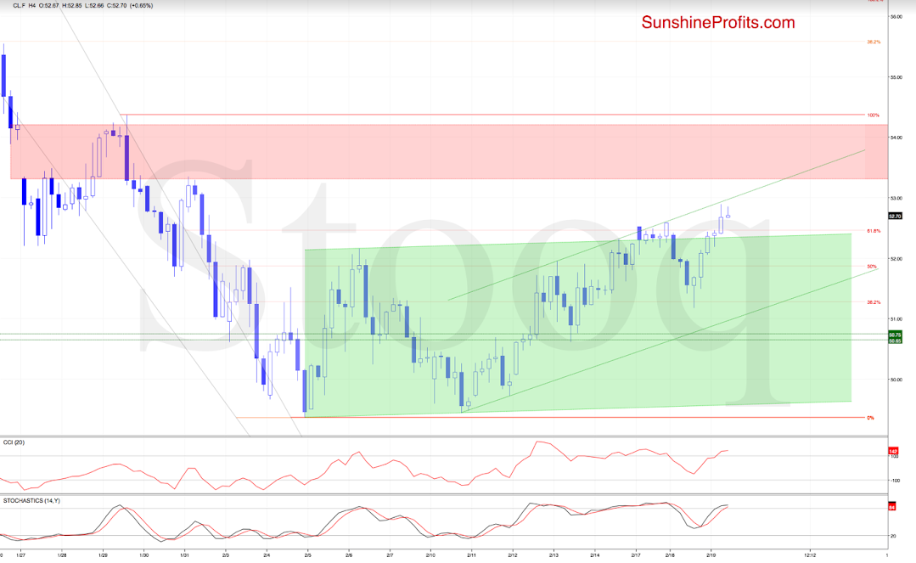
However, as long as there is no daily close above this resistance, another reversal from here and a decline are likely – especially when we take into account these two factors. First, it’s the position of the 4-hour indicators – they are quite close to flashing their sell signals again. Second, it’s the proximity to the green resistance line, which runs parallel to the one based on last week’s lows.
Connecting the dots, should the futures move lower in the following hour(s) and the bears manage to invalidate the earlier small breakout above the 61.8% Fibonacci retracement, what would be the bears’ target? We’ll likely see a test of yesterday’s low and the above-mentioned green support line based on the last week’s lows in the very near future.
Summing up, it seems more likely than not that crude oil is going to decline once again, however given yesterday’s strength betting on lower crude oil prices seems too risky at this moment. Moreover, please note that the USD Index and crude oil have been moving in the opposite directions since the beginning of this year, and since the USD Index might be starting a pullback shortly, perhaps crude oil would move sideways or slightly higher before continuing to decline. When in doubt, stay out.
Crude oil opened yesterday’s session with the green bullish gap that’s slightly below the 61.8% Fibonacci retracement. Although the bulls took the commodity a bit higher after the market open, this strong resistance encouraged the sellers to act.
As a result, the price of black gold moved sharply lower and tested the strength of the pink bullish gap created in the previous week. As it turned out, the bulls were active in this area, and prices staged a comeback. This way, the buyers erased almost the entire earlier decline and closed the day slightly below the opening price.
As a result, the commodity created a bearish candlestick formation – the hanging man about which you could read more in our Tuesday’s alert. Nevertheless, as we mentioned in one breath, this is a single-candle formation, and as such it requires confirmation.
Did yesterday’s price action change anything in the oil short-term picture? In our opinion, not really, because light crude closed the previous session still below the 61.8% Fibonacci retracement.
Has there been any kind of a very short-term change in crude oil futures before today’s market open? Let’s take a look at the charts below to find out.
