Crude Oil is often the focus of daily price moves in the stock market. This past week has been no exception as the OPEC meeting has brought Crude Oil to the forefront again. But being part of the news cycle does not make it an automatic catalyst for change in the broad stock market. In fact the big move in Crude Oil this week has been followed by very little response in other markets if you look beyond the headlines.
But these small daily moves in Crude Oil are really just noise in the big picture. Crude Oil, in the longer view, is not so volatile and in fact may be capped in the next few months. The long-term chart below helps to paint the picture.

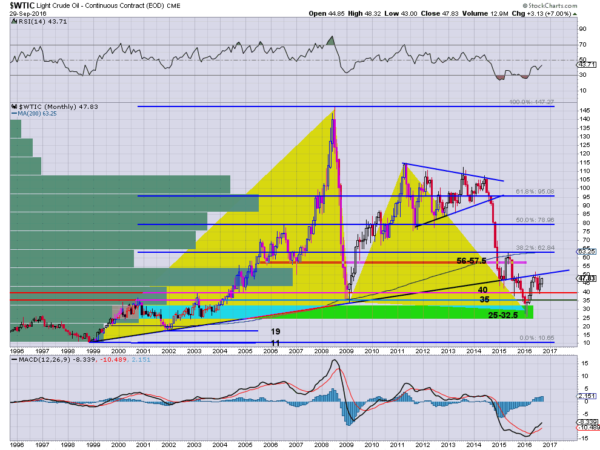
Crude Oil has a lot going on in its monthly chart. The prominent double triangle highlights a bullish Bat harmonic pattern. This would suggest an upward trajectory to at least a 38.2% retracement of the pattern. That would give a target to about $63. This happens to be where the 200 month SMA sits as well. This would imply there is less resistance to get there as many would continue to retain a bearish view to that point.
But there is also a nasty long term trend line in the way of a move higher. This 17 year trend line that acted as support until last year, is now acting as resistance. Looking left at the volume profile there is a ceiling at this level, high trading volume that leaves many with a basis in Oil near this price. That could be holding it back.
The momentum indicators suggest there is power to push higher. The RSI is running up, still bearish but rising, while the MACD has crossed up. Both are short of a strong confirmation by moving into bullish zones though. These suggest this could just be a dead cat bounce. As time ticks on there are two areas to watch to glean insight into the long term direction of Crude Oil. Can it break and hold over the long term trend lone, over $50. If so then lean to the bullish side. A move back under $40 would go along way to confirming that dead cat bounce. Until then, more sloshing around and much media hype.
