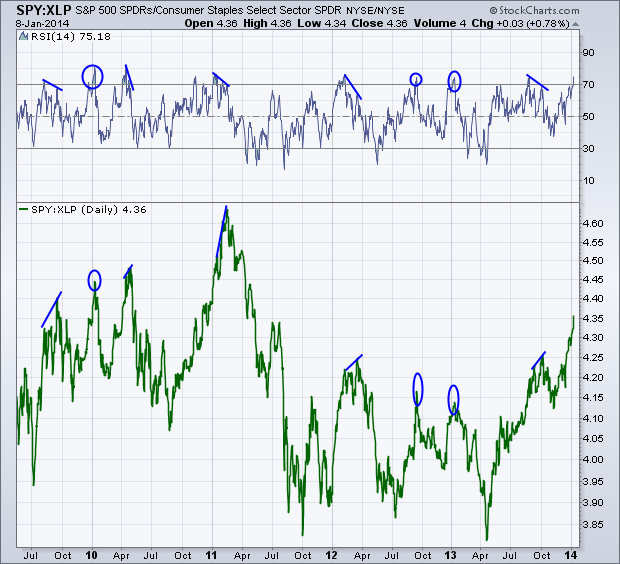
The chart I want to look at today is an interesting one because what we are seeing on the daily price action is also taking place on the weekly chart as well.
One of the ways we can ‘monitor’ risk-taking in the market is by the relative performance of the S&P 500 (SPY) and Consumer Staples (XLP) ETFs. Typically when traders are taking on more risk and equities are heading higher we see the overall equity market outperform the lower-beta staples sector. Now I’m not using this chart to say that stocks will head lower, but I simply want to point out that the relationship between $SPY and XLP appears to be approaching overly extended levels.
The chart below shows the daily movement of the ratio between SPY and XLP, as the line rises we know that the S&P 500 is rising more or falling less than XLP. I like to use the Relative Strength Index (RSI) to measure momentum of these types of relationships. I’ve marked with a blue line the past divergences that have taken place in the RSI indicator and price action, showing when momentum has begun to negatively diverge as the price ratio continues to rise. I’ve also put circles on past instances where a divergence did not occur but RSI had broken above 70 into ‘overbought’ territory.
As of today we do not have a divergence but on both the weekly (not shown) and the daily chart we do have the Relative Strength Index overbought. This could lead to a few different scenarios. We could see a repeat of late 2010 when RSI broke above 70 and the S&P continued to outpace staples, a divergence could occur as momentum breaks down and leads to a shift in XLP’s favor, or we could see the ratio change trends now and create a quick mean reversion action without the need for a divergence in the RSI.
I’ll be watching this relationship closely and see how momentum acts as things progress and if we start to see traders begin to favor consumer staples over the equity market as a whole.
Disclaimer: Do not construe anything written in this post or this blog in its entirety as a recommendation, research, or an offer to buy or sell any securities. Everything in this post is meant for educational and entertainment purposes only. I or my affiliates may hold positions in securities mentioned in the blog. Please see my Disclosure page for full disclaimer. Connect with Andrew on Google+, Twitter, and StockTwits.

