CHF/JPY may not be the immediate choice for a speculative trade but, with it displaying such a directional move, we think it’s worthy of a look.
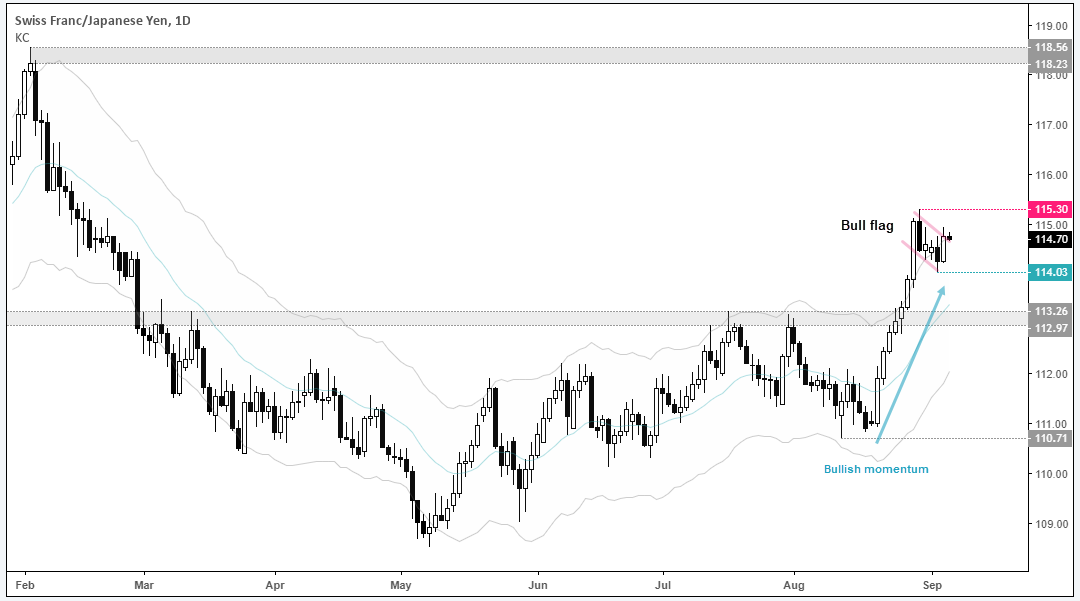
We can see on the daily chart that a bullish breakout occurred last week, taking it to a six-month high. Although there were two minor attempts to break 113.26 resistance in July, there was little hesitation on the third attempt before racking up seven consecutive bullish closes. Still, its impulse burst clearly got ahead of itself after stretching beyond the upper Keltner band, although we see this as a temporary issue given the strength of the underlying breakout.

What makes the pair more appealing now is the signs of compression at the highs. Whilst the daily structure remains firmly bullish, the shakeout at these highs has provided a low volatility retracement in the form of a bull flag. In turn this could spur a fresh round of buying to take momentum back in line with the original breakout. So, we’re going to keep a close eye for a break above 115.30 to mark the resumption of its trend.

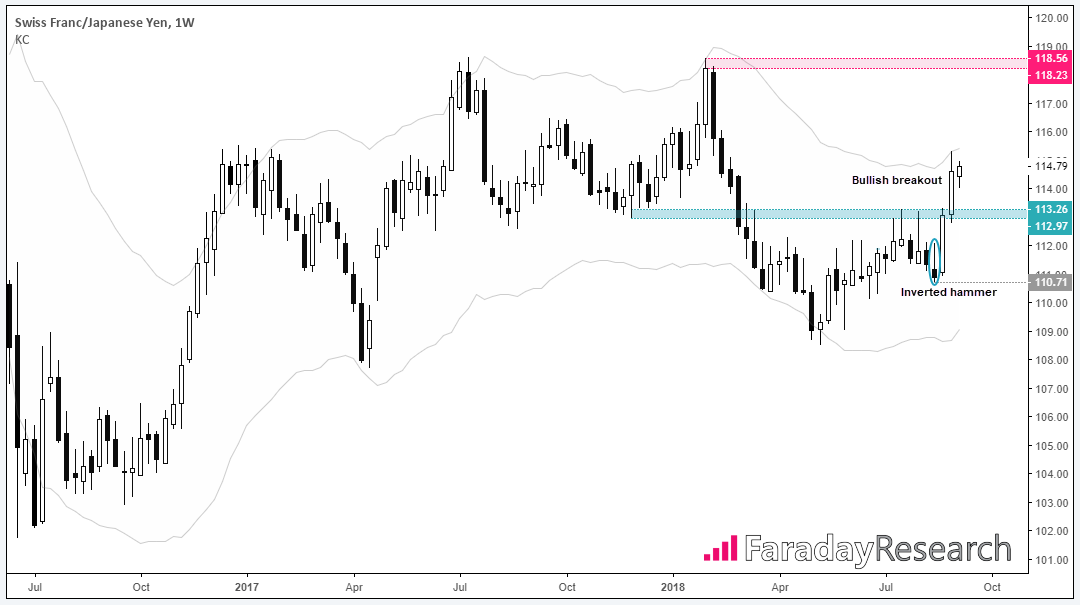
Switching to the weekly chart, we can see little stands in the way of resistance until the 118.23/56 highs. Given the higher low (inverted hammer), strength of the breakout and touch of the upper Keltner band, we’ve likely seen a change of trend which means the 2018 highs are a viable target.
