💥 Fed cuts sparks mid cap boom! ProPicks AI scores with 4 stocks +23% each. Get October’s update first.Pick Stocks with AI

Is CAD/JPY Set To Continue Its Journey North?

Published 05/25/2020, 07:01 AM
Updated 07/09/2023, 06:31 AM
CAD/JPY
-

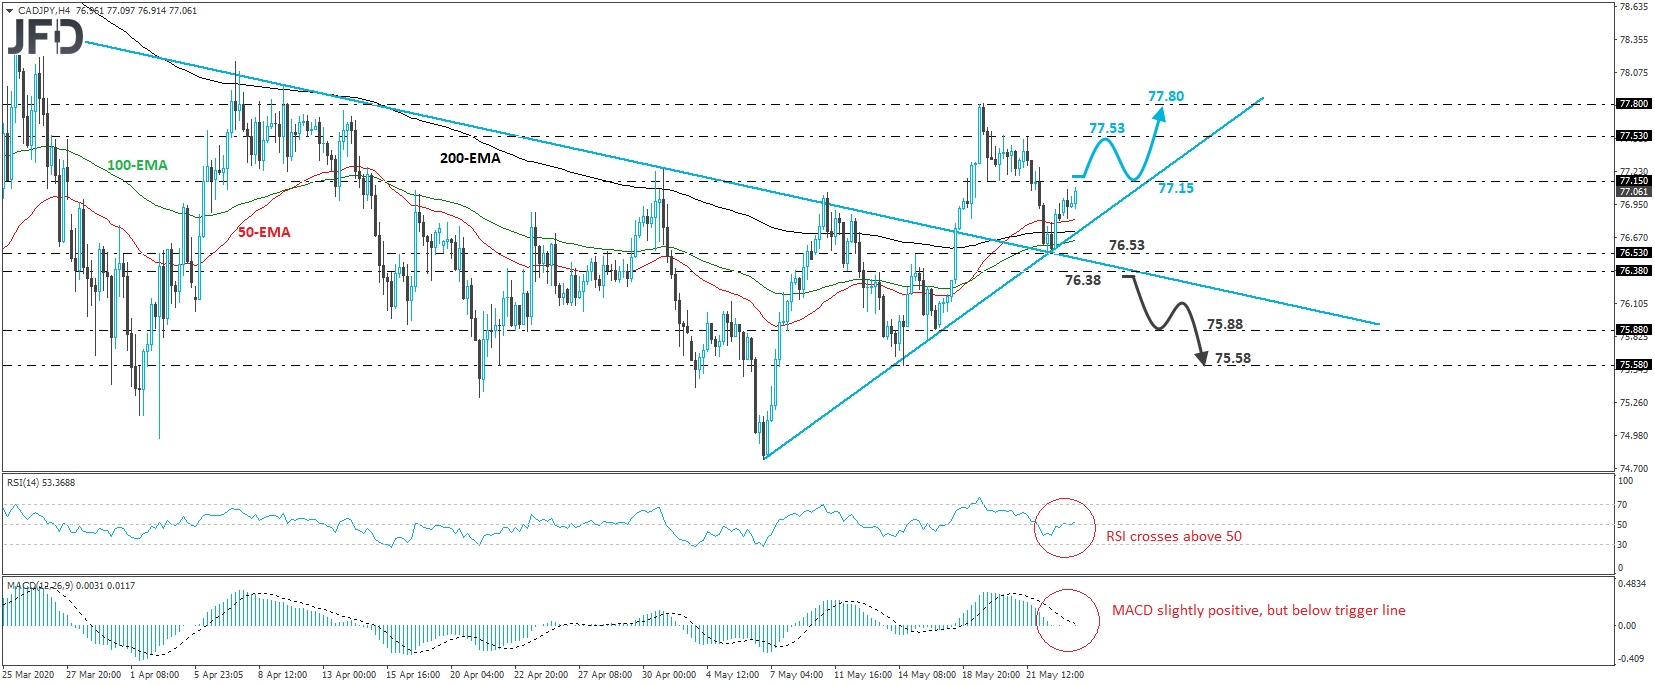
CAD/JPY continued trading higher on Monday, after it hit support at 76.53 on Friday. That level also coincides with the crossroads of a prior downside resistance line drawn from the peak of March 26th, and an upside one taken from the low of May 5th. Thus, having that in mind, as well as that the rate is trading above all three of our moving averages on the 4-hour chart, we would consider the near-term outlook to be positive for now.

A strong break above the 77.15 zone, which is marked as resistance by the inside swing low of May 20th, may give to the bulls the green light to continue sailing north and perhaps target the peak of the next day, at around 77.53. They may decide to take a break after testing that area, thereby allowing the rate to correct lower. However, as long as it will be trading above the aforementioned upside line, we would see decent chances for another leg north, which could overcome the 77.53 barrier and aim for the high of May 19th, at 77.80.

Shifting attention to our short-term oscillators, we see that the RSI rebounded and just poked its nose back above its 50 line, but the MACD, although fractionally positive, still stands below its trigger line. This makes us somewhat careful with regards to the upside, and that’s why we prefer to wait for a break above 77.15 before we get more confident on that front.

On the downside, we would like to see a strong dip below 76.38, before we start examining whether the bears have stolen the bull’s swords. Such a break would signal the rate’s return below the downside line taken from the high of March 26th and may initially allow declines towards the low of May 17th, near 75.88. Another break, below 75.58, could extend the slide towards the 75.58 territory, marked as a support by the low of May 14th.
CAD/JPY 4-hour chart technical analysis

Latest comments

Loading next article…
Risk Disclosure: Trading in financial instruments and/or cryptocurrencies involves high risks including the risk of losing some, or all, of your investment amount, and may not be suitable for all investors. Prices of cryptocurrencies are extremely volatile and may be affected by external factors such as financial, regulatory or political events. Trading on margin increases the financial risks.
Before deciding to trade in financial instrument or cryptocurrencies you should be fully informed of the risks and costs associated with trading the financial markets, carefully consider your investment objectives, level of experience, and risk appetite, and seek professional advice where needed.
Fusion Media would like to remind you that the data contained in this website is not necessarily real-time nor accurate. The data and prices on the website are not necessarily provided by any market or exchange, but may be provided by market makers, and so prices may not be accurate and may differ from the actual price at any given market, meaning prices are indicative and not appropriate for trading purposes. Fusion Media and any provider of the data contained in this website will not accept liability for any loss or damage as a result of your trading, or your reliance on the information contained within this website.
It is prohibited to use, store, reproduce, display, modify, transmit or distribute the data contained in this website without the explicit prior written permission of Fusion Media and/or the data provider. All intellectual property rights are reserved by the providers and/or the exchange providing the data contained in this website.
Fusion Media may be compensated by the advertisers that appear on the website, based on your interaction with the advertisements or advertisers.
© 2007-2024 - Fusion Media Limited. All Rights Reserved.