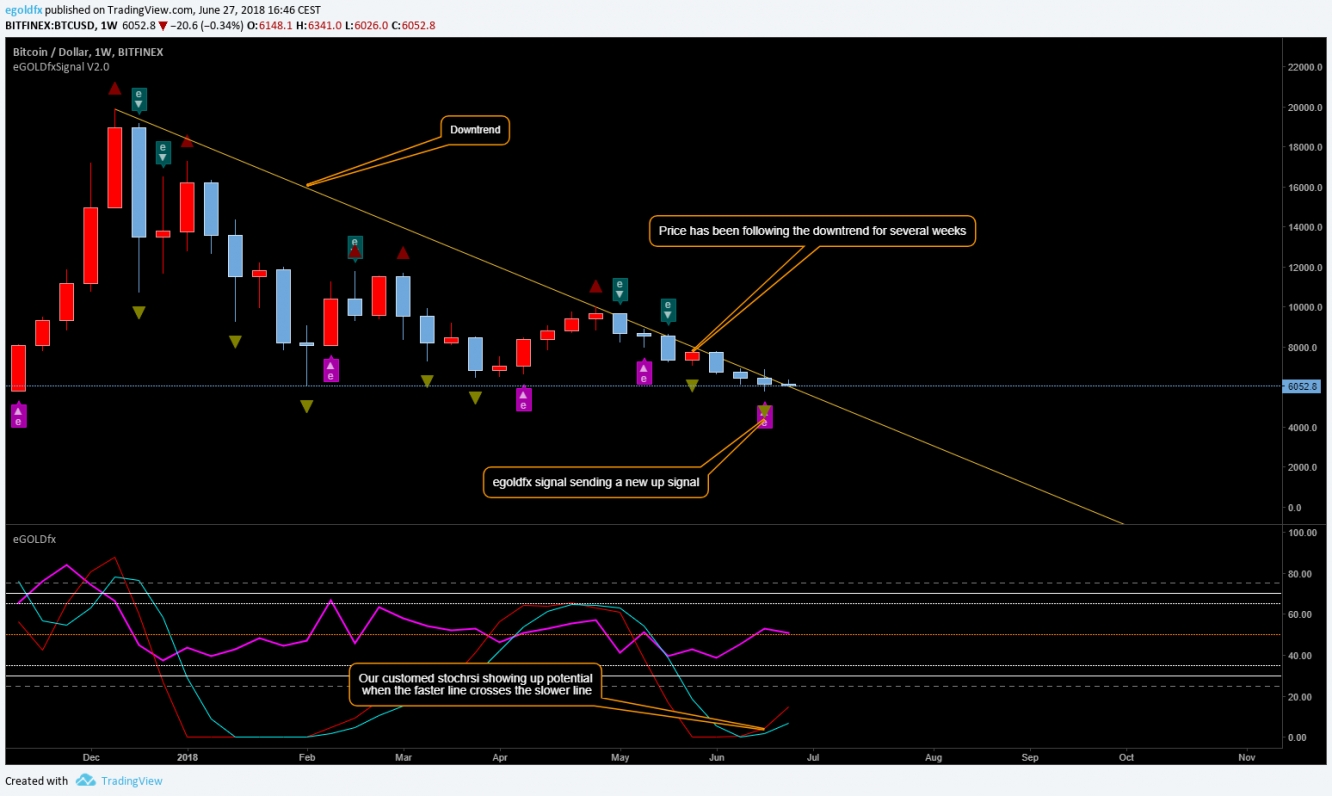
Since Bitcoin's highest high on Dec. 2017, its price keeps falling.
Lately, every retracement in this downtrend lures investors by making them think that we are finally approaching a deeply expected market reversal and a new long and generous uptrend, as seen in December 2017, will finally start.
Such reversal could potentially recover all the loss from the downtrend and even break the highest high... BUT...
Those are just thoughts... what about facts? Are we near the end of this never ending downtrend?
Bitcoin price is getting closer to its cost to mine... +/- $6000 is approximately the price to mine one BTC, and so this price should fundamentally act as a strong support.
Let see what the chart is telling us using the egoldfx algorithm
A potential break of the down trendline could be possible soon. If this week candle closes above the trendline then it will be a good sign that we might soon finally see some up momentum. Only a new down egoldfx algorithm signal could void this uptrend signal.
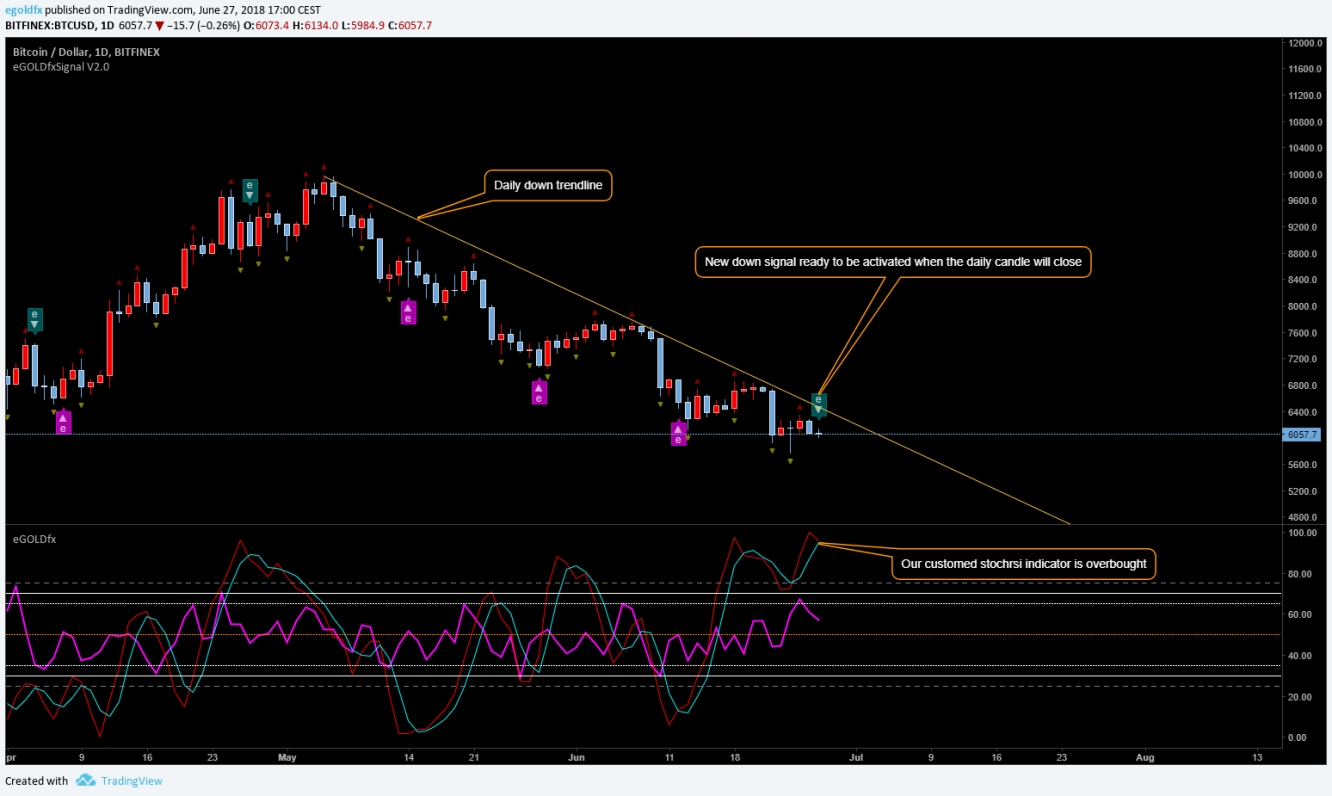
But before that, we can probably expect another move down since on a lower timeframe (Daily) things are turning south as seen on the following chart:
Will it move down? only after the close of this daily candle, the egoldfx algorithm will let us know that.
Until then
Good trading
egoldfx team


