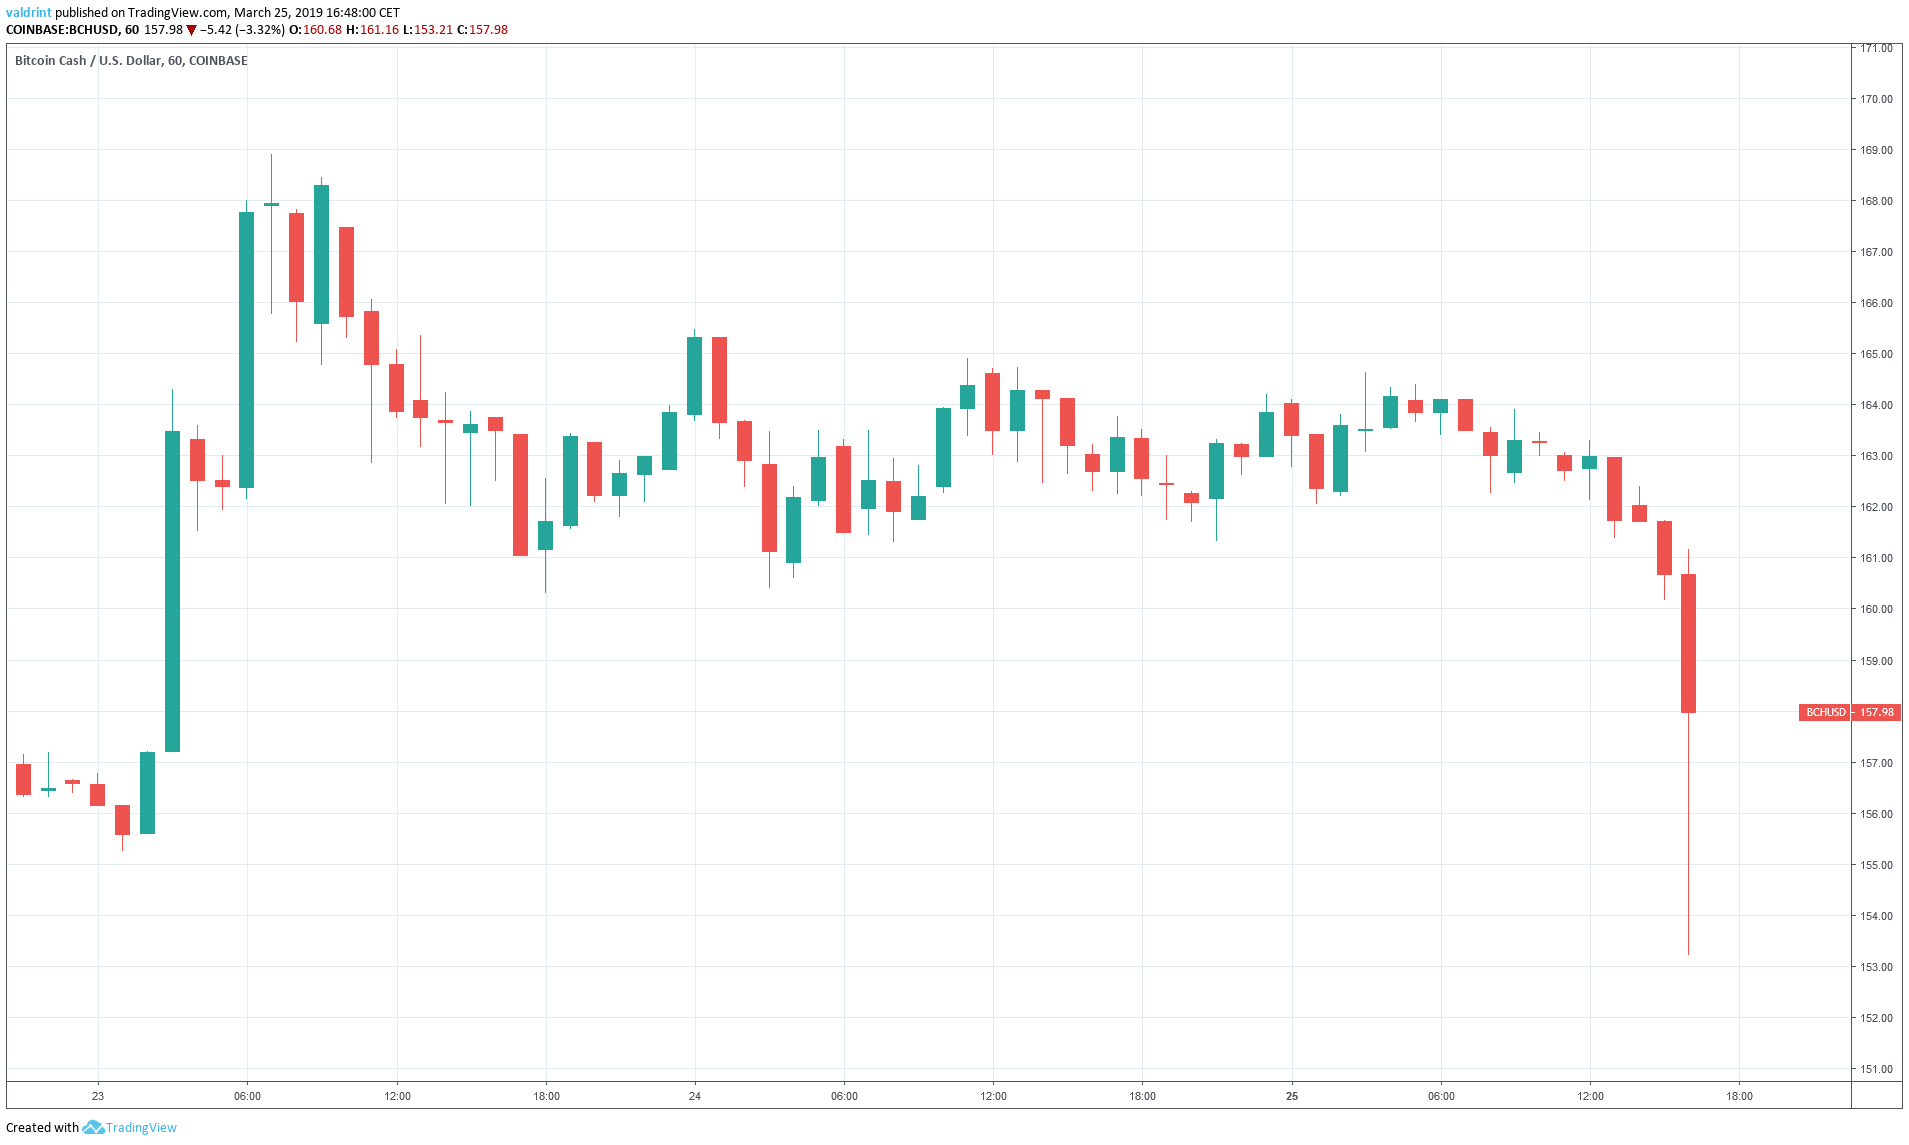
On March 23, 2019, the price of Bicoin Cash (BCH) reached a high of nearly $169. A gradual drop ensued. Price decreases accelerated on Mar 25.
First, here is a look at prices in the period from Mar 23 to Mar 25:
Based on our analysis, the price of BCH is likely to keep trading close to the support line defined below and possibly break down.
BCH: Trends And Highlights For March 25, 2019
- The price of Bitcoin Cash (BCH) made a high of $168.90 on Mar 23.
- A sharp drop ensued.
- Price broke down from a symmetrical triangle on Mar 25.
- There is long-term bearish divergence developing in the RSI and the MACD.
- There is resistance near $165.
- There are support areas near $145, $135 and $123.
Previous Breakdown
The price of BCH on Coinbase is analyzed at one-hour intervals from Mar 23 to Mar 25.
BCH reached a high of $168.9 on Mar 23. A sharp drop ensued. The price made a lower high of $165.40. It has continued to create lower highs since.
Tracing these highs gives us a descending resistance line
After the $168.9 high, the price made a low of $162.5. A gradual uptrend ensued, with each low being higher than the previous one.
Tracing these lows gives us an ascending support line.
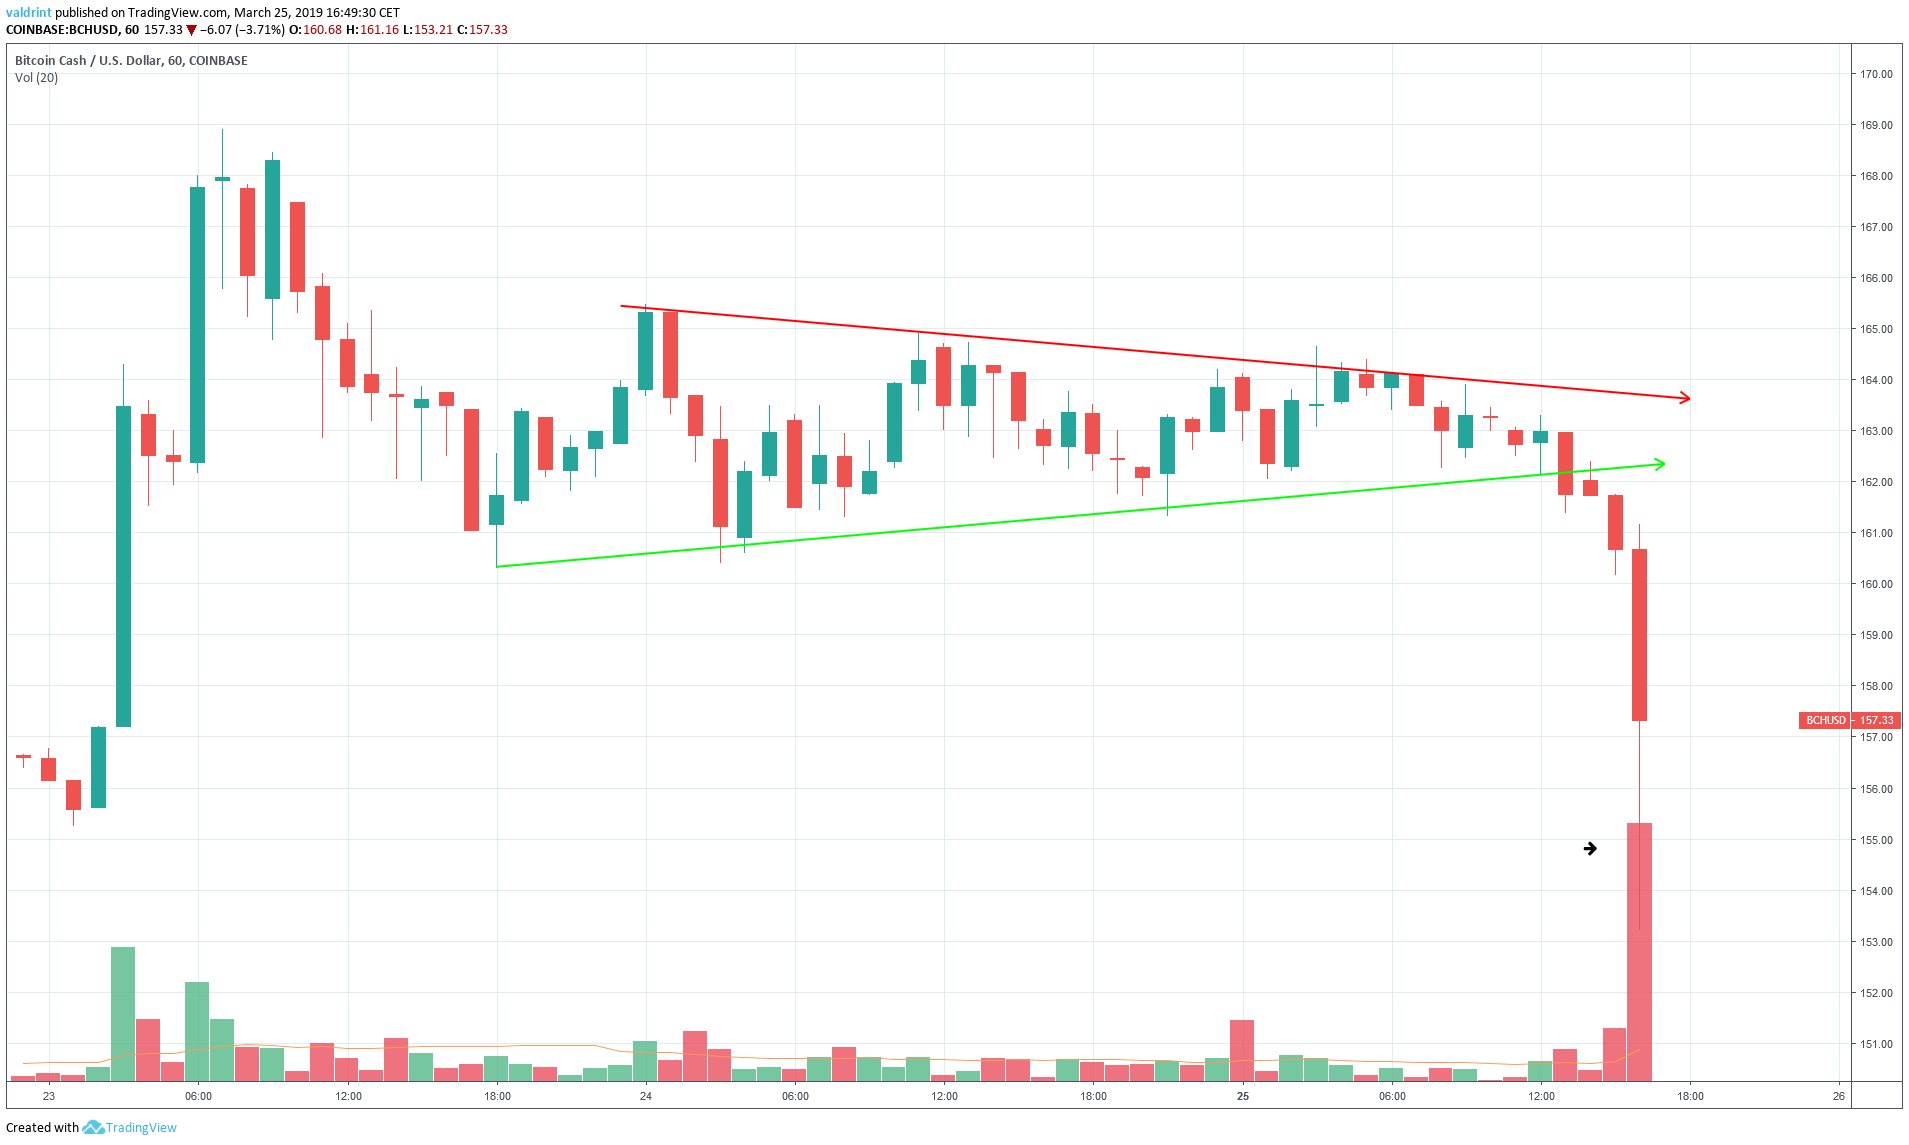
The resistance and support lines combine to create a symmetrical triangle. The triangle is a better predictor of price fluctuations than support or resistance lines alone.
A breakdown occurred on Mar 25.
Volume is a measure of how much of a certain asset is traded in a certain period of time.
We can see that the breakdown occurred with very significant volume.
Based on the speed and volume of the breakdown, it is likely that further price decreases are in store for the future.
Symmetrical Triangle
The price of BCH on Coinbase is analyzed at two-hour intervals from Mar 15 to Mar 25.
On Mar 17 the price made a low of $145.76. A sharp upward move ensued, followed by a gradual downward move. Several market cycles have been completed with each low being higher than the previous one.
Tracing these lows gives us an ascending support line.
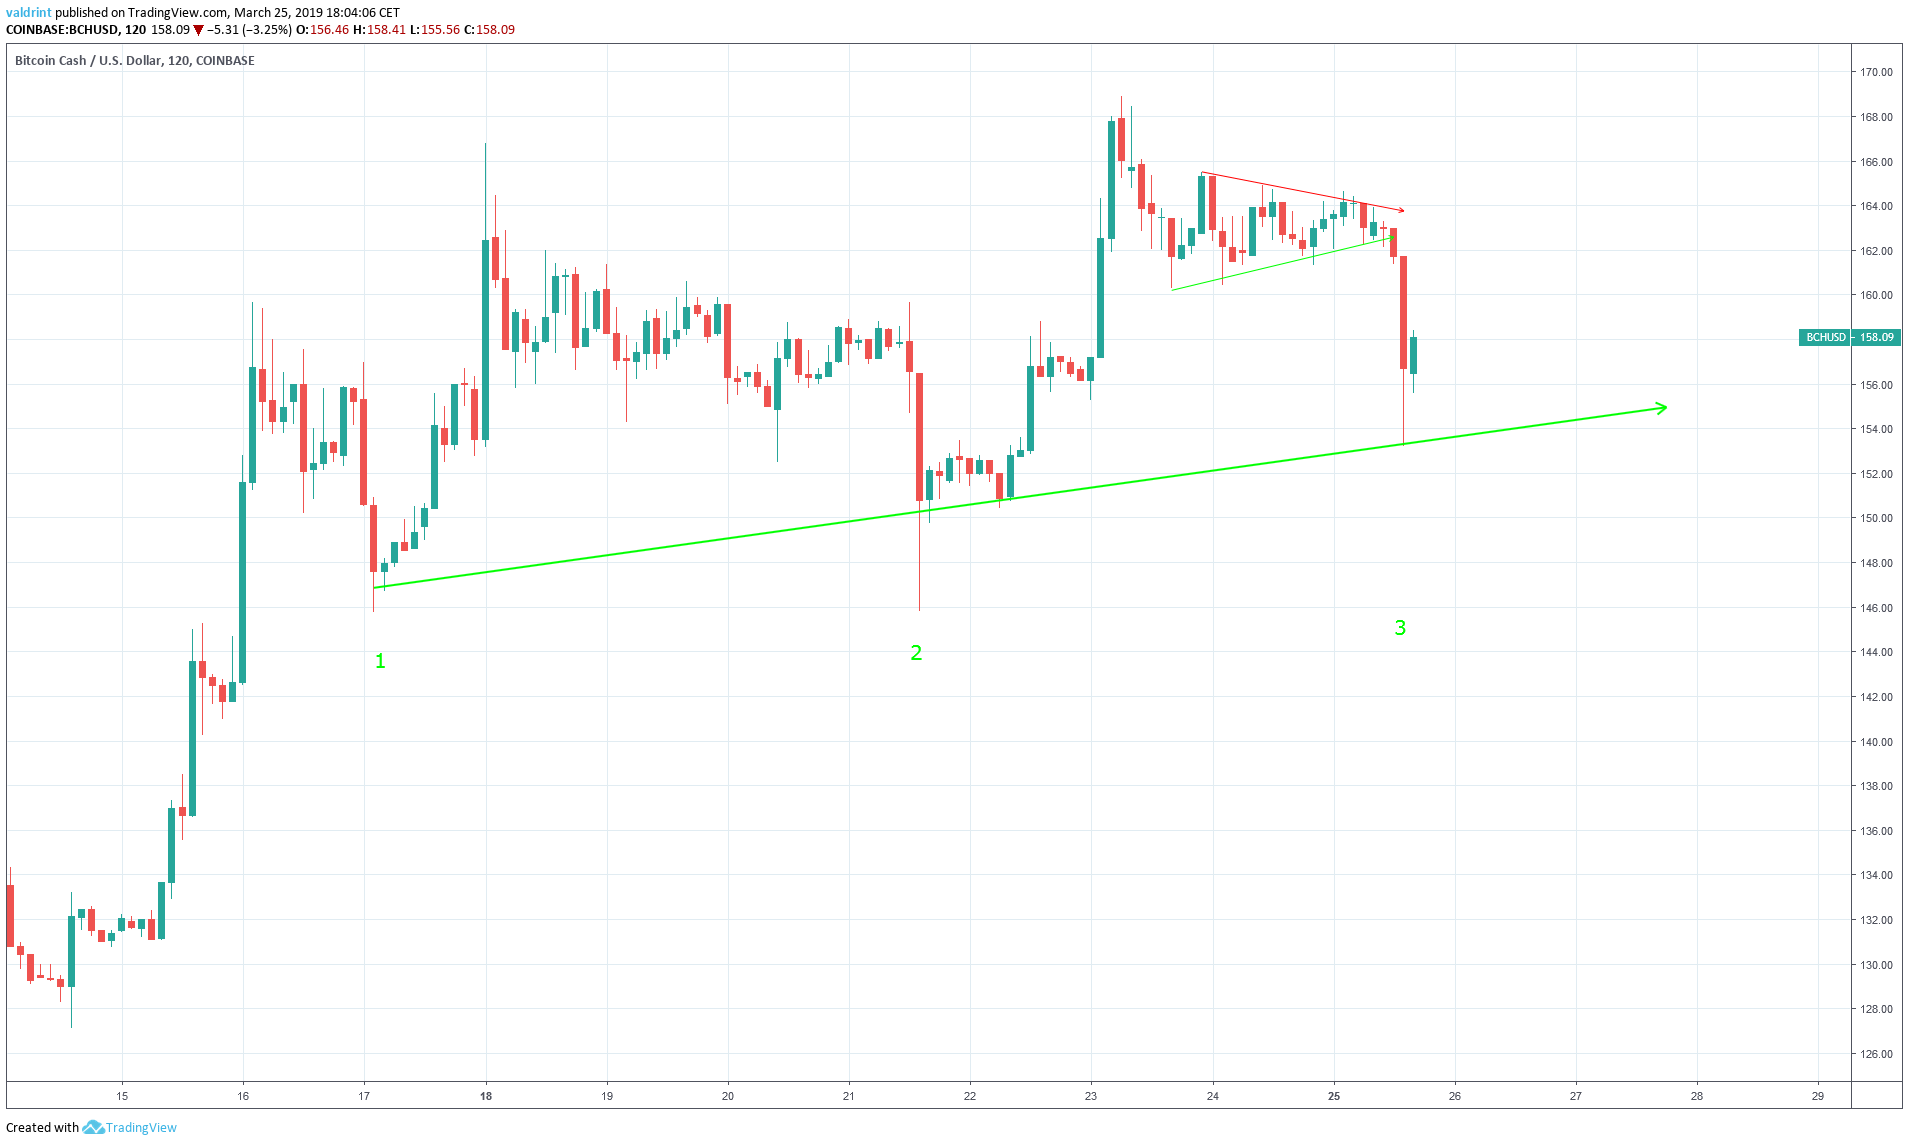
The support line acts as a floor to price, preventing further downward movement. It theoretically traces the lower limits of the price.
Movements below the line such as the wick breakdown of $145.81 on Mar 21 can be considered insignificant since they were not supported by continuous losses.
We can see that the price is not following a clear resistance line.
We can see that after the breakdown from the symmetrical triangle, the price bounced successfully at the support line.
Will the support line be able to prevent price from decreasing further? Let’s find out
Start Of A Downtrend?
The price of BCH on Coinbase is analyzed at six-hour intervals from Feb 22 to Mar 25 in order to analyze the strength of the prior upward move.
Combining MACD and RSI bullish/bearish divergence with support/resistance essentially predicts price fluctuations.
The moving average convergence divergence (MACD) is a trend indicator that shows the relationship between two moving averages (long and short-term) and the price. It is used to measure the strength of a move. The relative strength index (RSI) is an indicator which calculates the size of the changes in price in order to determine oversold or overbought conditions in the market.
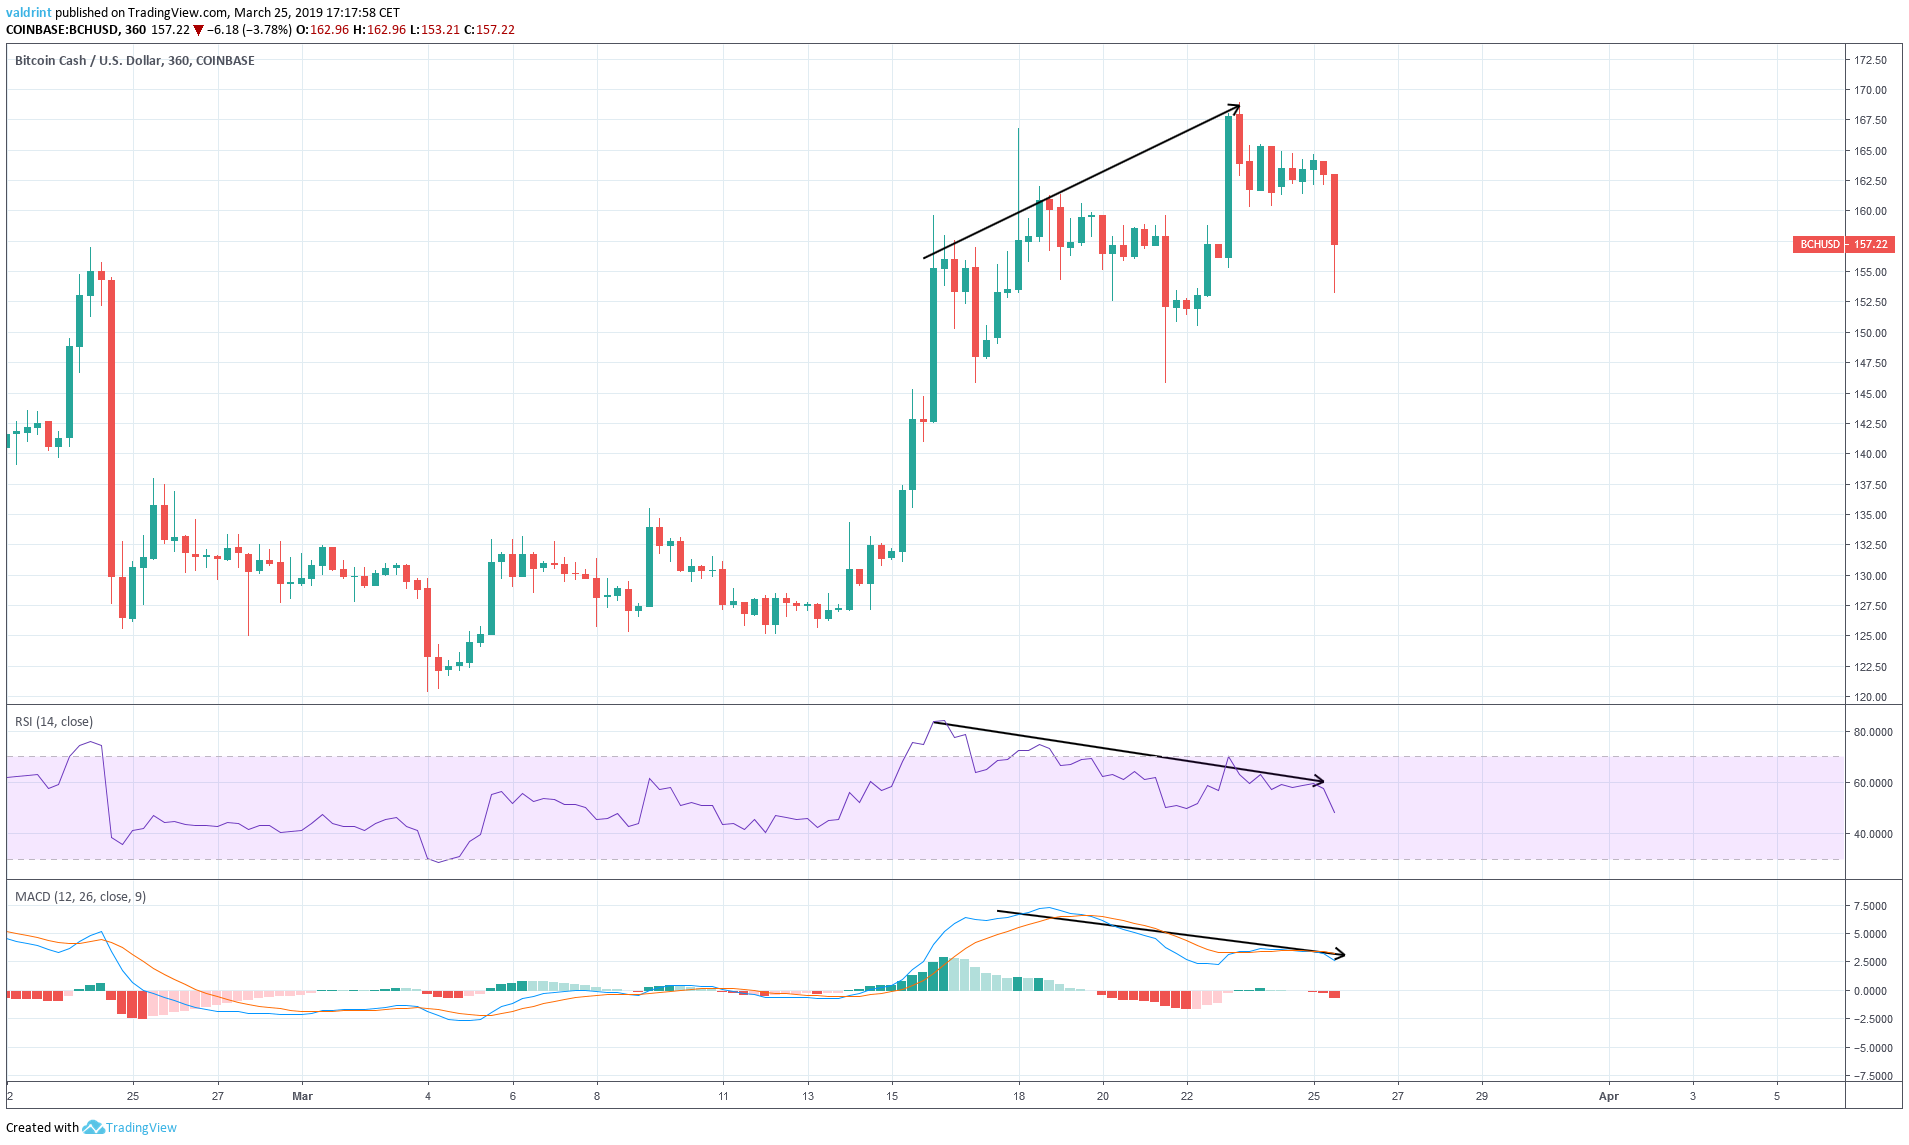 On Mar 16, the price made a high of $159.64. It eventually proceeded to make another high of $168.9 on Mar 23.
Both the RSI and the MACD made the first high on Mar 16. However, they have proceeded to create lower values since.
This is known as bearish divergence and often precedes price decreases.
In the case of BCH, it can be considered effective since it is significant in value and it is occurring in long-term timeframes.
Using these indicators, an upcoming correction in price for BCH appears likely. This current drop in price may mark the beginning of this correction and the possibility that the support line will not hold. However, if the price makes a high above $170, the correction may be postponed for an indeterminate amount of time.
Future Movement
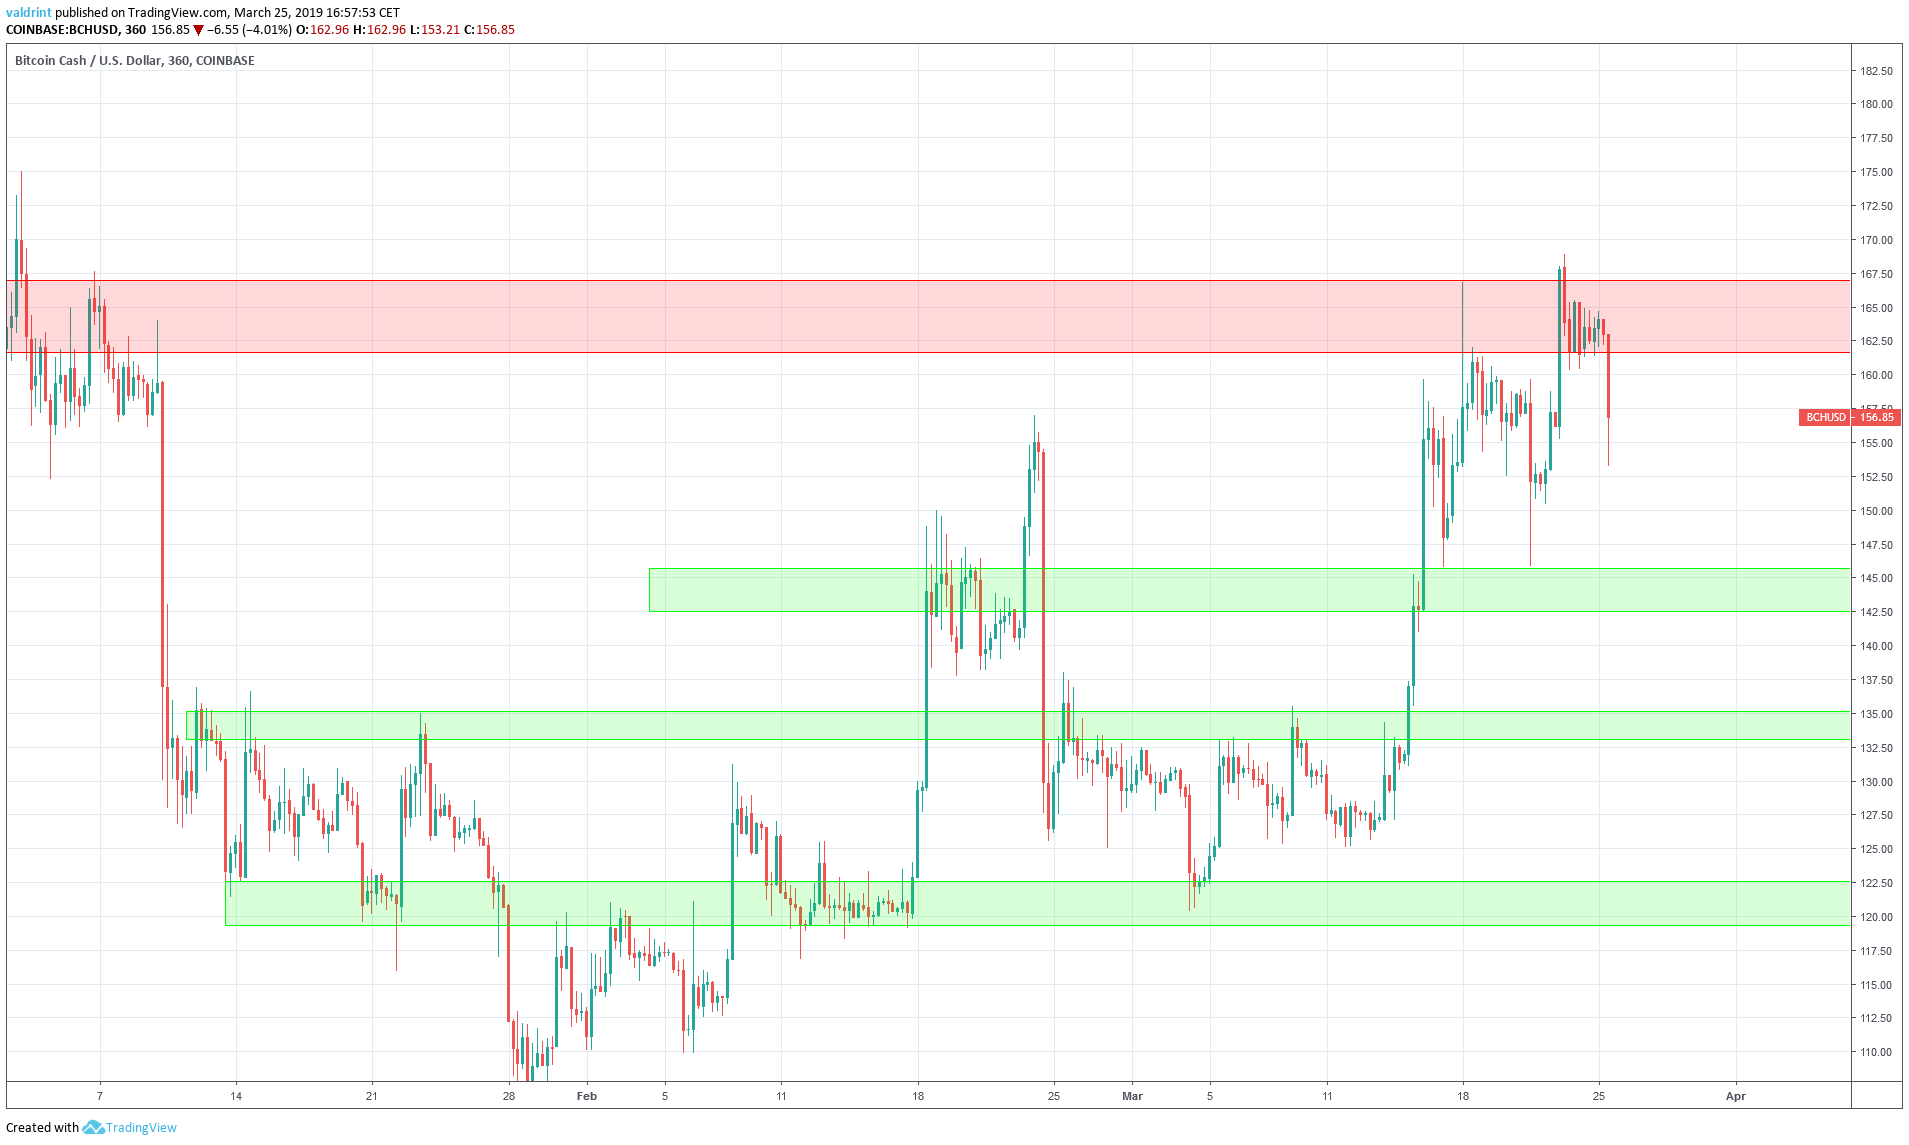
The price of BCH on Coinbase is analyzed at six-hour intervals from Jan 6 to Mar 25 in order to better visualize areas of reversal.
Resistance and support areas are formed when the price reaches a certain level several times. They can act as a ceiling/floor that prevents the price from moving further in that direction.
The closest resistance area is found near $165, close to the Mar 23 high. If the price were to bounce from support and initiate an upward move, it would provide a likely reversal area.
The first support area is found near $145, followed by the second on near $135 and the final support near $123. If the price were to break down from the support line, these would be likely support areas. According to our analysis, it is likely that the price reaches at least one of these areas.
Summary Of Analysis
Based on this analysis, the price of BCH is likely to trade close to the support line, before potentially breaking down. If the price stays close to the support line, trading below $160, this prediction may be partially validated. If it eventually breaks down, the prediction will be fully validated.
Disclaimer: This article is not trading advice and should not be construed as such. Always consult a trained financial professional before investing in cryptocurrencies, as the market is particularly volatile.

