Investing.com’s stocks of the week
On popular demand, it is time to offer an update on high-flier Tesla Inc (NASDAQ:TSLA). Back in early December, I expected it to reach the high-600s to low-700s. Yet, here we are in the mid-800s. What happened?
As is not uncommon in this bull market, it experienced what in the Elliott Wave Principle (EWP) world is called an extended 5th wave in the major- and intermediate-degree. Those can always happen and are impossible to know beforehand.
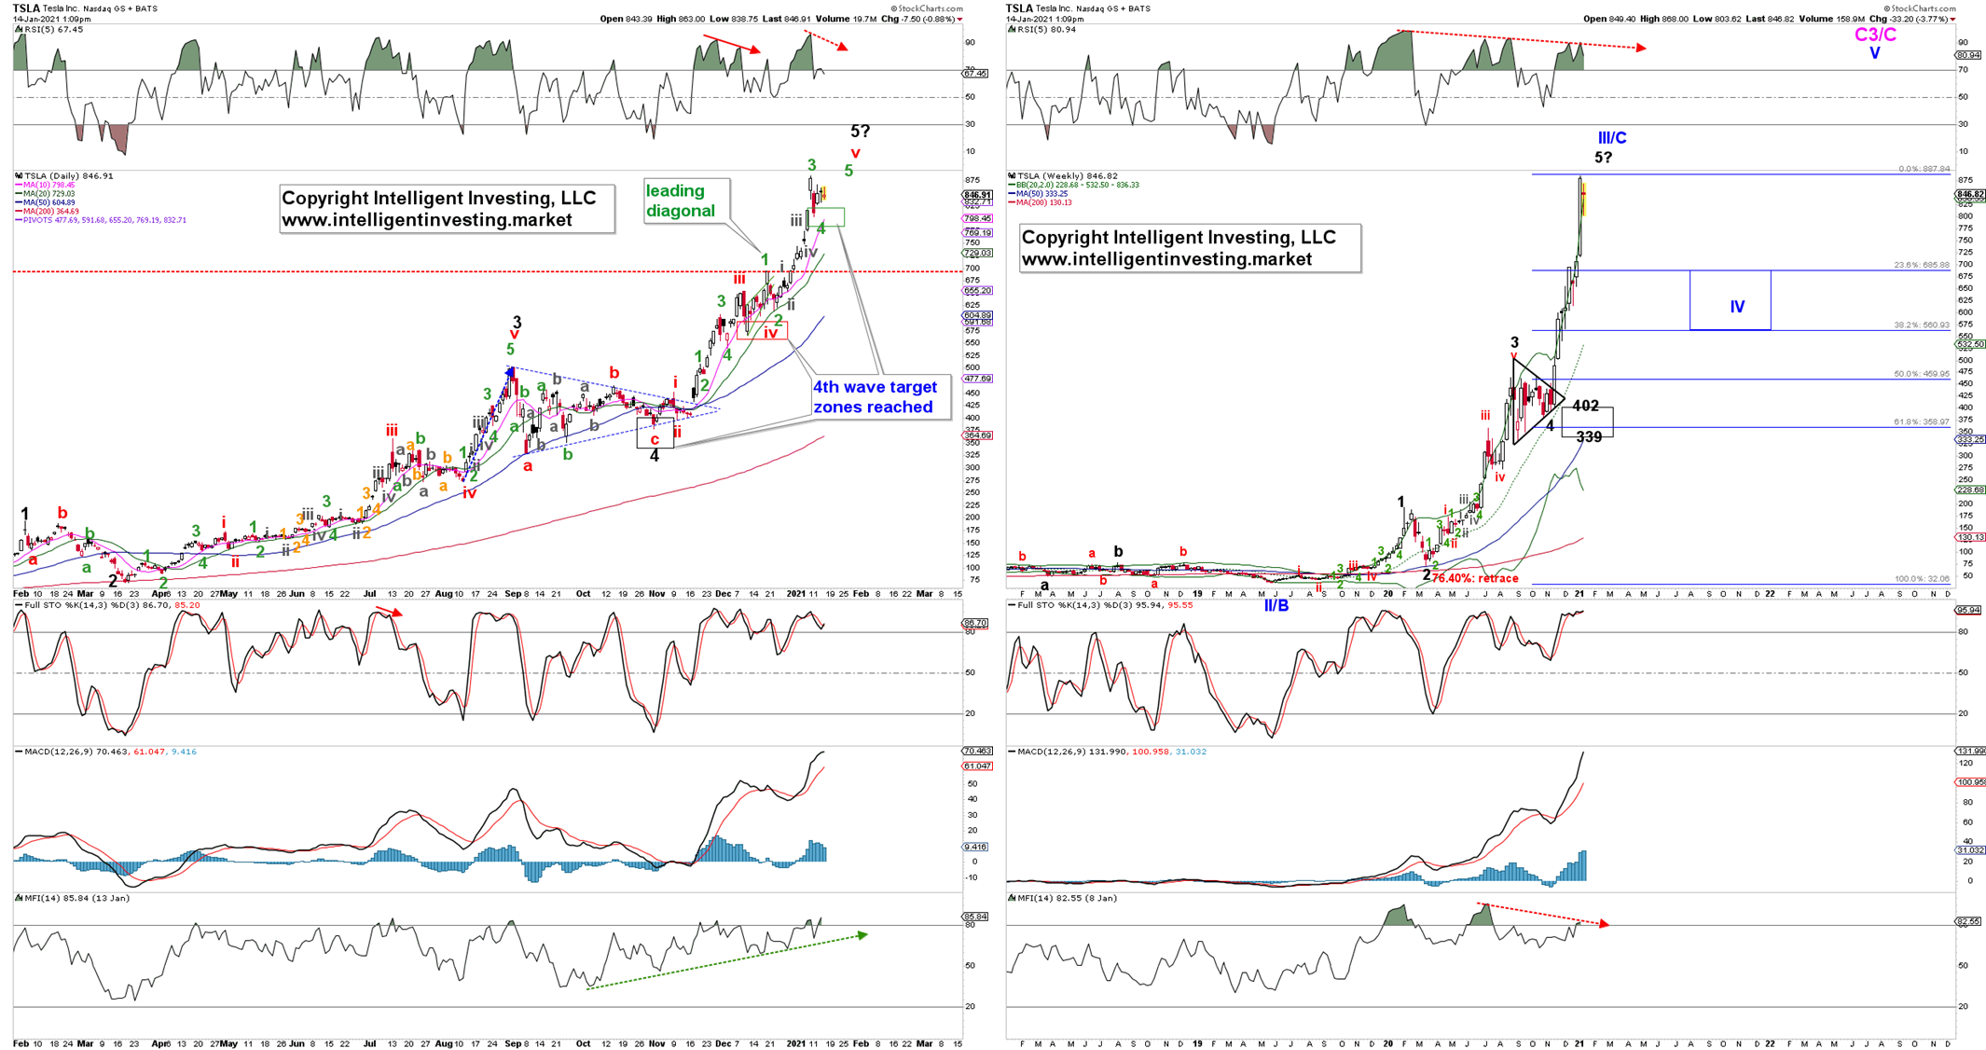
The EWP's beauty is that in an impulse, we know after wave three comes four and, after four, comes 5. Looking at the daily chart in Figure 1 below, TSLA has each time pulled back into the ideal 4th wave target zones (23.6 to 38.3% retraces of the prior same-degree 3rd wave) and rallied from there. Now, it should be completing (green) minor wave-4, followed by a minor-5 to complete (red) intermediate-v of (black) major-5.
Figure 1. TSLA daily and weekly candlestick chart with EWP Count and Technical Indicators:

The weekly chart in Figure 1 shows that when major-5 completes, at around current levels ($875-925), assuming (green), minor-5 does not subdivide into five smaller minute-waves, (blue) primary III completes and Primary-IV will take center stage. There are currently negative divergences developing on the weekly technical indicators, foretelling of a pending more extensive correction. Although divergence is only divergence until it is not, the RSI5 (relative strength) is weakening since February 2020, and so is money flow (MFI14). The latter is crucial as it means less money is pouring into Tesla's stock at current levels. Since liquidity drives markets, divergences on money flow, both positive and negative, can help identify potential turning points.
A correction of the primary-degree is a large one, in both time and price, and suggests TLSA should see between $560-600 before primary-V to new all-time highs kicks in. These all-time highs should be in the $1200-1500 region. It is even possible for TSLA to fall back to September-November 2020 levels ($400+/-50), but for now, I find that less likely and will stick to the standard 23.60-38.2% retrace for a 4th wave, just like I showed on the daily chart it has adhered to many times. Also, because in strong bull markets, and TSLA is clearly in one, upside surprises (like we experienced now) while downside disappoints.
Bottom line: Based on the EWP and technical analyses, I find TSLA to have currently less upside reward than downside risk for the intermediate-term (weeks-months), but still has long-term potential (months+).
