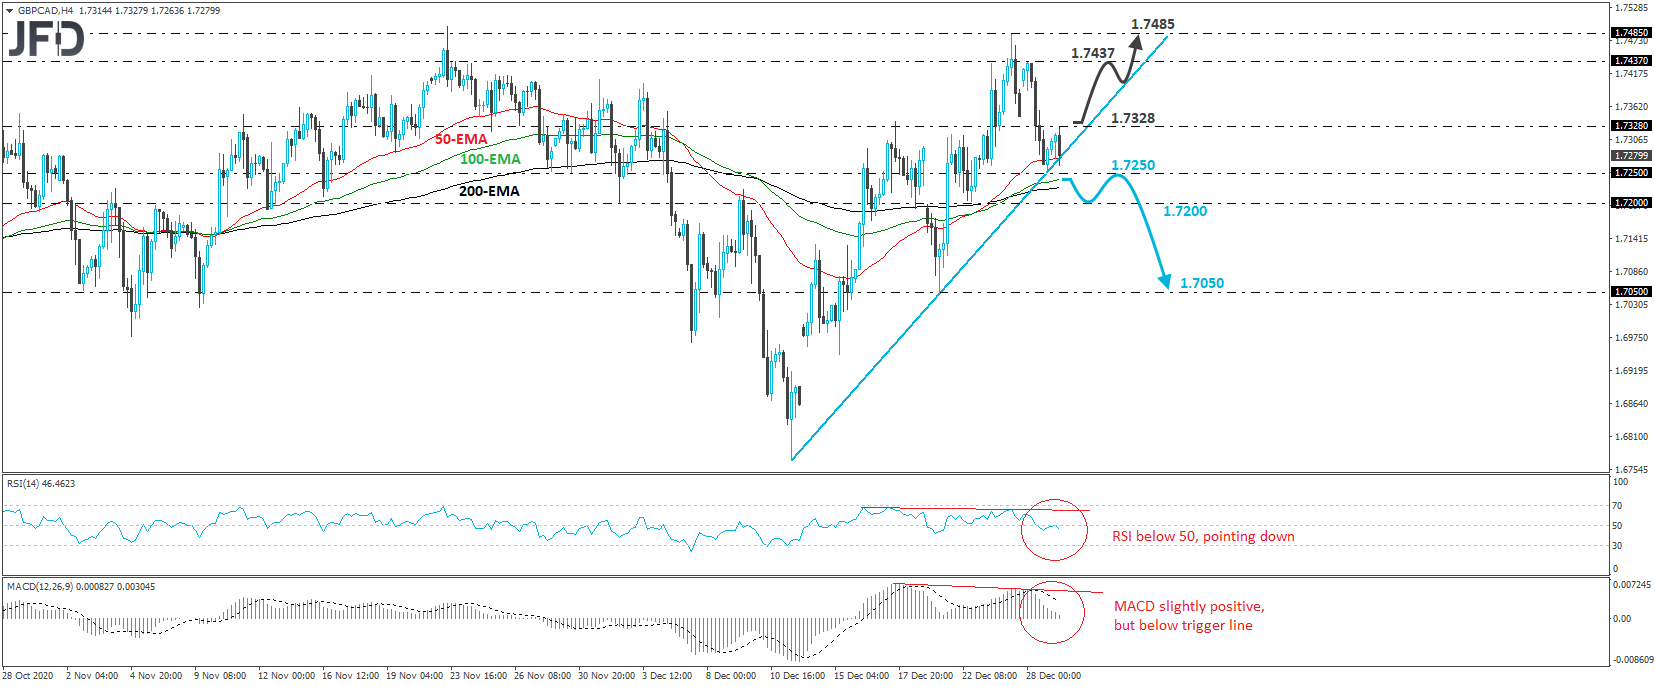
GBP/CAD tumbled on Monday, but hit support at the crossroads of the 1.7250 level and the upside support line drawn from the low of December 11th, and then, it rebounded. However, during the Asian trading today, the pair hit resistance at 1.7328 and pulled back. At the time of writing, it is testing the upside line again, where a break may signal a bearish reversal.
In our view, the break below the upside line would be confirmed upon a dip below yesterday’s low of 1.7250. This would also confirm a forthcoming lower low on the 4-hour chart and may initially pave the way towards the low of December 22nd, at 1.7200. If that zone is not able to halt the slide, then its break may carry larger bearish implications, perhaps setting the stage for the low of December 21st, at 1.7050.
Shifting attention to our short-term oscillators, we see that the RSI turned down after it tested its 50 level as a resistance, while the MACD, although fractionally positive, lies well below its trigger line and looks ready to enter negative waters. There is also negative divergence between both the indicators and the price action. All this suggests that the rate may start picking up downside momentum very soon, which increases the chances for a break below the aforementioned upside line.
In order to start examining the case of another positive wave, we would like to see a rebound back above 1.7328. This may signal that traders want to keep this pair above the upside line for a while longer, and may pull the trigger for the 1.7437 hurdle, marked by yesterday’s high. Another break, above 1.7437, may open the path towards the 1.7485 level, defined as a resistance by the peak of last Thursday.