Since the end of June, the natural gas futures market experienced a significant recovery. The price traded to a 25-year low at $1.432 in late June. Over the past sessions, the nearby NYMEX futures contract reached a peak of $2.465, over 72% higher in only three short months.
Warren Buffett’s purchase of Dominion Energy's (NYSE:D) transmission and pipeline assets for approximately $10 billion put a spotlight on the natural gas market and likely contributed to a shift in sentiment. While inventories remain at a high level compared with this time in 2019 and the five-year average, production has declined significantly. According to Baker Hughes, only 70 natural gas rigs were extracting the energy commodity from the crust of the earth in the United States on Aug. 14, compared with 165 in mid-August 2019. In commodity markets, the cure for low prices is often low prices, and natural gas at a quarter-of-a-century low was likely far too inexpensive. A value investor, Buffet, seized the opportunity to pick up a bargain in the natural gas market, and the price responded by moving more than 70% higher over the past weeks.
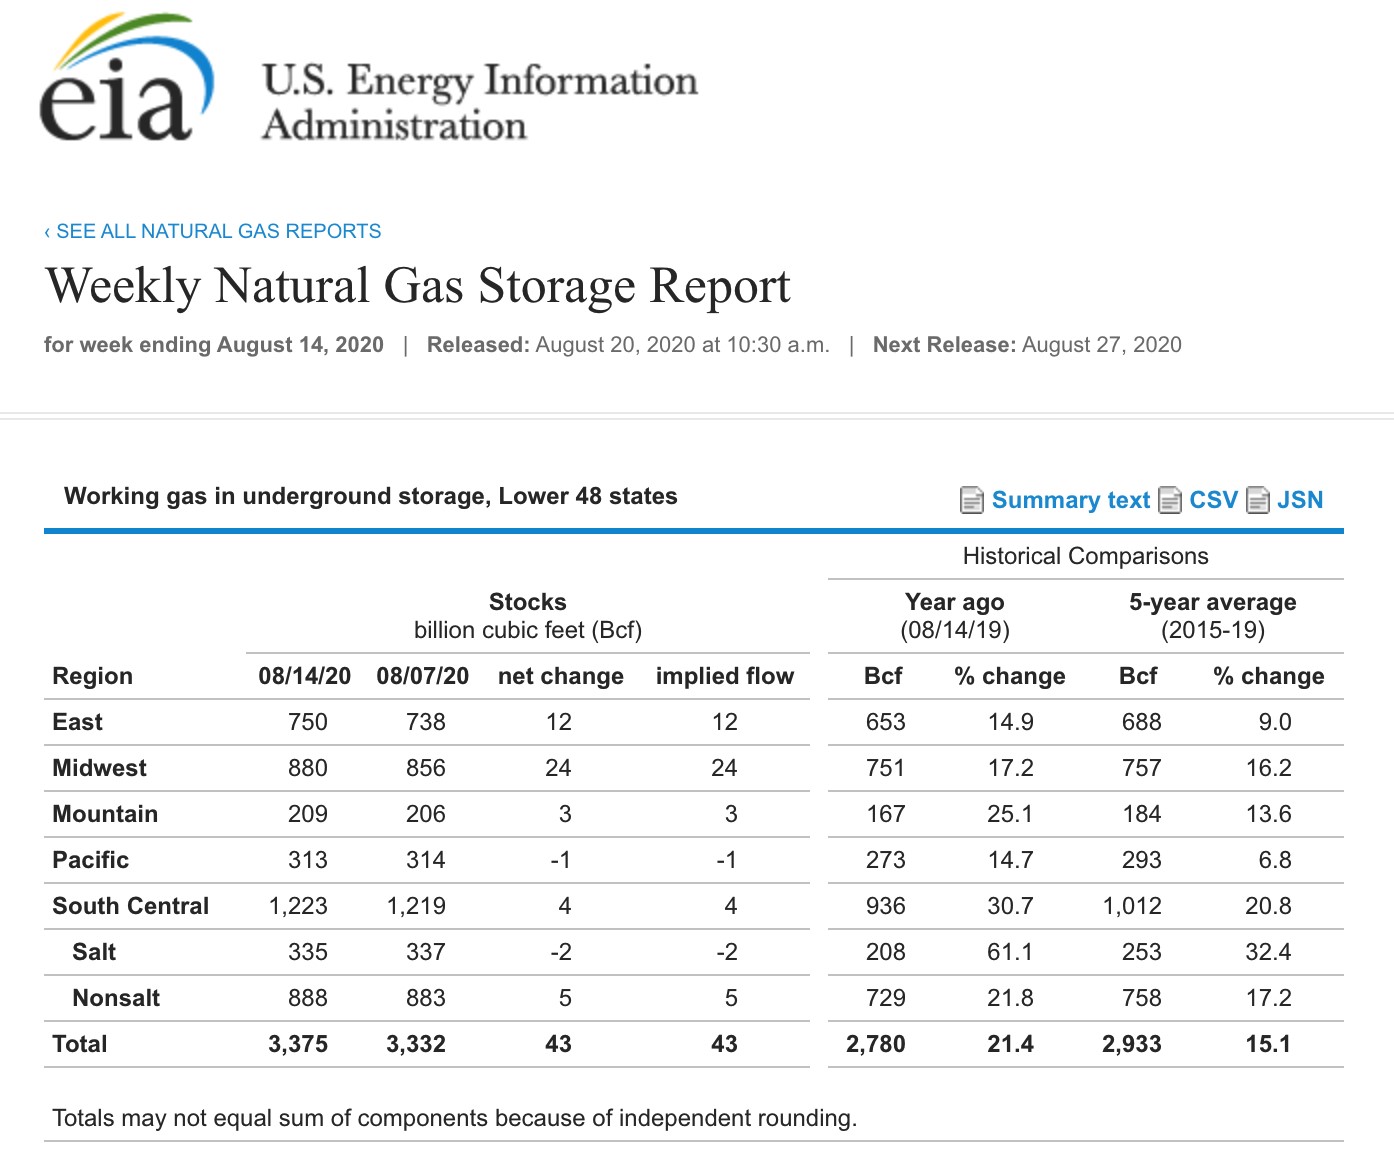
Today, the Energy Information Administration released its latest inventory data. The market had expected a 43-billion-cubic-feet injection into storage for the week ending on Aug. 14. The United States Natural Gas Fund (NYSE:UNG) moves higher and lower with the price of NYMEX natural gas futures. The BOIL (NYSE:BOIL) and KOLD (NYSE:KOLD) products provide double leverage on the up and downside in the volatile energy commodity.
Market Expected 45-bcf Injection
According to Estimize, a crowdsourcing website, the consensus estimates for the increase in natural gas inventories for the week ending on Aug. 14 was approximately 45 billion cubic feet.

(Source: EIA)
The chart shows that 43 billion cubic feet of natural gas flowed into storage at the end of last week. Total inventories stood at 3.375 trillion cubic feet, 21.4% above last year’s level, and 15.1% over the five-year average for the middle of August.
The latest data was the 20th consecutive week where the percentage compared to last year declined. In March, stockpiles of natural gas reached a level that was 79.5% above the level at the same time in 2019. The percentage differential declined steadily to the 21.4% level as of Aug. 14. With only 13 weeks to go before the start of the withdrawal season in November, stockpiles will need to build by only 27.5 bcf to surpass last year’s peak at 3.732 tcf. Reaching four trillion cubic feet of natural gas for the third time since the EIA began reporting data would require an average injection of 48.1 bcf. The level of stockpiles remains bearish for the natural gas market. However, production has declined with Baker Hughes reporting only 70 natural gas rigs operating as of Aug. 14 compared to 165 in mid-August 2019.
September Natural Gas Headed Towards Early May High
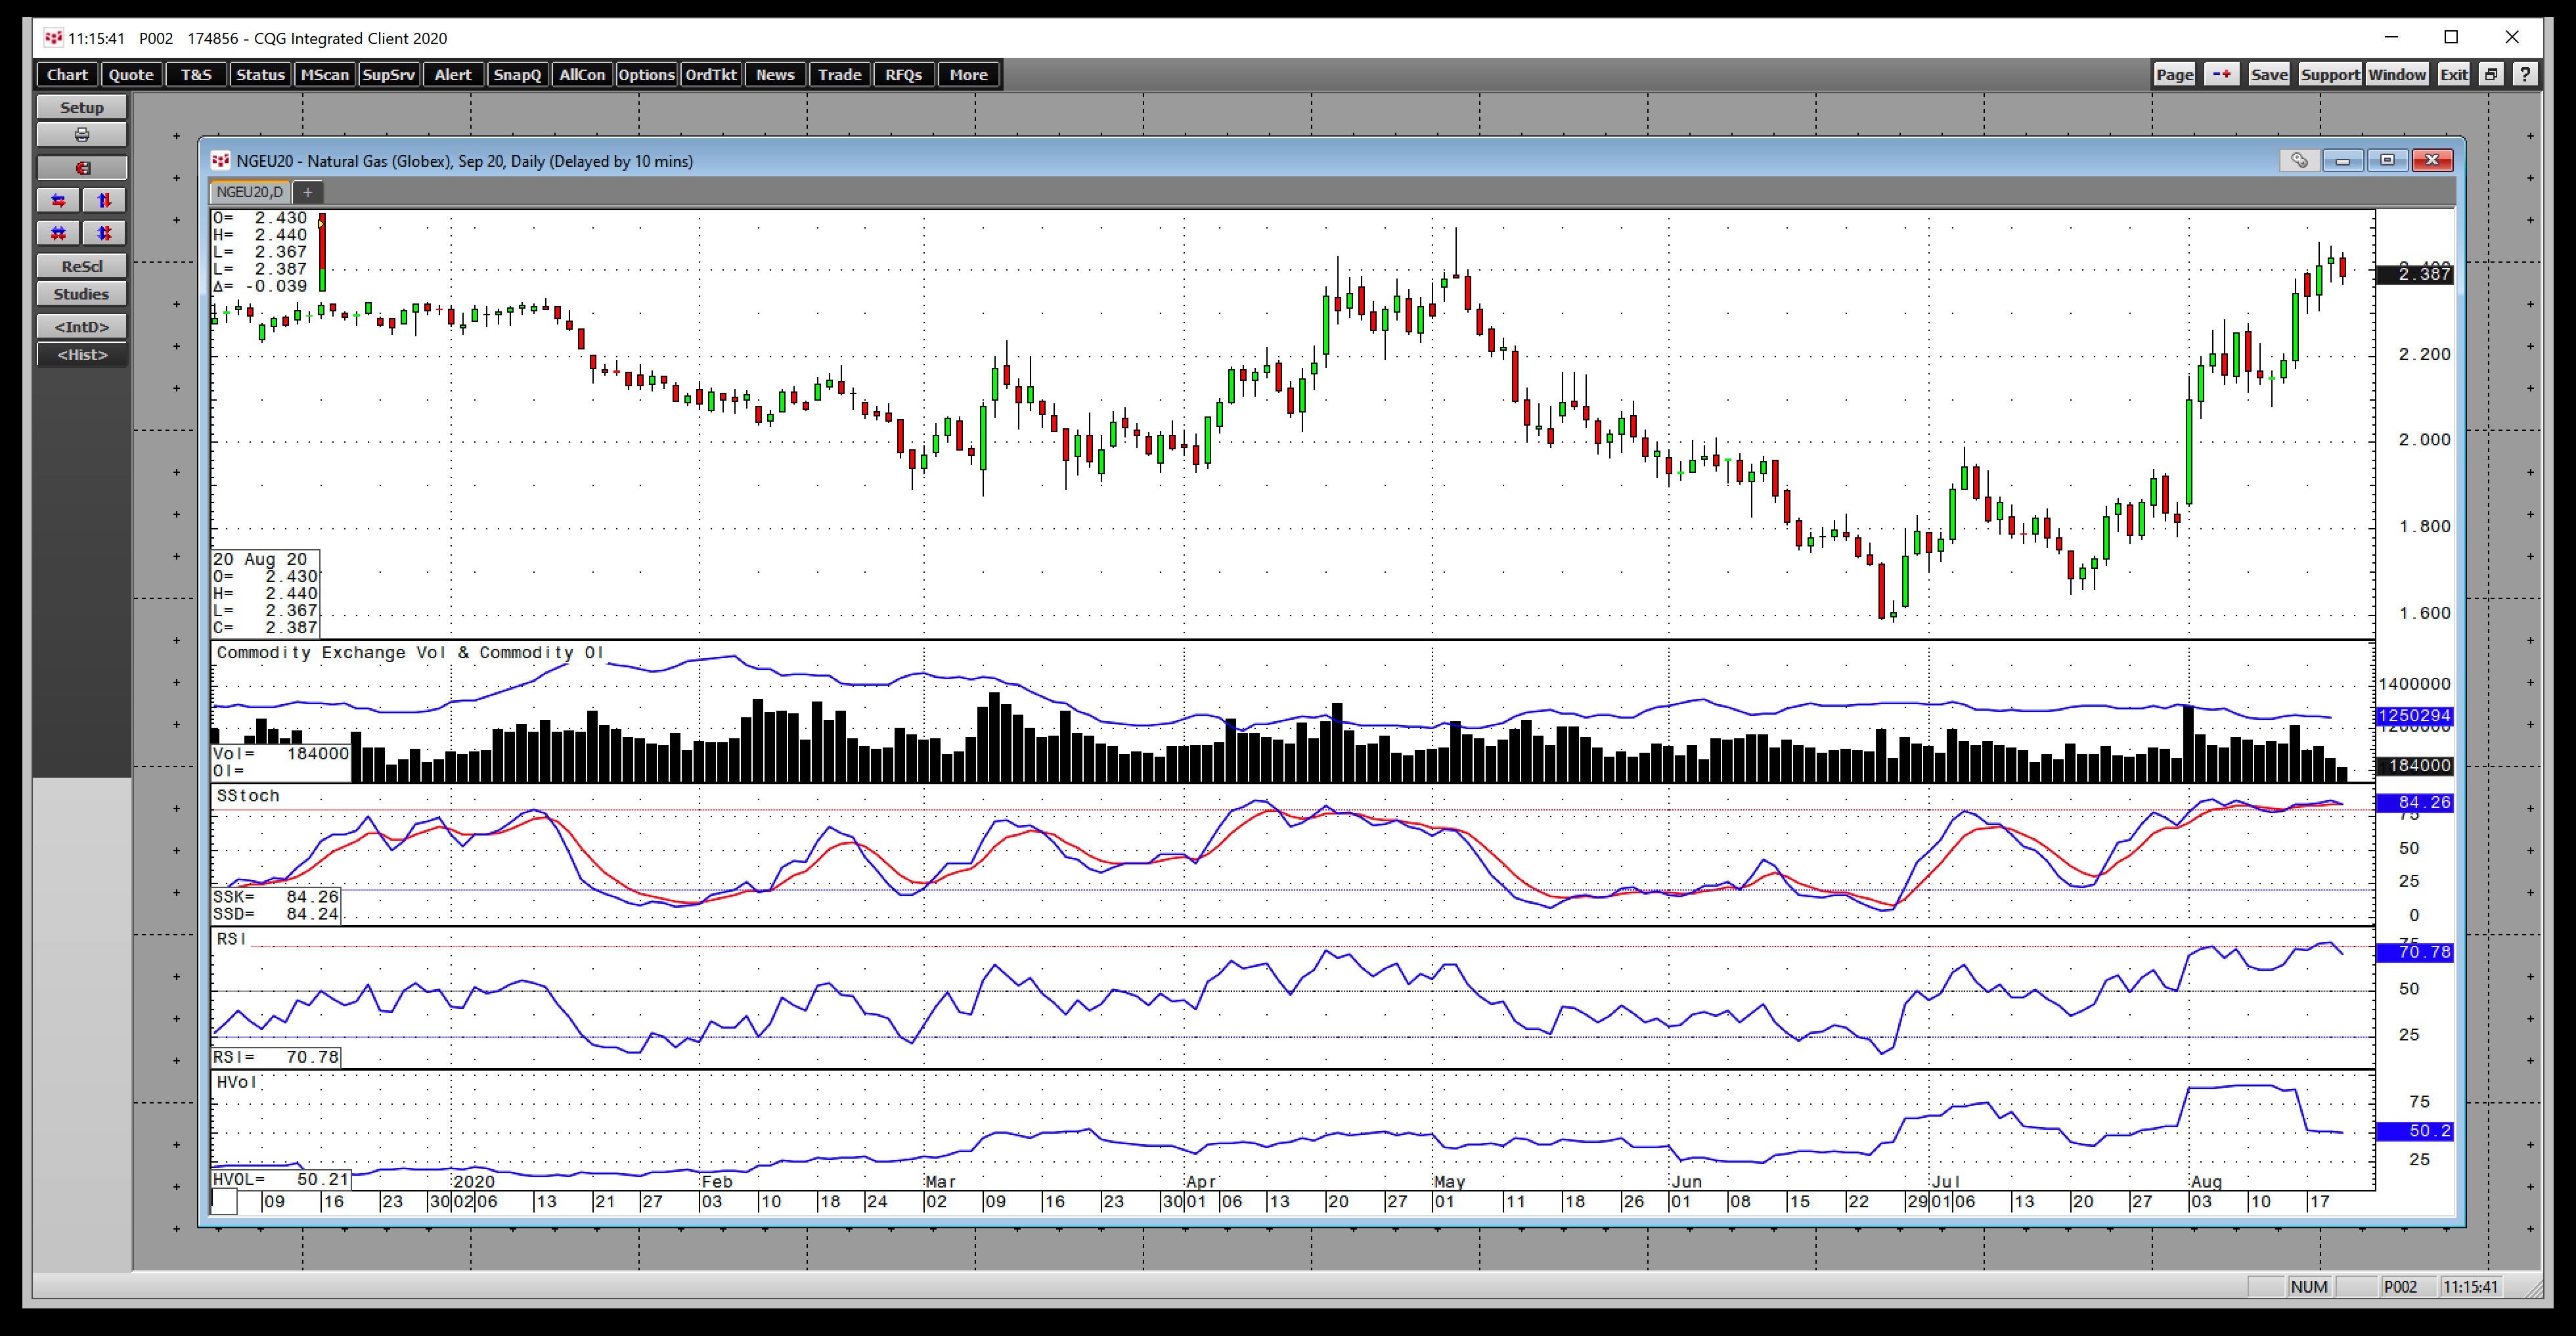
Over the past week, the price of nearby September futures reached $2.465 per MMBtu.

(Source: CQG)
As the daily chart highlights, the price fell short of the early May high at $2.499 per MMBtu. Price momentum and relative strength indicators were in overbought territory on Aug. 20. The total number of open long and short positions at 1.251 million contracts declined from 1.307 million at the end of July. Falling open interest and increasing price is not a technical validation of a bullish trend in a futures market. The decline in the open interest metric indicates that short covering was at least partially responsible for the recent rally. Daily historical volatility reached a high of over 90% earlier this month, but the metric declined to just over the 50% level on Aug. 20.
The high level of inventories is insurance that there is plenty of natural gas in storage to meet requirements during the 2020/2021 peak season for demand.
Is Another Correction On The Horizon?
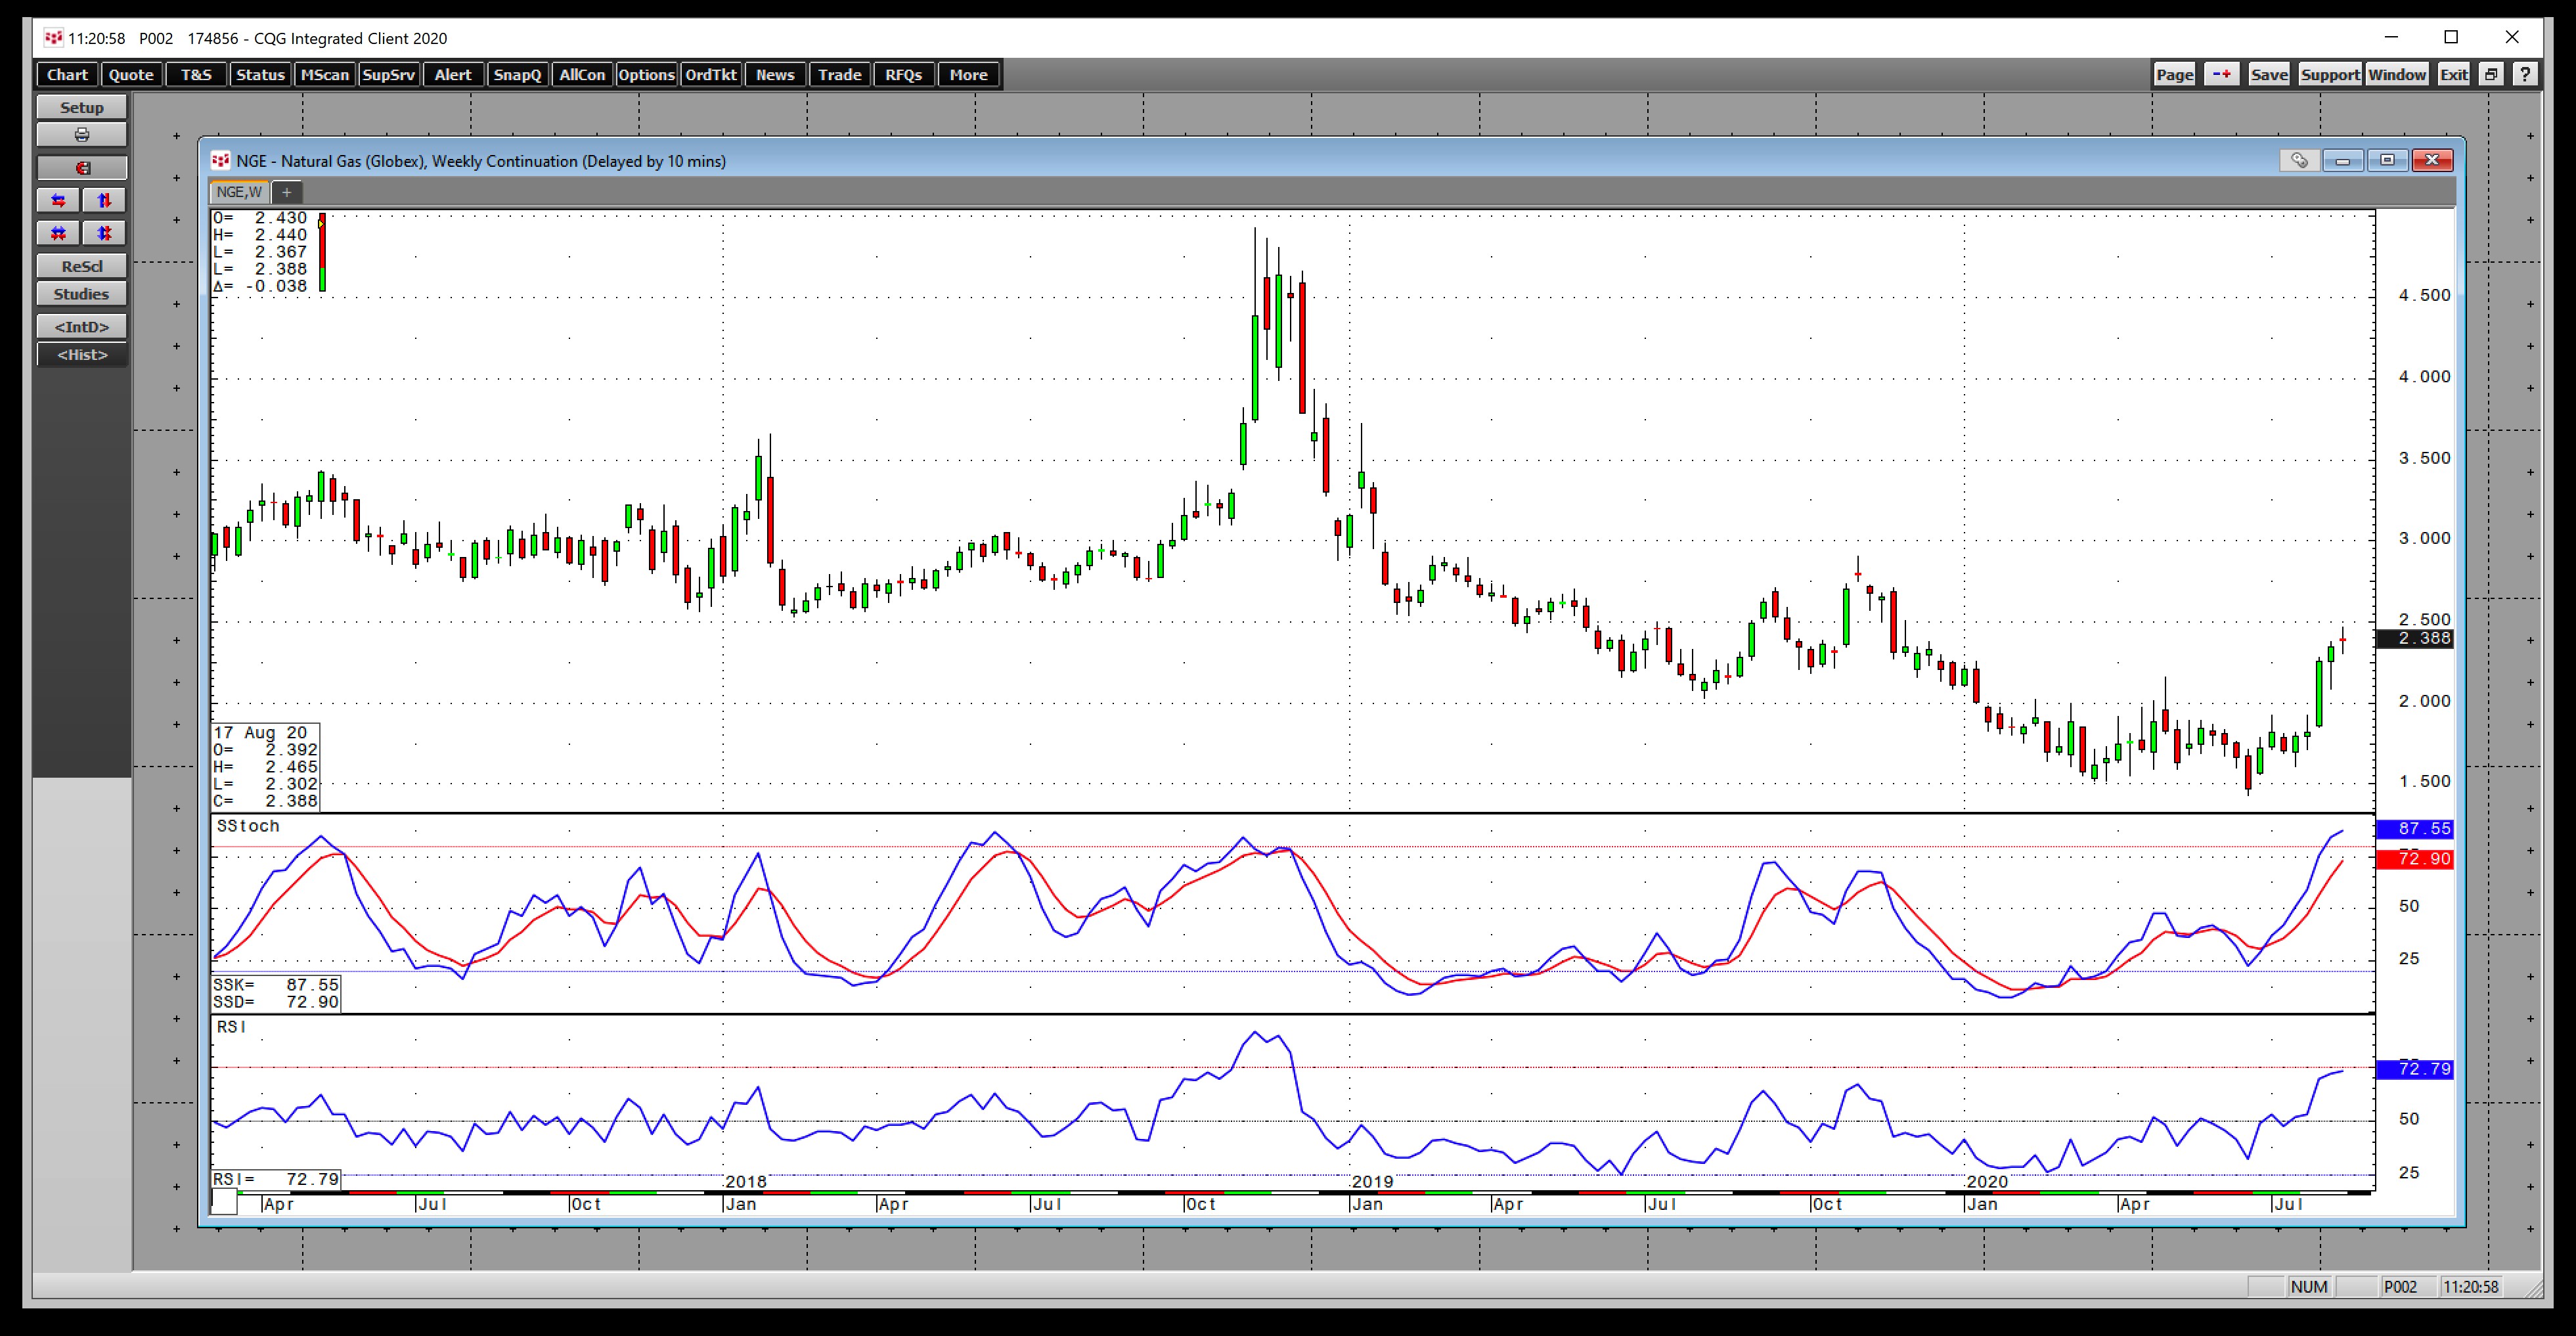
The weekly chart looks far more constructive that the daily chart.

(Source: CQG)
Price momentum and relative strength were rising on the weekly chart as of Aug. 20. The price broke out of the early May high at $2.162 per MMBtu, and the next level of technical resistance stands at the November 2019 high of $2.905 per MMBtu.
Natural gas traded at its highest level for 2020 over the past week. The odds of another correction are rising with the price of the energy commodity. Over the past weeks, I had written that my target on the upside was around the $2.10 level. Natural gas surpassed that level and rose to $2.465. However, I continue to believe that another move to the downside that tests the $2 level or lower could be on the horizon as we are still in the summer season. The beginning of the withdrawal season is still a little under three months away.
Natural gas is a highly volatile energy commodity. I will use a stop at just above the $2.50 level on any short position at the $2.39 level as risk-reward is at better than 3:1.
The latest injection data was not bearish for the natural gas market, but inventories could weigh on the price over the coming weeks.
