Visually the difference can be subtle, but the implications of what aspect is at play are worlds apart and a good reason to try to determine whether the equity indices are trading in bullish Ascending Trend Channels or bearish Rising Wedges. In the former scenario, buyers overwhelm sellers until a point of exhaustion or consolidation is reached as demonstrated by the uptrend behind the Ascending Trend Channel while the latter scenario shows a picture of sellers who are increasingly eager to sell to fewer buyers and something that ultimately causes the slowing buying momentum to collapse.
Relative to the Nasdaq Composite, Russell 2000, Dow Jones Industrial Average and S&P today, this distinction may be an extension of Saturday’s discussion around the lower near- and intermediate-term highs in the former two indices and the higher near-term highs in the later two indices within the context of lower intermediate-term highs with the Rising Wedge popping out in the bearish charts the most. Rather than turning this into a charting bonanza, though, let’s just look at one from the lower near-term highs camp and one from the higher near-term high camps on a daily basis.
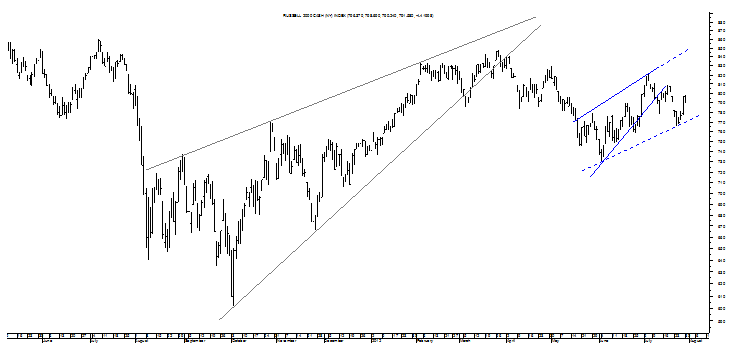
Starting out with the chart that shows the truest set of lower near-term highs and something that would seem to suggest declining buying appetite in the face of the increasing desire to sell that is shown by the Rising Wedge, it is the Russell 2000’s Rising Wedge that is the easiest to spot but the most challenging to mark well while its encasing Channel is of a broadening nature when marked on the true trendline of the near-term uptrend.

When the Channel above is marked by using a regression line in the middle, it can be turned into an Ascending Trend Channel by leaving out the Russell 2000’s last highs and something that does not make a lot of sense to me and particularly in trying to solve the question of whether the Russell 2000 is showing even buying and selling with more interest from the buyers or slowing buying momentum with sellers getting ready to panic. In my mind, it is the latter scenario taking hold of the Russell 2000 currently and this without being biased by the real Rising Wedge in the chart above and one that is confirmed for a more than 20% decline in this small cap index in the months ahead.
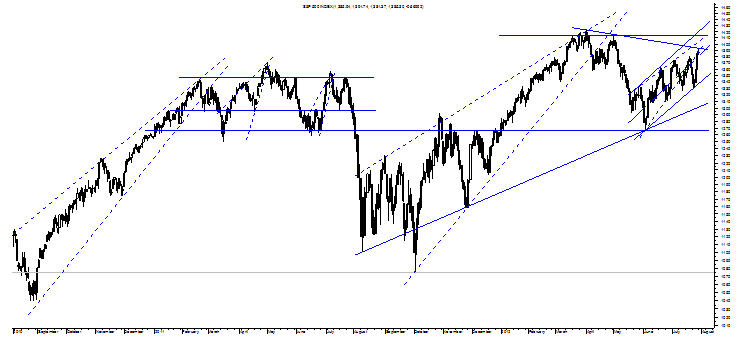
Let’s now turn to a chart that is way too busy but with markings that are too interesting – to me– to leave out and that is the oh-so-sideways chart of the S&P.

It strongly suggests that the index may not just fall to small Rising Wedge encased in what does not appear to be an Ascending Trend Channel when drawn to the S&P’s near-term uptrend but to the bottom of that large Symmetrical Triangle near 1300 and perhaps even to the 1075 target of the multi-month Rising Wedge. Put otherwise, unless the S&P quickly pops up to the true top trendline of that unlikely Ascending Trend Channel at about 1430, it is trading in a Rising Wedge that represents slowing buying momentum in the face of increasing selling interest and a dynamic that should cause it to fulfill quickly and take the S&P toward its target of 1267.
Whether this pattern will drop down on disappointment over ISM, the Fed, the ECB, nonfarm payrolls or some combination is unclear, but it has been building for long enough now to think that its time to fulfill should be soon with confirmation starting at 1359 followed by safe confirmation at 1329.
Let’s just look at one last chart, though, to see how it may weigh in on this debate of the Ascending Trend Channel versus the Rising Wedge around the equity indices over the last two months and this takes us to the weekly chart of the Dow Jones Industrial Average on the following page.
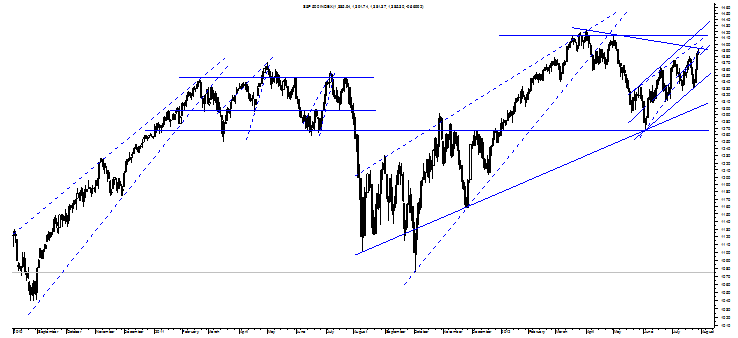
It is my view that this chart shows beautifully the main technical aspect of all of these charts and that is the fulfilling Rising Wedge born of the Operation Twist and LTRO rally with sellers getting antsy to get out in April as payrolls and ISM started to weaken in the face of buyers who liked the magic of LTRO I but were a little less impressed by LTRO II and perhaps wanting to see how the springtime fundamentals would fill in. Well, clearly, those fundamentals having been falling into place poorly with several months of big non-farm payroll declines, recessionary ISM manufacturing data, sharply slowing GDP growth in the US on a quarter-over-quarter basis, no progress in Europe, slowing global growth with the world’s central banks validating this grim picture by lowering rates, increasing QE and promising to do “whatever it takes” to keep the system afloat.
Is that scenario, and one that is not exaggerated at all, a buy or a sell? The answer to that question is also the answer around the Ascending Trend Channel or Rising Wedge question as shown, once again, below.

There is the off-chance of the current Rising Wedge putting in yet a higher peak but the 3% rule that has held very well so far says it will not with the multi-month Rising Wedge that is clearly confirmed supporting that assessment. Should the Dow rise above this year’s current peak, however, it will support a much larger Rising Wedge that will put in an apex near 2007’s highs before buyers disappears and sellers panic to confirm a pattern that carries a target of 2009’s low at 6470.
Put otherwise, when all of the uncertainties plaguing investors are resolved whether this year, 2013 or 2014, it will confirm that it is wise to determine whether there’s a Channel or a Wedge at play.
Relative to the Nasdaq Composite, Russell 2000, Dow Jones Industrial Average and S&P today, this distinction may be an extension of Saturday’s discussion around the lower near- and intermediate-term highs in the former two indices and the higher near-term highs in the later two indices within the context of lower intermediate-term highs with the Rising Wedge popping out in the bearish charts the most. Rather than turning this into a charting bonanza, though, let’s just look at one from the lower near-term highs camp and one from the higher near-term high camps on a daily basis.
Starting out with the chart that shows the truest set of lower near-term highs and something that would seem to suggest declining buying appetite in the face of the increasing desire to sell that is shown by the Rising Wedge, it is the Russell 2000’s Rising Wedge that is the easiest to spot but the most challenging to mark well while its encasing Channel is of a broadening nature when marked on the true trendline of the near-term uptrend.

When the Channel above is marked by using a regression line in the middle, it can be turned into an Ascending Trend Channel by leaving out the Russell 2000’s last highs and something that does not make a lot of sense to me and particularly in trying to solve the question of whether the Russell 2000 is showing even buying and selling with more interest from the buyers or slowing buying momentum with sellers getting ready to panic. In my mind, it is the latter scenario taking hold of the Russell 2000 currently and this without being biased by the real Rising Wedge in the chart above and one that is confirmed for a more than 20% decline in this small cap index in the months ahead.
Let’s now turn to a chart that is way too busy but with markings that are too interesting – to me– to leave out and that is the oh-so-sideways chart of the S&P.

It strongly suggests that the index may not just fall to small Rising Wedge encased in what does not appear to be an Ascending Trend Channel when drawn to the S&P’s near-term uptrend but to the bottom of that large Symmetrical Triangle near 1300 and perhaps even to the 1075 target of the multi-month Rising Wedge. Put otherwise, unless the S&P quickly pops up to the true top trendline of that unlikely Ascending Trend Channel at about 1430, it is trading in a Rising Wedge that represents slowing buying momentum in the face of increasing selling interest and a dynamic that should cause it to fulfill quickly and take the S&P toward its target of 1267.
Whether this pattern will drop down on disappointment over ISM, the Fed, the ECB, nonfarm payrolls or some combination is unclear, but it has been building for long enough now to think that its time to fulfill should be soon with confirmation starting at 1359 followed by safe confirmation at 1329.
Let’s just look at one last chart, though, to see how it may weigh in on this debate of the Ascending Trend Channel versus the Rising Wedge around the equity indices over the last two months and this takes us to the weekly chart of the Dow Jones Industrial Average on the following page.
It is my view that this chart shows beautifully the main technical aspect of all of these charts and that is the fulfilling Rising Wedge born of the Operation Twist and LTRO rally with sellers getting antsy to get out in April as payrolls and ISM started to weaken in the face of buyers who liked the magic of LTRO I but were a little less impressed by LTRO II and perhaps wanting to see how the springtime fundamentals would fill in. Well, clearly, those fundamentals having been falling into place poorly with several months of big non-farm payroll declines, recessionary ISM manufacturing data, sharply slowing GDP growth in the US on a quarter-over-quarter basis, no progress in Europe, slowing global growth with the world’s central banks validating this grim picture by lowering rates, increasing QE and promising to do “whatever it takes” to keep the system afloat.
Is that scenario, and one that is not exaggerated at all, a buy or a sell? The answer to that question is also the answer around the Ascending Trend Channel or Rising Wedge question as shown, once again, below.

There is the off-chance of the current Rising Wedge putting in yet a higher peak but the 3% rule that has held very well so far says it will not with the multi-month Rising Wedge that is clearly confirmed supporting that assessment. Should the Dow rise above this year’s current peak, however, it will support a much larger Rising Wedge that will put in an apex near 2007’s highs before buyers disappears and sellers panic to confirm a pattern that carries a target of 2009’s low at 6470.
Put otherwise, when all of the uncertainties plaguing investors are resolved whether this year, 2013 or 2014, it will confirm that it is wise to determine whether there’s a Channel or a Wedge at play.
