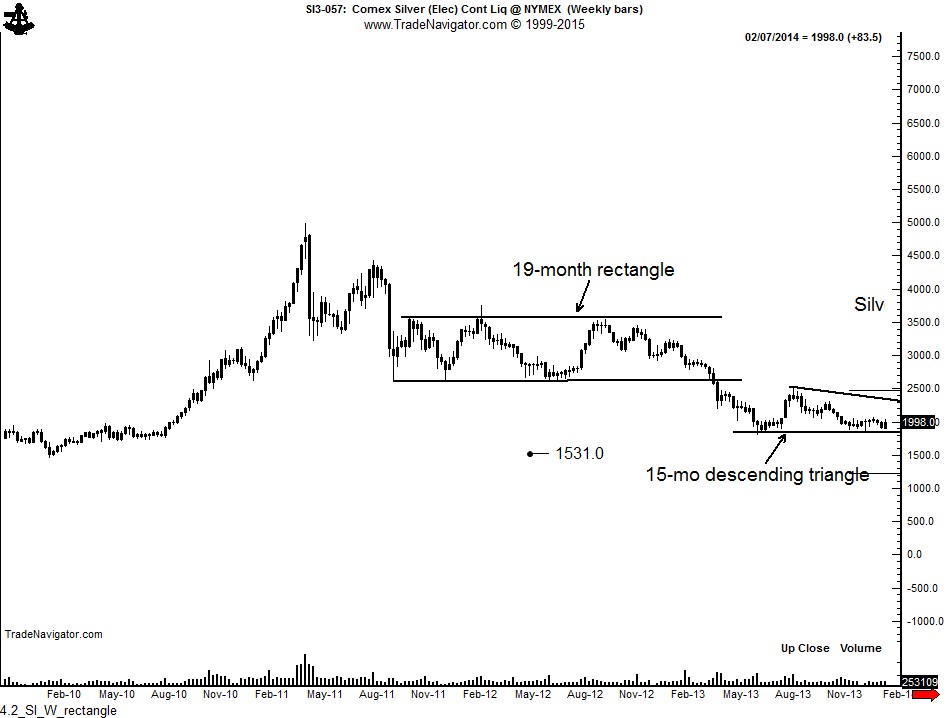
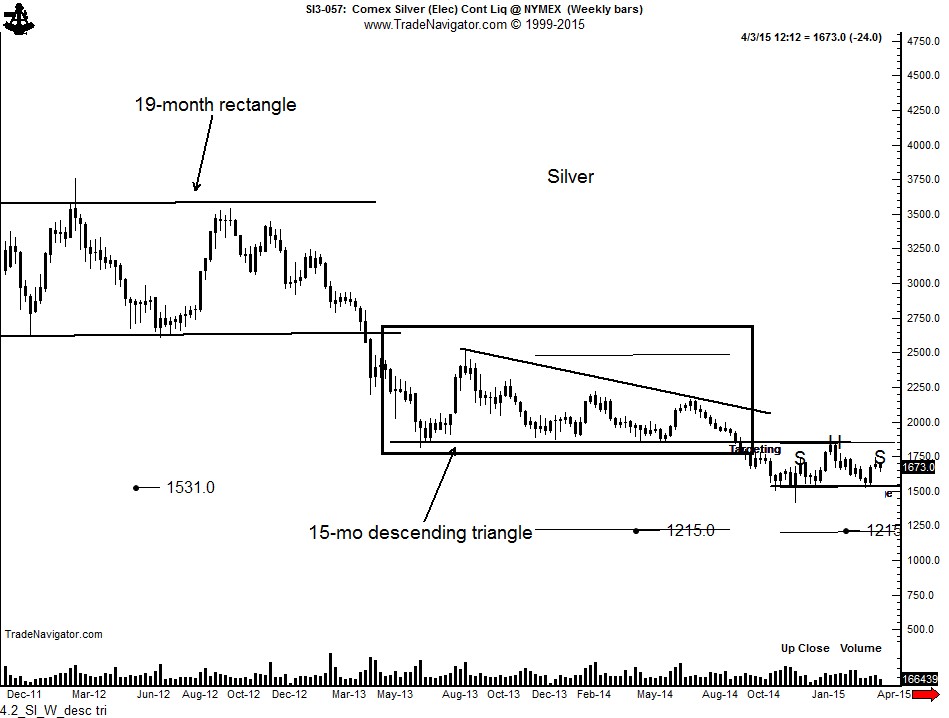
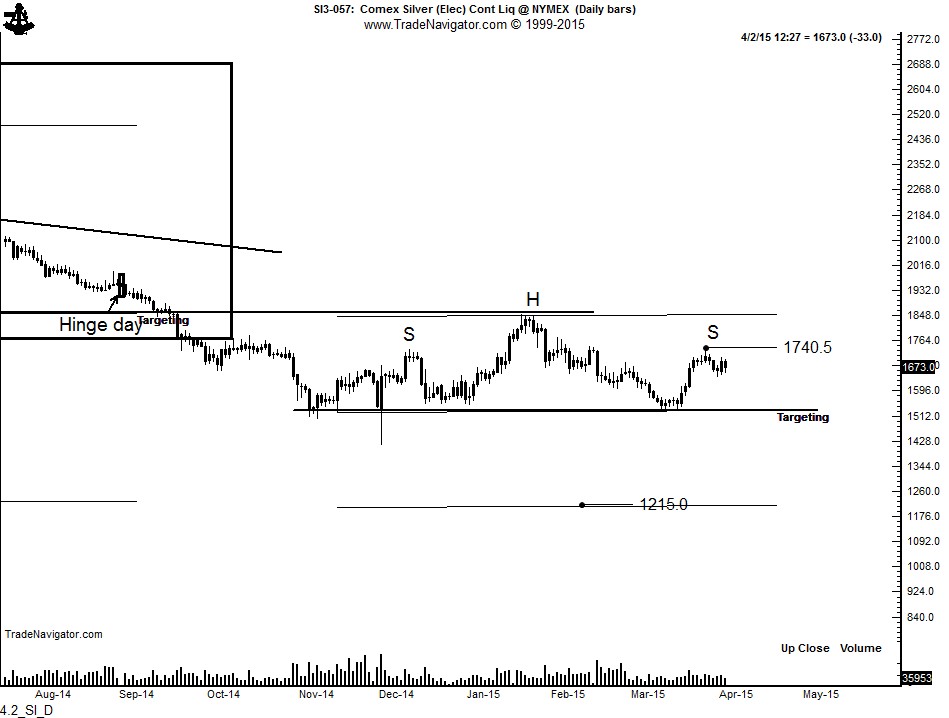
Several observations are worth of note on the silver charts.
The 19-month rectangle completed in Apr. 2012 provided a profit target of 15.30, reached in Nov 2014, as shown on the weekly graph below.
The 15-month weekly chart descending triangle completed in Sept. 2014 -- and retested in Jan. 2015 -- produced a possible profit target of 12.15. I have privately and publicly wondered if this target was too low and unattainable. After all, 12.15 would represent a price decline of 76% from the Apr. 2011 bull market high. Keep in mind that chart targets are not sacred, but can provide some indication of what might be possible.
A new development has taken place in silver. The daily chart now exhibits a possible 5-month continuation H&S pattern. This pattern is in the right shoulder at the present time. This daily chart pattern still has much work to accomplish. First, the present right-shoulder high in the 17.40 to 17.50 zone must contain the current advance. Second, prices need to roll over and begin trending toward the neckline at 15.30. Finally, a decisive close below the neckline is required to declare the 12.15 target as an increasing possibility.


