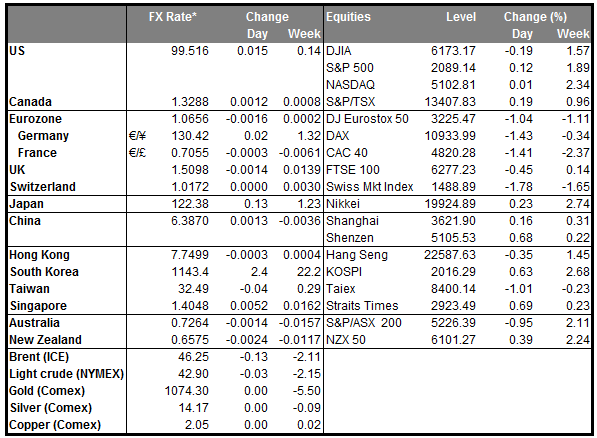
• The oil glut continues Oil currencies continue taking a hit as oil prices decline further. Brent crude oil sank to its lowest level since 2004, while WTI stands just above its 2009 lows. On the supply side, with the US and Russia expanding their production, as well as Iranian oil ready to enter the market when sanctions are lifted in 2016, there are few signs that the downward trend will change anytime soon. Additionally, shale oil production in the US has not been as hurt as expected, but rather many producers have exploited more efficient technologies to survive the plunge in prices. On top of that, Washington lift the ban on oil exports established during the US oil shortages in the 1970s, which raised further concerns over the global supply. Meanwhile, the economic slowdown in EM and particularly in China, has kept the global demand subdued. In a relatively thin market, the recent tumble in oil prices continues to weigh on oil currencies like CAD and NOK, which print new more-than-a-decade lows against the dollar. On the other hand, the low oil prices could increase the disposable income of consumers, which policymakers hope may translate to upward pressure on inflation, through increased spending.
• Today’s highlights: In Sweden, retail sales for November are forecast to have accelerated slightly from the previous month. Sweden’s central bank recently stated that continued high levels of demand are needed in order to support more domestically-generated inflation. As such, the rise in retail sales could support their view and put upward pressure on prices. If the forecast is met we could see USD/SEK heading lower.
• From the US, the final estimate of Q3 GDP is expected to show that the US economy expanded at a 1.9% qoq SAAR, down from the 2nd estimate of 2.1% qoq SAAR. Even though this is the final estimate and usually not a major market mover, following the Fed’s first rate hike in almost a decade it could undermine the Fed’s view that the US economic activity is expanding, albeit at a moderate pace. Despite this data being outdated, the possible slowdown could hurt the improving outlook and along with a thin market, could reverse some of the dollar’s recent gains. The 3rd estimate of the core personal consumption index for Q3, the Fed’s favourite inflation measure, is forecast to have remained unchanged. A possible surprise in the figure could affect the pace of future rate hikes, which Fed officials have stressed will be ‘gradual’. The existing home sales for November are expected to have increased, but only marginally.
• We have no speakers on Tuesday’s agenda.
The Market
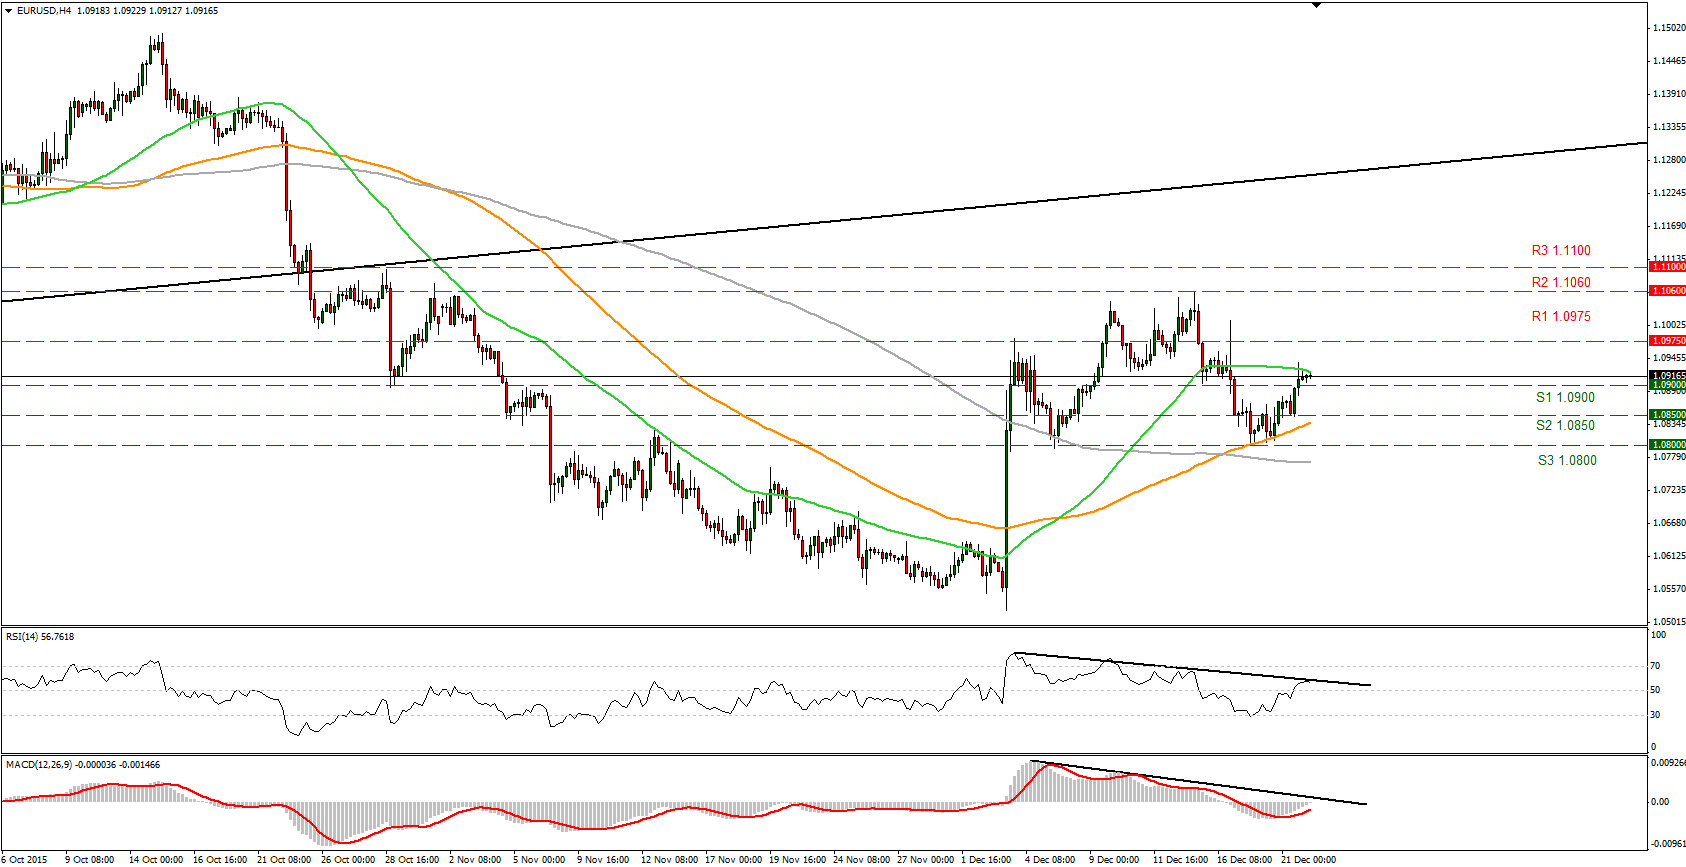
EUR/USD breaks above 1.0900
• EUR/USD broke above the resistance-turned-into-support zone of 1.0900 (R1) to find resistance at the 50-period moving average, which seems to provide good resistance to the highs of the price action. The break above 1.0900 (S1) has shifted the near-term bias to the upside and if the bulls prove strong enough they could push the rate higher, perhaps towards our 1.1060 (R1) resistance line. Looking at our short-term oscillators, the RSI found resistance at the black downtrend line just above 50, while the MACD, although above its trigger line, it shows signs of topping near zero. These momentum signs support the case for a minor pullback before the next leg higher. However, the market liquidity is likely to remain thin during the holiday season, as a result prices can move sharply on not very much at all. As for the broader trend, given the inability of the pair to break the 1.0800 (S3) barrier, the lower bound of the range it had been trading from the last days of April until the 6th of November, I would maintain my neutral stance.
• Support: 1.0900 (S1), 1.0850 (S2), 1.0800 (S3)
• Resistance: 1.0975 (R1), 1.1060 (R2), 1.1100 (R3)
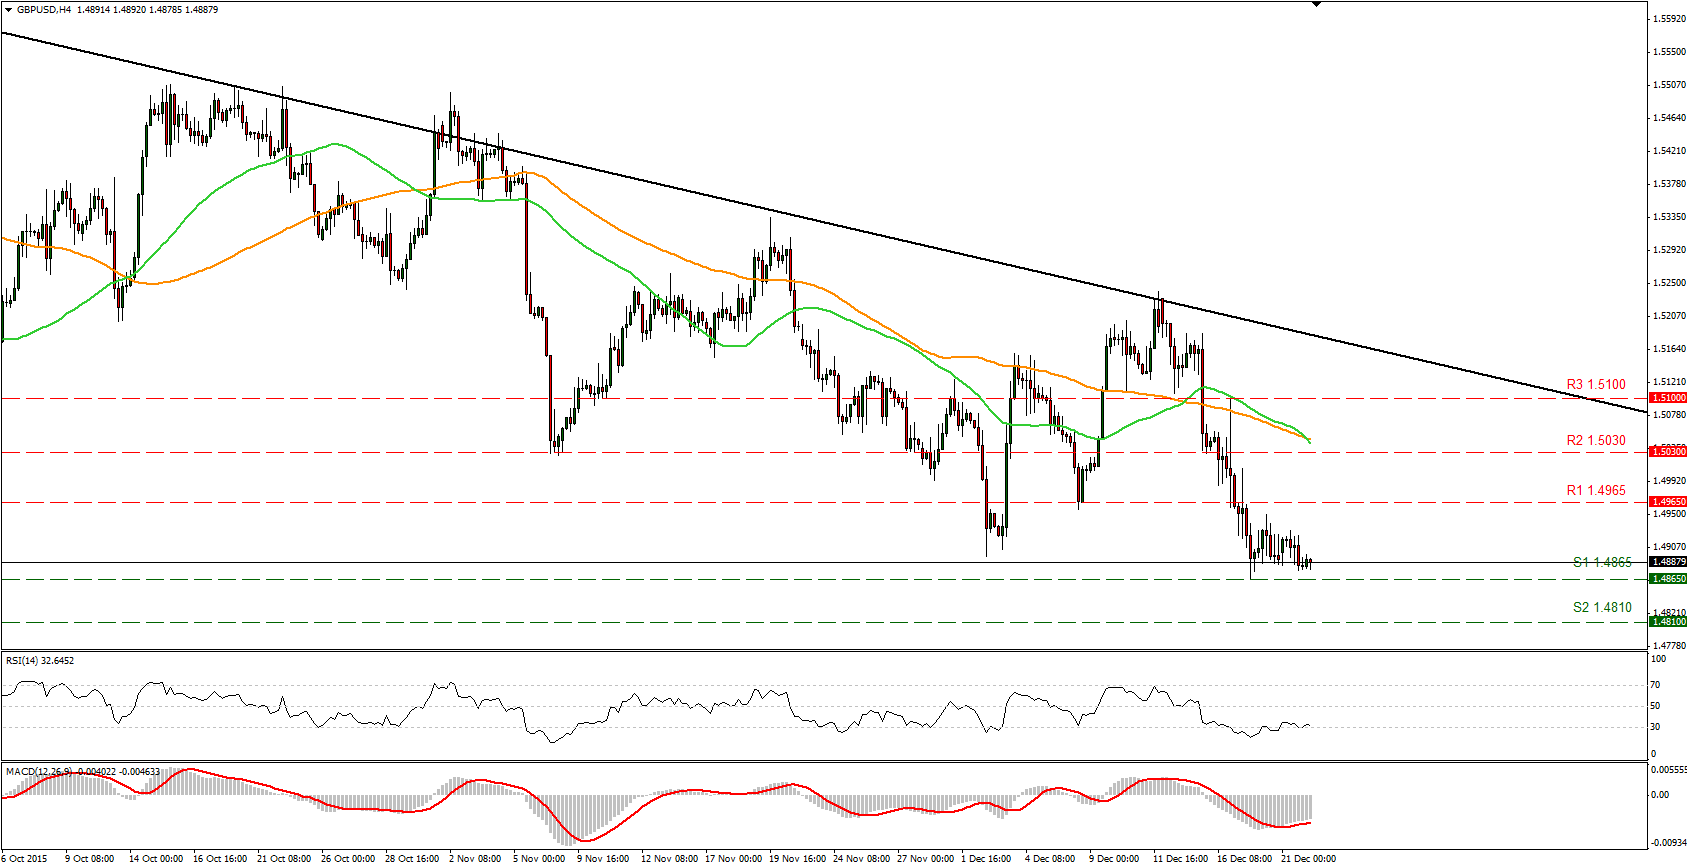
GBP/USD continue to gyrate around 1.4900
• GBP/USD consolidated on Monday, staying slightly above our 1.4865 (S1) support area. A break below that support zone could push the rate lower, perhaps for a test of our next support at 1.4810 (S2). However, our short-term momentum signs point to a correction before the next leg lower. The RSI moved above its 30 line again and is pointing up, while the MACD, crossed above its trigger line and shows signs it could move higher. As for the broader trend, the dip below 1.4900 signaled a lower low on the daily chart, which keeps the long-term bias to the downside, in my view.
• Support: 1.4865 (S1), 1.4810 (S2), 1.4710 (S3)
• Resistance: 1.4965 (R1), 1.5030 (R2), 1.5100 (R3)
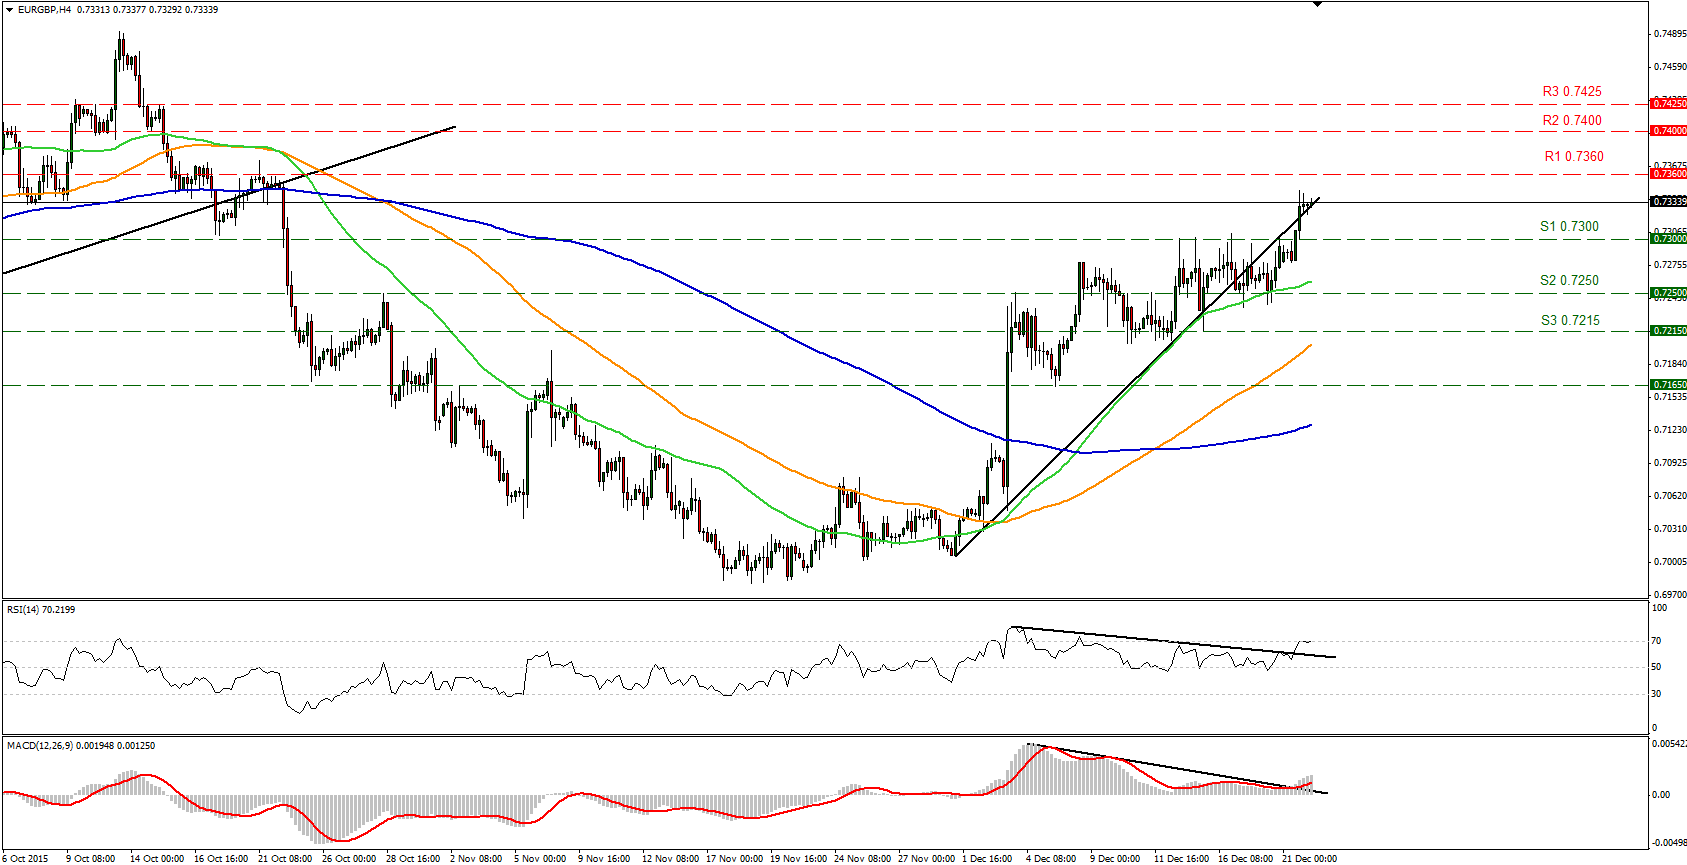
EUR/GBP breaks above 0.7300
• EUR/GBP broke through the key resistance (now turned into support) area of 0.7300 (S1) on Monday and remained elevated overnight, suggesting that a test of our next resistance level at 0.7360 (R1) is on the horizon. The price structure on the 4-hour chart suggest an uptrend and we see scope for further extension. Looking at our short-term momentum signs, the RSI broke above the black downtrend line to hit resistance at its 70 line, and is currently pointing sideways. The MACD, also above the black resistance line, moved above its trigger line but shows signs of topping. These momentum signs point to a minor pullback, perhaps for a test of the 0.7300 (S1) area as a support this time, before the next wave higher. Switching to the daily chart, I see that the rate has been trading within a wide sideways range between the 0.6980 support area and the resistance zone of 0.7485. As a result, although I see a near-term uptrend, I would like to hold a “wait and see” stance as far as the overall outlook of this pair is concerned.
• Support: 0.7300 (S1), 0.7250 (S2), 0.7215 (S3)
• Resistance: 0.7360 (R1), 0.7400 (R2), 0.7425 (R3)
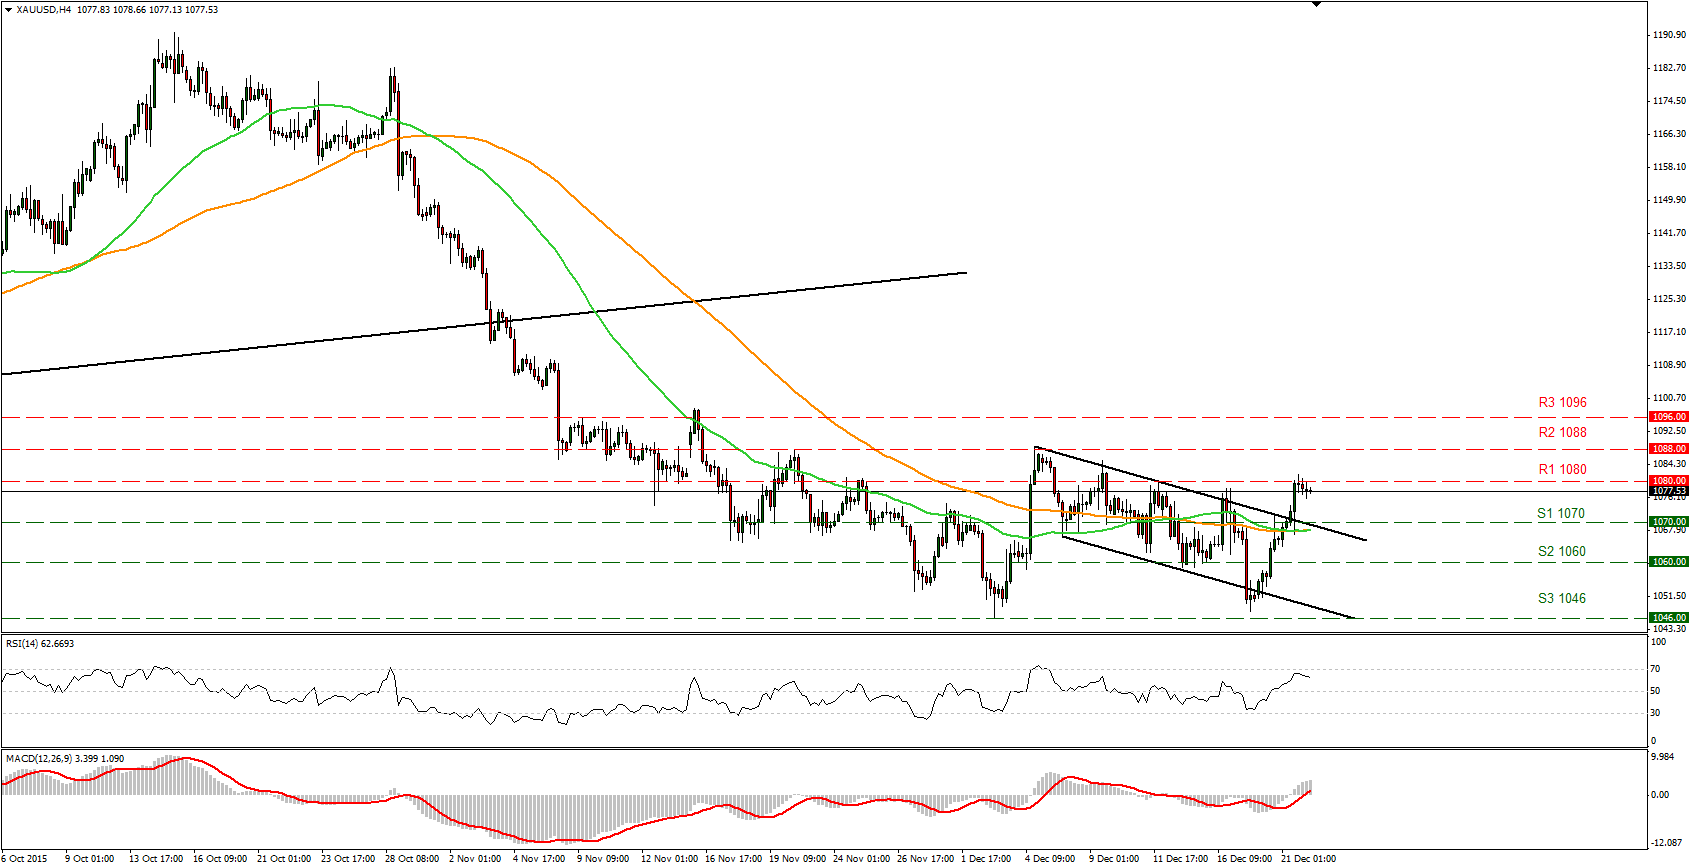
Gold breaks the upper boundary of the channel
• Gold surged on Monday and broke above the downside channel it has been trading since the 4th of December. The precious metal overcame the upper boundary of the downside channel and our 1070 (S1) resistance-turned-into-support zone to hit resistance at our next level at 1080 (R1). A break above that zone, could carry larger bullish implications and aim for our next resistance of 1088 (R2). Looking at our short-term momentum signs, the RSI found resistance at its 70 level and points down, while the MACD, already above its zero and trigger lines shows signs that it could top. These momentum signs point to a pullback before the bulls take control again. As for the broader trend, a break above 1088 (R2) resistance line is needed to print a higher high on the daily chart and shift the medium-term outlook to the upside. As a result, I would prefer to wait for a break above the aforementioned level to trust further advances.
• Support: 1070 (S1), 1060 (S2), 1046 (S3)
• Resistance: 1080 (R1), 1088 (R2), 1096 (R3)
WTI finds support at the 34.00 level
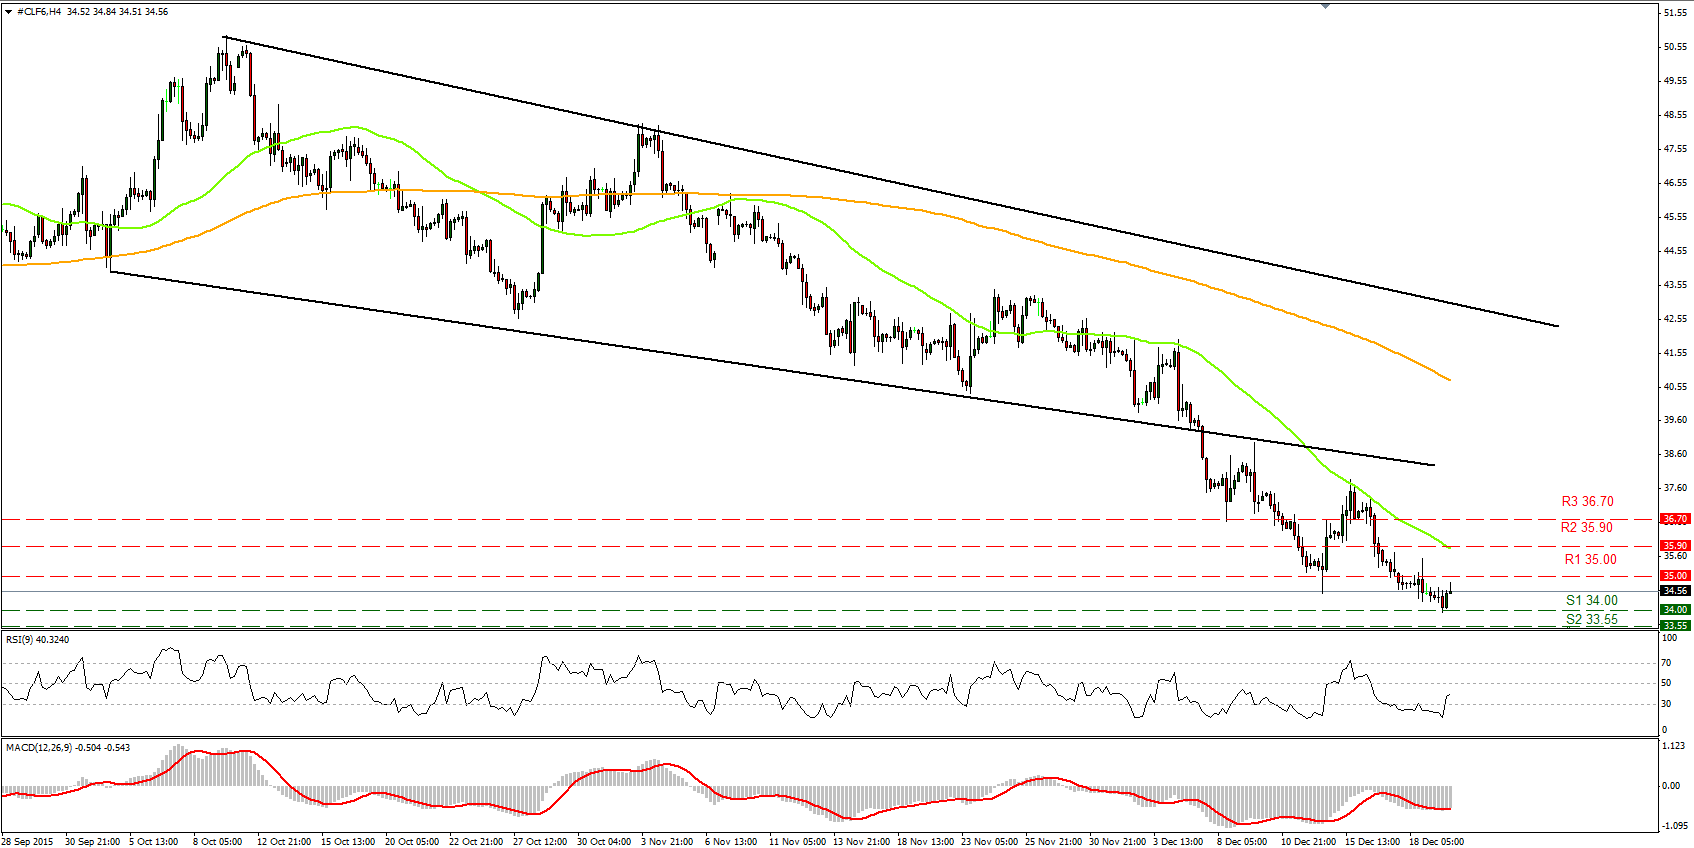
• WTI moved slightly lower on Monday but stayed within the psychological 35.00 (R1) resistance level and the 34.00 (S1) support zone. A clear break below 34.00 (S1) is needed to trust further declines. I would expect a clear move below that hurdle to challenge the key support zone of 33.55 (S2), last seen in February 2009. Taking a look at our oscillators though, I see the RSI found support just below its 30 line and jumped above it, while the MACD, although in its negative territory, has crossed above its trigger line. These momentum signs support my view to wait for a clear break below 34.00 (S1) to trust another leg lower. On the daily chart, I see that WTI has been printing lower peaks and lower troughs since the 9th of October. What is more, on the 7th of December, the price fell below the lower bound of a downside channel, something that reveals accelerating downside speed and increases the possibilities for further declines and a test of the key zone of 33.55 (S2).
• Support: 34.00 (S1), 33.55 (S2), 33.00 (S3)
• Resistance: 35.00 (R1), 35.90 (R2), 36.70 (R3)

