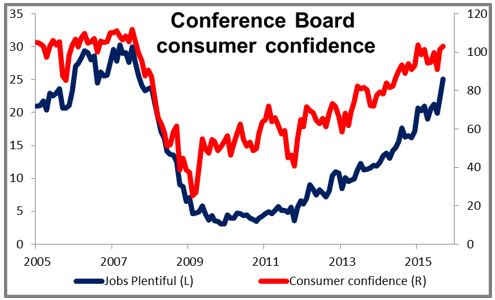
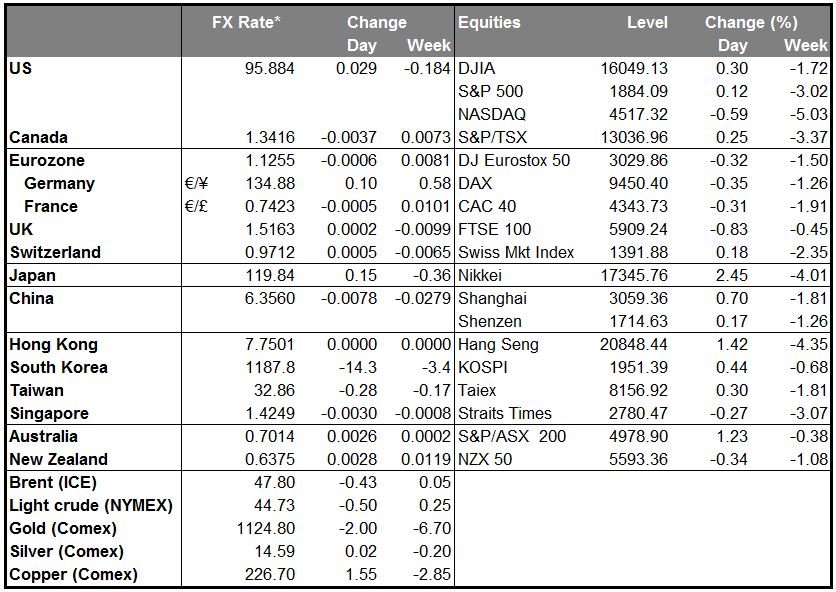
•Risk appetites improved Tuesday, helping risk assets to recover and reducing demand for safe-haven assets. US stocks recovered from early losses and closed marginally higher yesterday after consumer confidence surged, with the “jobs plentiful” index hitting a high for this cycle. The better mood continued in Asia this morning as all Asian stock markets rallied. Commodity prices were higher with 17 out of the 22 components of the Bloomberg commodity index rising, and Glencore (OTC:GLNCY) stock bounced back sharply. As a result, the commodity currencies and the high-beta SEK gained, while the safe-haven yen was the only G10 currency to show a noticeable decline. Confidence came back into EM as well and all 15 EM currencies that we track rose against the dollar, with the hard-hit ZAR and BRL showing the largest gains.
• The exceptions were the safe-haven CHF, which rose modestly, and the oil-linked CAD. USD/CAD hit a high for this cycle of 1.3457 even though oil prices were higher. The pair then fell back in Asian trading to trade largely unchanged. This kind of counter-trend activity makes me think that sentiment towards CAD remains negative. Ahead of today’s GDP for July (see below), which is expected to be weak, I think the currency could remain under pressure. Another exception: within commodities, natural gas fell over 3% as forecasts for normal weather in the eastern half of the US contrasted with above-normal gas inventories.
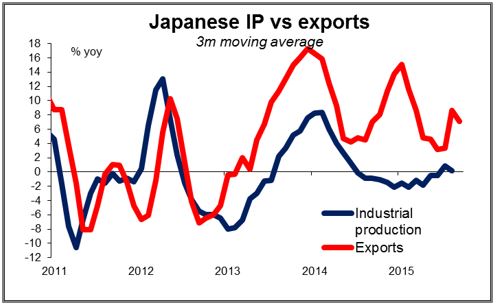
• Japan’s preliminary industrial production and retail sales, both for August, were disappointing. Production was expected to accelerate on a y/y basis, but in fact it barely budged – up 0.2% y/y from unchanged y/y. On a m/m basis it contracted. Retail sales were unchanged m/m and growth slowed on a y/y basis. Not good! Sluggish output growth and weak domestic demand only increase the importance of exports, and hence a weak yen, to Japan. This is particularly important in an environment of slowing global growth and competitive devaluations in Asia.
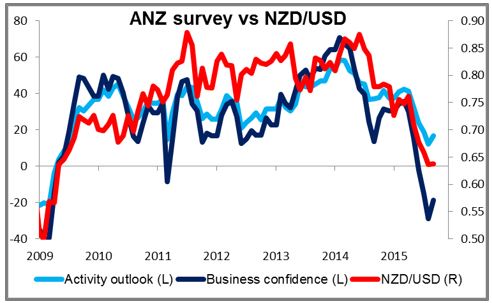
• New Zealand: ANZ business confidence for September rose slightly and the activity outlook improved, surprisingly (surprising to me at least, given the slowdown in China’s economy). The news helped to make NZD the day’s biggest gainer.
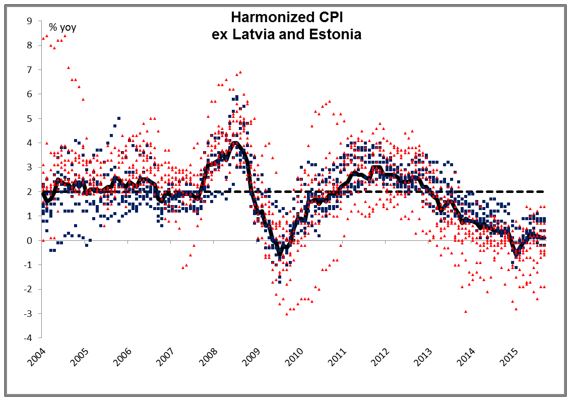
• Today’s highlights: During the European day, eurozone’s flash CPI for September is coming out. The forecast is for the preliminary figure to show that the euro-area inflation rate has declined to 0.0% y/y from 0.1% y/y in August. Following the decline in the German rate on Tuesday to unchanged on a y/y basis, the likelihood that the bloc’s CPI will meet or even come below the forecast is high. This could add to expectations that the ECB will have to expand or extend its QE program, which could put EUR under selling pressure. The graph below shows the CPI for most of the countries in the eurozone. The core countries (Germany, France, Austria, Belgium, Netherlands, Finland) are the blue dots, while the others are red. As you can see, before the financial crisis it was the smaller or weaker economies with high inflation while the core countries had below-average inflation. Now, it’s the weaker, troubled economies that are in deflation while the stronger economies continue to have positive price increases.
• We also get Germany’s retail sales for August and the nation’s unemployment rate for September. Eurozone’s unemployment rate for August is coming out as well.
• In the UK, the final estimate of Q2 GDP is expected to confirm the second estimate and show that the economy grew 0.7% q/q. Although recent comments by several BoE officials suggested that the policy normalization could start around the turn of this year, GBP has being under increased selling pressure recently. Therefore, a set of strong data are needed for the pound to gain momentum again.
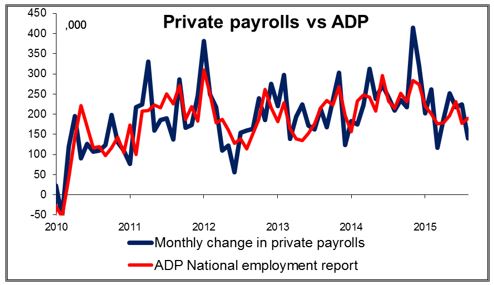
• From the US, we get the ADP employment report for September, two days ahead of the NFP release. The ADP report is expected to show that the private sector gained 190k jobs in September, the same as in August. Although an unreliable predictor of the NFP number, this could increase speculation that the NFP print on Friday may also come in below 200k. The Chicago Purchasing Managers’ index for September is also due out and is expected to have declined.
• From Canada, the monthly GDP for July is expected to have slowed to +0.2% m/m from +0.5% m/m. Given that the quarterly figure for Q2 came out negative, a slowdown in July could be a first sign that the Canadian economy contracted further in Q3. It looks like the effects of falling commodities prices on the Canadian economy are not going to fade out anytime soon. This could increase selling pressure on CAD.
• We have four speakers scheduled on Wednesday. During the European day, ECB Governing Council member Ardo Hansson will speak on the outlook for Estonia and the euro area. In the US morning, New York Fed President William Dudley speaks on Market Liquidity in New York. Then later in the day, Fed Chair Janet Yellen and St. Louis Fed President James Bullard will make opening remarks at the Fed’s annual Community Banking Research and Policy conference. I don’t know how detailed “opening remarks” are likely to be, but whenever Yellen is speaking, the market pays attention.
The Market
EUR/USD Rebounds From 1.1200
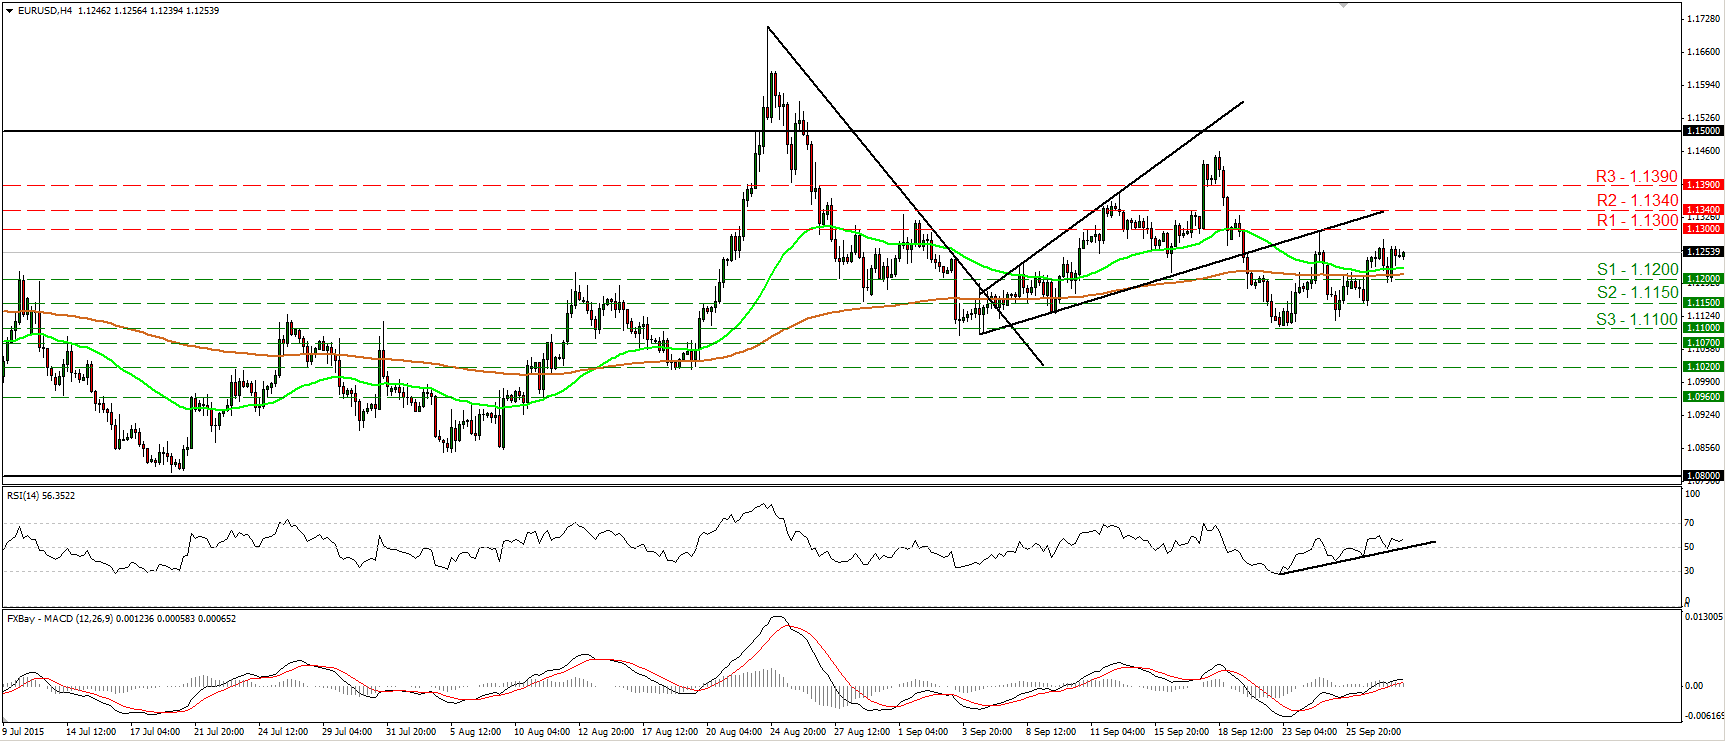
• EUR/USD traded slightly lower on Tuesday, but hit support near 1.1200 (S1) and rebounded to trade virtually unchanged. Although I still believe that it is possible to see a test near the 1.1300 (R1) barrier, I would maintain my flat stance as far as the short-term picture is concerned. A clear break above 1.1300 (R1) is needed to turn the near-term outlook positive in my view. Taking a look at our momentum studies, I see that the RSI rebounded from near its 50 line, while the MACD stands above both its zero and signal lines. These signs support that the pair is likely to continue trading higher for a while, at least for a test at the 1.1300 (R1) line. In the bigger picture, as long as EUR/USD is trading between the 1.0800 key support and the psychological zone of 1.1500, I would hold a flat stance as far as the overall picture is concerned. I would like to see another move above 1.1500 before assuming that the overall outlook is back positive. On the downside, a break below the 1.0800 hurdle is the move that could shift the picture negative.
- Support: 1.1215 (S1), 1.1150 (S2), 1.1100 (S3)
- Resistance: 1.1300 (R1), 1.1340 (R2), 1.1390 (R3)
GBP/USD Hits Again Support Near 1.5135
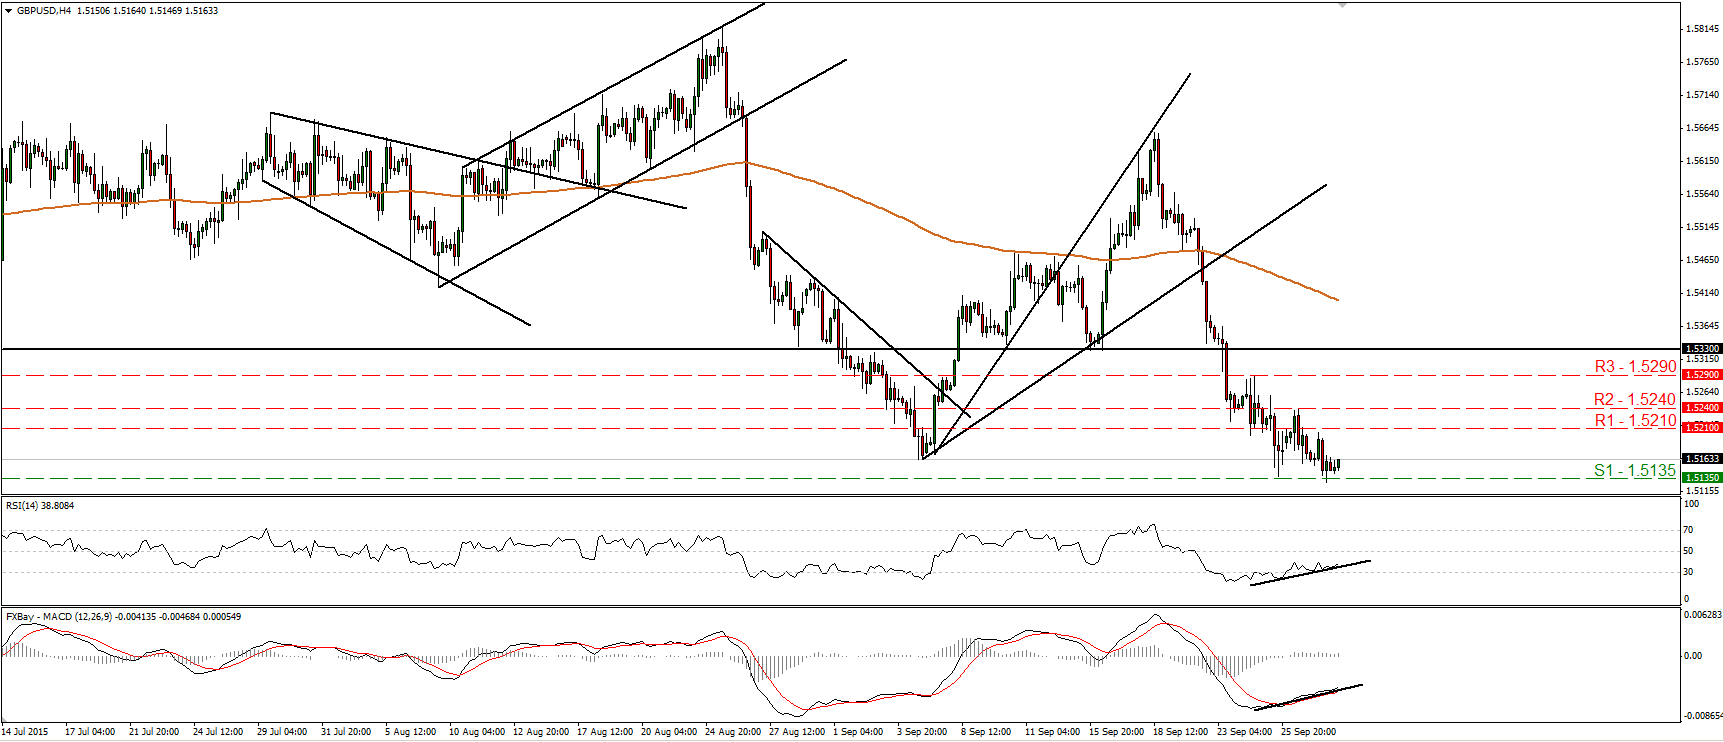
• GBP/USD traded lower yesterday after it hit resistance marginally below the 1.5210 (R1) hurdle. However, the decline was stopped once again by the 1.5135 (S1) barrier and today during the Asian morning, the pair rebounded somewhat. Given the inability of the bears to overcome the 1.5135 (S1) line, I would expect the forthcoming wave to be positive, perhaps for another test at 1.5210 (R1). A move above that line could extent the bullish move towards 1.5240 (R2). Our momentum studies support my view. The RSI edged higher after it rebounded from near its 30 line, while the MACD, although negative, stands above its trigger line and points up. Furthermore, there is positive divergence between both these indicators and the price action. Plotting the daily chart, I see that the rate is still below the 80 day exponential moving average. That moving average has now started to turn somewhat down, which turns the overall picture cautiously negative in my opinion.
- Support: 1.5135 (S1), 1.5100 (S2), 1.5030 (S3)
- Resistance: 1.5210 (R1), 1.5240 (R2), 1.5290 (R3)
AUD/USD Rebounds From Near 0.6950
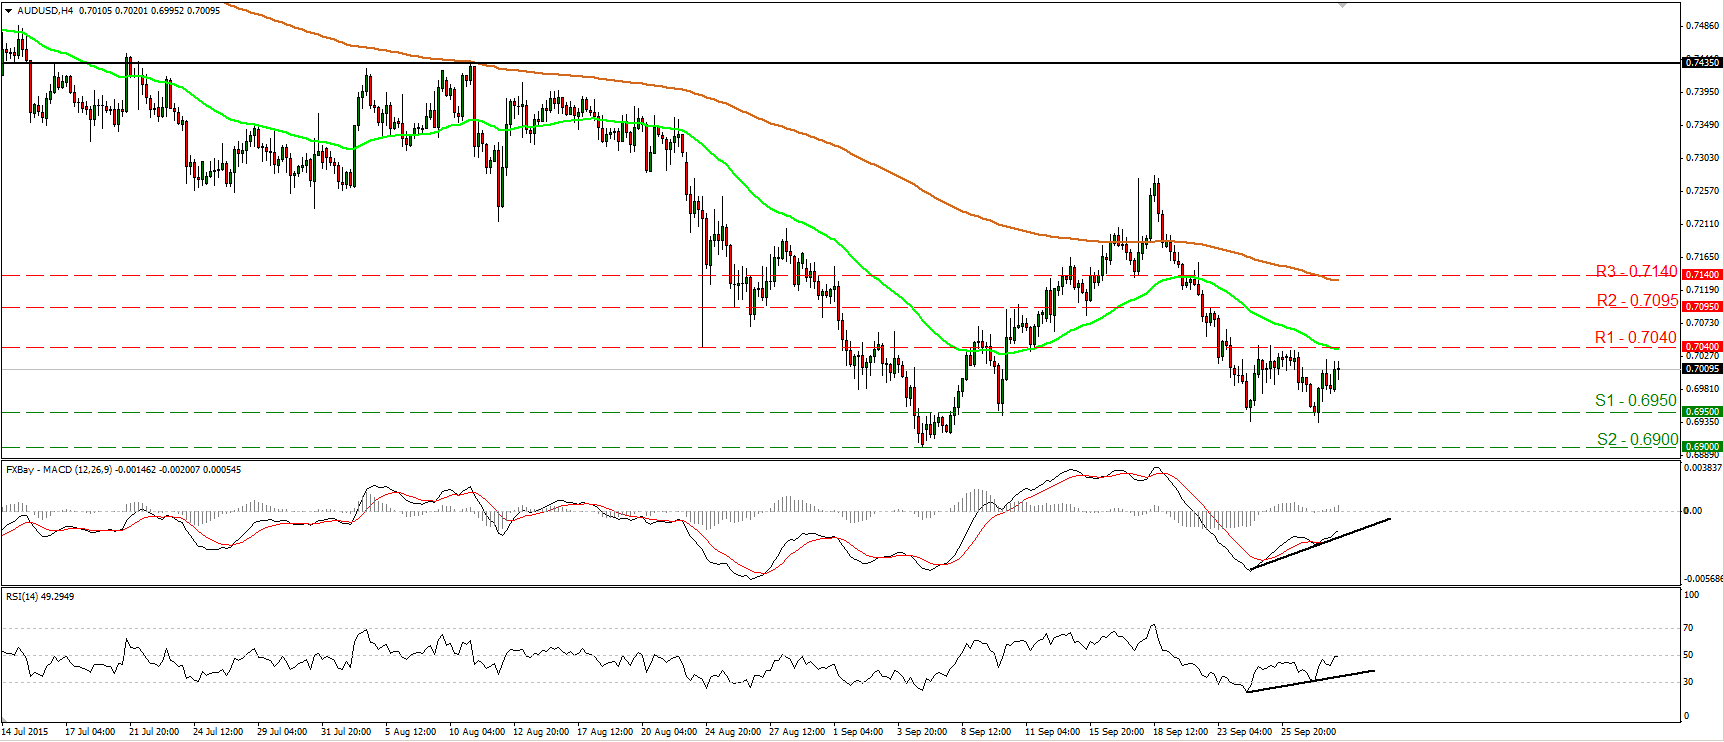
• AUD/USD traded higher on Tuesday, after it hit support once again near the 0.6950 (S1) support barrier. The rate now looks to be headed for another test at 0.7040 (R1), where an upside break could see scope for more bullish extensions, perhaps towards the next resistance at 0.7095 (R2). The RSI edged higher after it hit support at its 30 line and is now testing its 50 line. The MACD, although negative, stands above its trigger line and points north. What is more, there is positive divergence between both the indicators and the price action. Plotting the daily chart, I still see a major downtrend. However, the fact that the rate looks able to print a higher low near 0.6950 (S1) is the reason I would stay flat for now with regards to the broader trend.
- Support: 0.6950 (S1), 0.6900 (S2), 0.6775 (S3)
- Resistance: 0.7040 (R1), 0.7095 (R2), 0.7140 (R3)
Gold Falls Below 1128
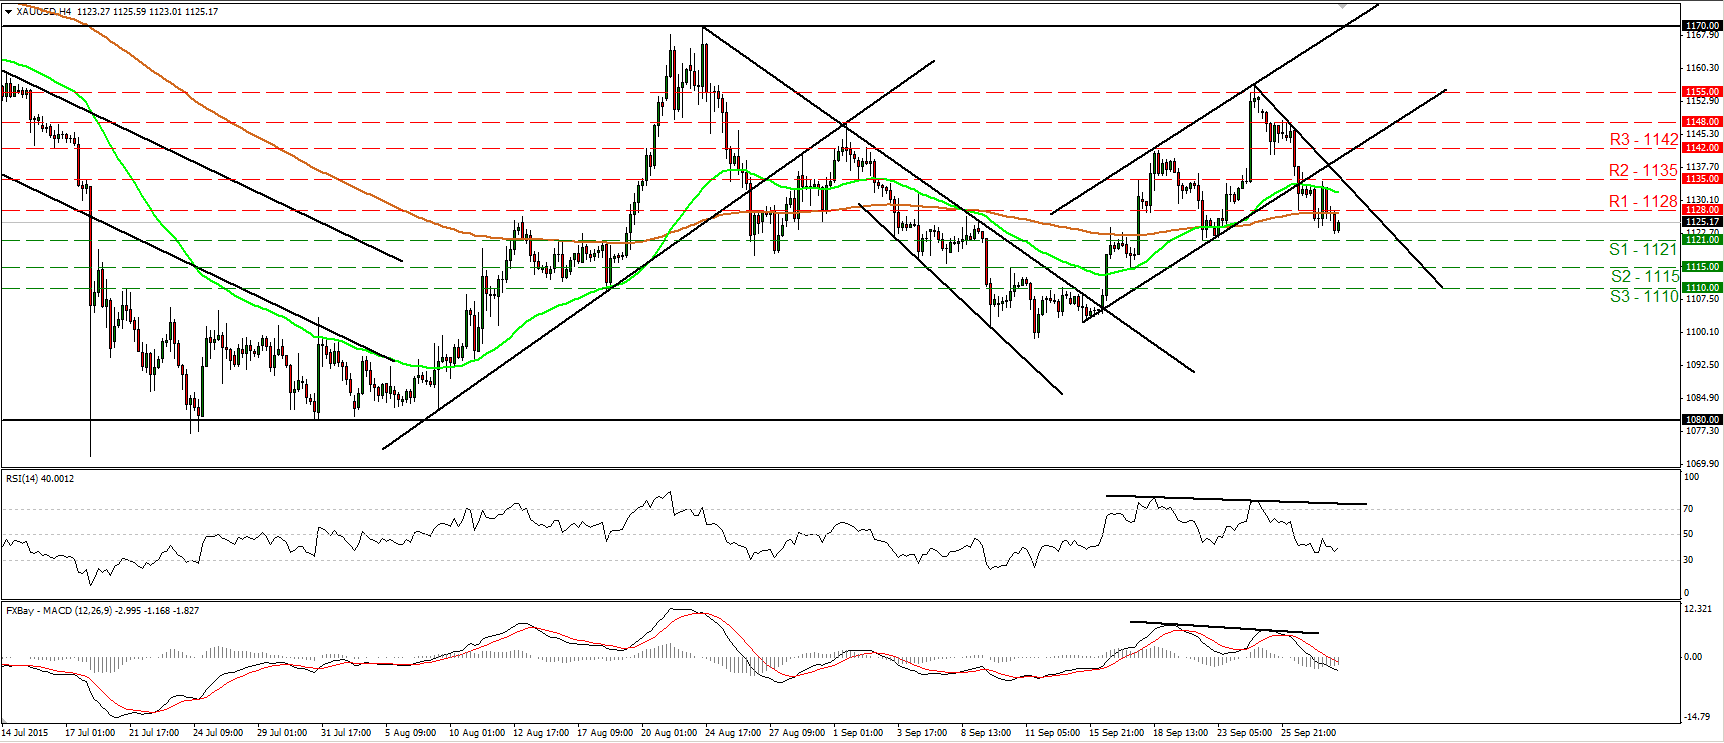
• Gold traded lower on Tuesday, falling below the support (now turned into resistance) barrier of 1128 (R1). The short-term bias remains negative in my view, and therefore, I would expect a test at 1121 (S1) in the near future. A clear break below 1121 (S1) is likely to set the stage for extensions towards the 1115 (S2) line. Our short-term oscillators detect negative momentum and support somewhat the notion. The RSI edged lower after it hit resistance near its 50 line, while the MACD lies below both its trigger and signal lines. However, the RSI has turned somewhat up again, giving evidence that a minor corrective bounce could be looming before the bears shoot again. As for the bigger picture, with no clear trending structure on the daily chart, I would hold my neutral stance as far as the overall outlook is concerned. I believe that a close above 1170 is needed to signal a newborn medium-term uptrend.
- Support: 1121 (S1), 1115 (S2), 1110 (S3)
- Resistance: 1128 (R1), 1135 (R2), 1142 (R3)
WTI Slides After Hitting 45.70
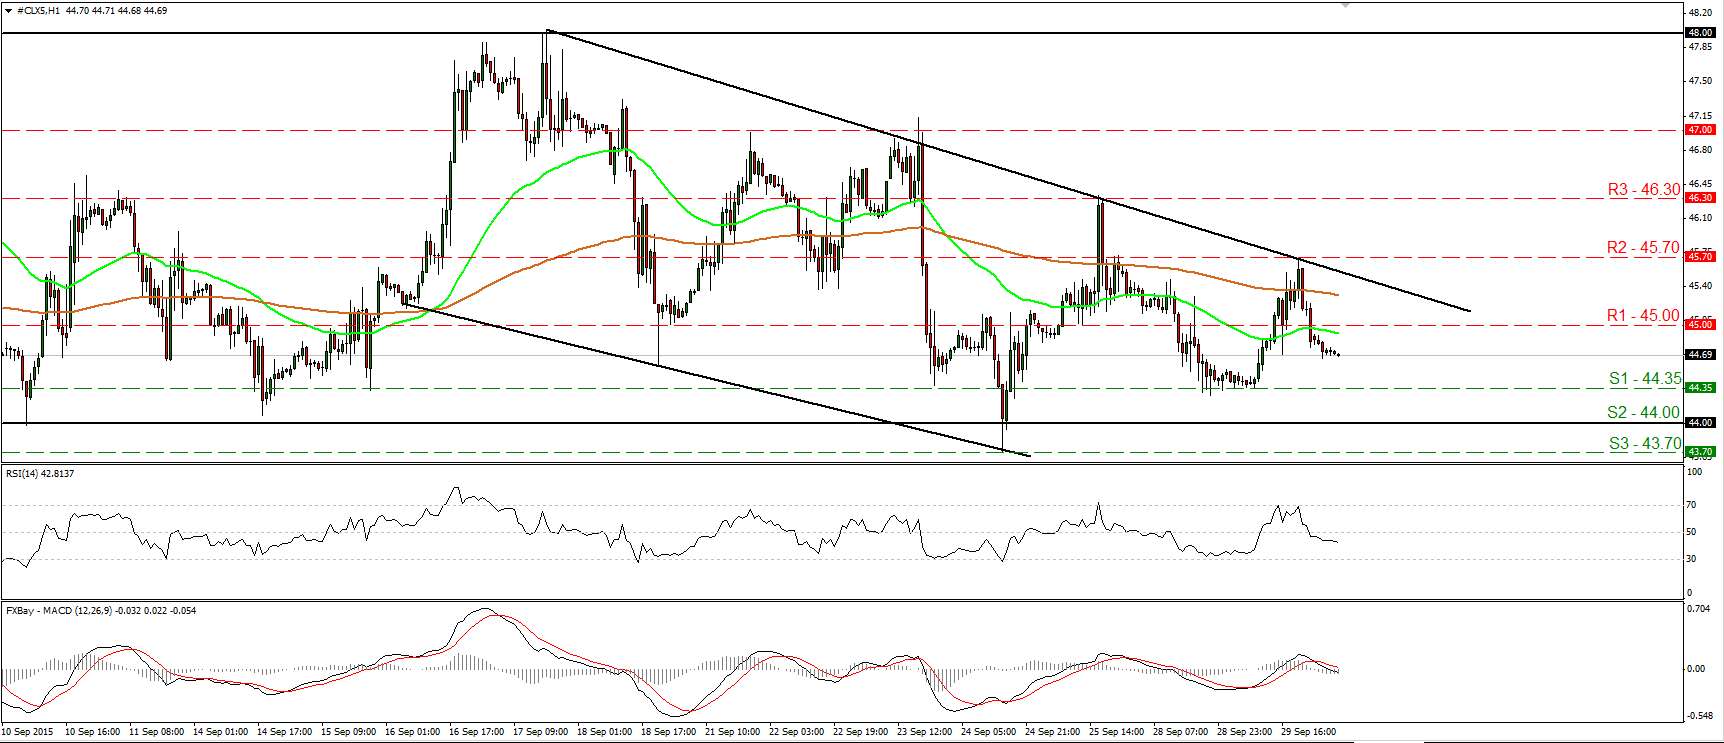
• WTI slid after it hit resistance at 45.70 (R2) and the line taken from the peak of the 17th of September. As long as the price is trading below that trend line, I believe that the short-term bias is to the downside. The price has also broke below the psychological line of 45.00 (R1) and therefore, I would expect the decline to continue and challenge the 44.35 (S1) barrier. A break below that obstacle is likely to aim for the 44.00 (S2) zone. Our hourly oscillators amplify the case that further declines could be in the works. The RSI fell below its 50 line and is now pointing down, while the MACD, already below its signal line, has just turn negative. In the bigger picture, WTI has been trading in a sideways mode between 44.00 and 48.00 since the first of September. As a result, I would consider the longer-term picture to be flat for now.
- Support: 44.35 (S1), 44.00 (S2), 43.70 (S3)
- Resistance: 45.00 (R1) 45.70 (R2), 46.30 (R3)

