We had several ECB speakers yesterday and the impression they left was one of “we are ready to do more if necessary, but it’s too early to tell if more is necessary.” First up was Austrian central bank governor Ewald Nowotny, one of the proponents of QE. He admitted that inflation is well below the ECB’s 2% target, but said that there is no need to act in the near term. Slovenian central bank governor and ECB Governing Council member Bostjan Jazbec said that there are “no discussions” about policies other than quantitative easing, adding that it’s too early to talk about any other scenario than the one that was already outlined at the June ECB meeting.
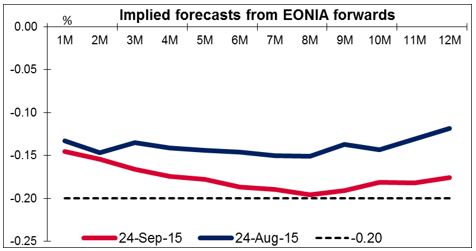
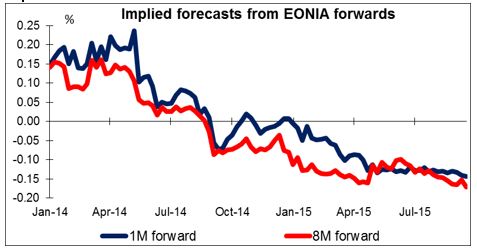
• His comments may have been in reference to the market talk about the possibility of a further cut in the deposit rate, currently -0.20%. The 8th EONIA forward contract is now also implying the same rate of -0.2%, which would only be possible if the market is pricing in a further cut in the deposit rate. However, given that Draghi has already stated that rates are at the effective floor, it’s not likely that they would want to reopen this issue.
• Indeed, ECB President Draghi confirmed the impression that other ECB speakers had given. He reaffirmed that the ECB was flexible on QE, repeating previous comments that the ECB stood ready to adjust “the size, composition and duration” of the QE program rather than holding out the possibility of any further rate cuts. He also noted that more time was needed to determine if the loss of growth momentum in EM is temporary or permanent and downplayed the revisions to forecasts, which he said were marginal. So the ECB, like the Fed, is on hold for now waiting to see what happens in the future. This gave the market no reason to break out of its current range in EUR/USD and the pair continues to gyrate up and down.
BRL plunges; crisis could have global impact On the other hand, things might get worse for EM countries in the near future. BRL, the worst-performing currency in the world so far this year, did even worse yesterday – down 3% in one day after Lower House President Eduardo Cunha said he would address impeachment procedures in response to opposition requests. Later he released the document that covers the process of impeachment. Just because things are bad doesn’t mean they can’t get worse! The Brazilian crisis has global implications. The collapse in Brazil can cause a general outflow from EM stock and bond funds, which would help to spread the downturn to other EM countries as well. And as we’ve seen from many central banks around the world, instability in EM markets is a major concern for the G10 central banks as well. Plus a slowdown in EM growth means naturally a slowdown in G10 growth as well.
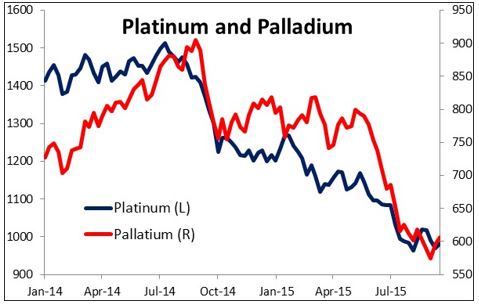
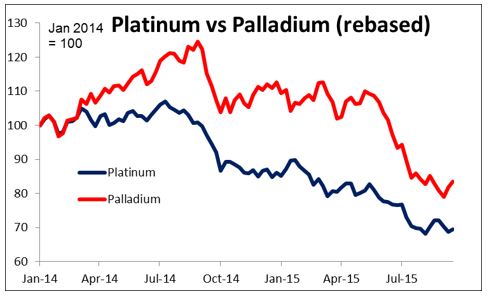
• Platinum plunges (then recovers), palladium surges Platinum fell to nearly a 7-year low in New York trading on fears that the VW scandal would hit demand for the metal, which is used in diesel catalytic converters. On the other hand palladium, which is used in catalytic converters for gasoline-driven vehicles, surged 7%, aided by China’s clean-air drive too. However, platinum recovered in Asian trading and is now higher – no idea why.
• VW crisis may impact CZK, HUF The VW crisis could have a more direct impact on the currency market. Both Czech Republic and Hungary are both highly exposed to the auto industry, Germany in general and VW specifically. Auto exports accounted for 16% of GDP in the Czech Republic last year and almost 13% of GDP in Hungary. Volkswagen (XETRA:VOWG) owns Skoda, the largest car manufacturer in the Czech Republic, and also Audi Hungary, which between cars and engines is the largest auto manufacturer in Hungary and an important employer. More broadly, exports to Germany account for some 28% of GDP in the Czech Republic, vs 22% in Hungary.
• Today’s highlights: During the European day, the main event will be the Norges Bank rate decision. The current market expectations are for the Bank to keep the rates unchanged. Although Norway’s CPI is still close to the Bank’s 2.5% target, negative developments since the last meeting, including lower oil prices, soft industrial production and weak manufacturing PMI, increase the risk of another cut. This could push NOK to fresh lows. The country remains sensitive to oil prices, with Brent being the key focus amid renewed concerns surrounding the outlook for global balances. Low oil prices lead to a drop in investment in the oil sector, which affects oil-related businesses. Cost cuts and layoffs from the sector could put upward pressure in Norway’s unemployment rate, which increased to 3.1% in August from 2.8% in June, when their last meeting took place. Therefore, the Bank may cut interest rates one more time this year to support its economy.
• From Germany, we get the Ifo survey for September. The German ZEW survey showed a mixed picture for the Eurozone’s strongest economy: the expectations index declined once again from the previous month, while the moderate increase in the current situation index was not enough to reverse investors’ concerns about Germany’s weak recovery. We expect all the Ifo indices to nudge down further this month, adding to evidence that the German recovery is petering out.
• From Sweden, we get the economic tendency survey for September. The forecast is for the indicator to decrease a bit, which could weaken SEK somewhat.
• From the US, we get the durable goods orders for August. The headline figure is expected to fall, a turnaround from the month before, while durable goods excluding transportation equipment are estimated to decelerate somewhat. The focus is usually on the core figure where a positive surprise could suggest the possible start of a turnaround in business investment and could support the dollar. New home sales for August are also to be released. In line with the recent strong housing data, new home sales are expected to show a firming housing market. Initial jobless claims for the week ended Sept. 19 are also coming out.
• As for the speakers, ECB Executive Board member Peter Praet speaks. He spoke earlier in the week, and furthermore ECB head Draghi spoke yesterday, so this is not likely to be a market-moving event. Late in the European day, Fed Chair Janet Yellen speaks at the University of Massachusetts. She might emphasize that the majority of FOMC members – 13 out of 17 – expect to start normalizing rates this year, which could be USD-positive.
The Market
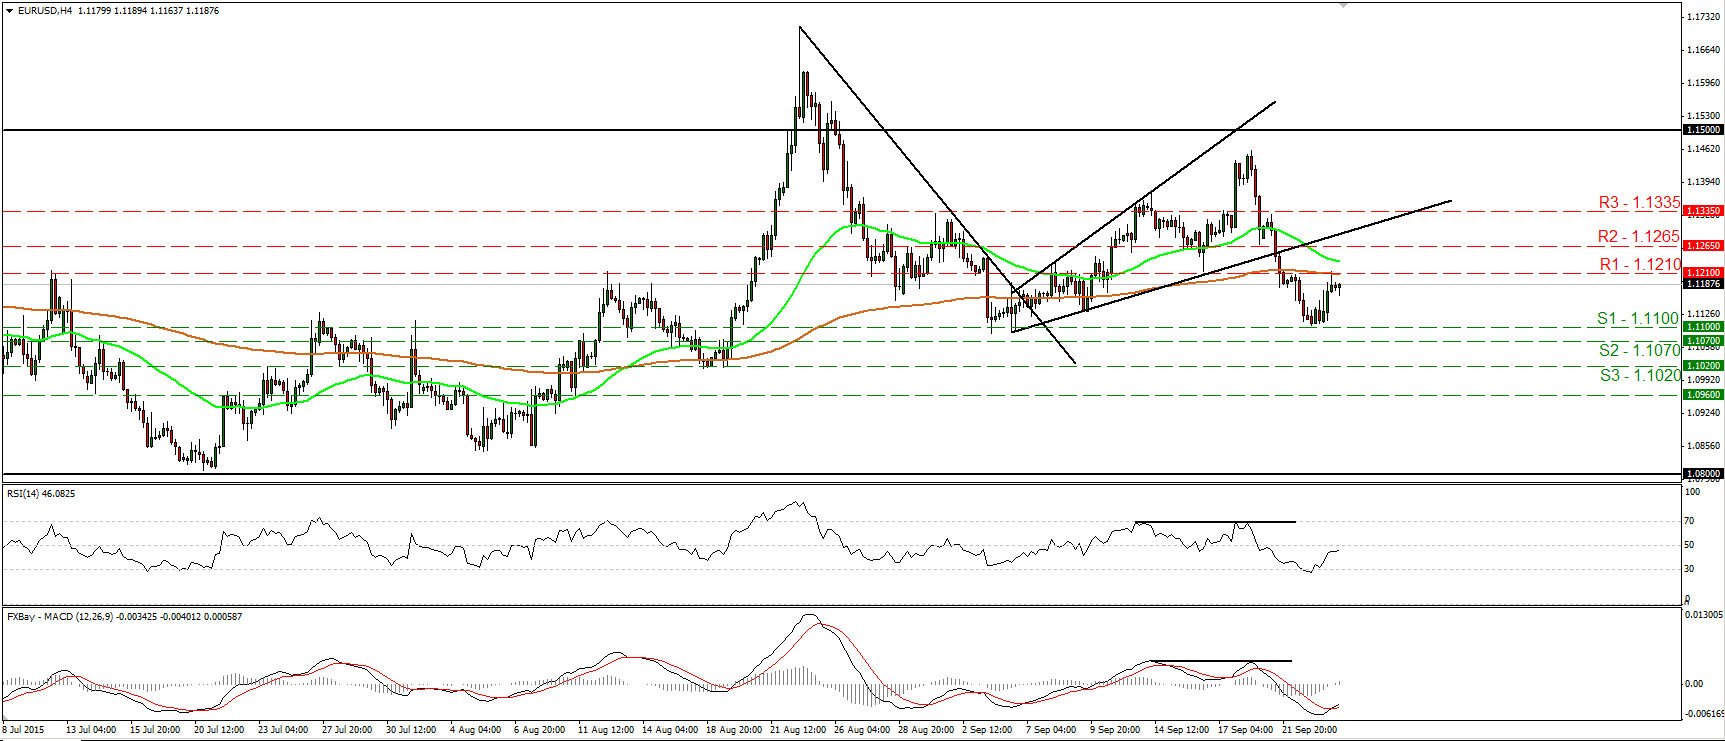
EUR/USD rebounds from the 1.1100 zone
• EUR/USD rebounded from near the 1.1100 (S1) support zone and hit resistance at the 1.1210 (R1) hurdle. The price structure on the 4-hour chart still suggests a short-term downtrend, but I see signs that the current rebound could continue, so I would switch my view to flat for now. The RSI edged higher and could now challenge its 50 line, while the MACD, although negative, has bottomed and crossed above its trigger line. These momentum signs amplify the case that the recovery from 1.1100 (S1) could continue for a while. A clear break above 1.1210 (R1) is likely to confirm that and could aim for the next resistance at 1.1265 (R2). As for the broader trend, given that EUR/USD is still trading below 1.1500, I would hold a neutral stance as far as the overall picture is concerned. I would like to see another move above 1.1500 before assuming that the overall outlook is back positive. On the downside, a break below the 1.0800 hurdle is the move that could shift the picture negative.
• Support: 1.1100 (S1), 1.1070 (S2), 1.1020 (S3)
• Resistance: 1.1210 (R1), 1.1265 (R2), 1.1335 (R3)
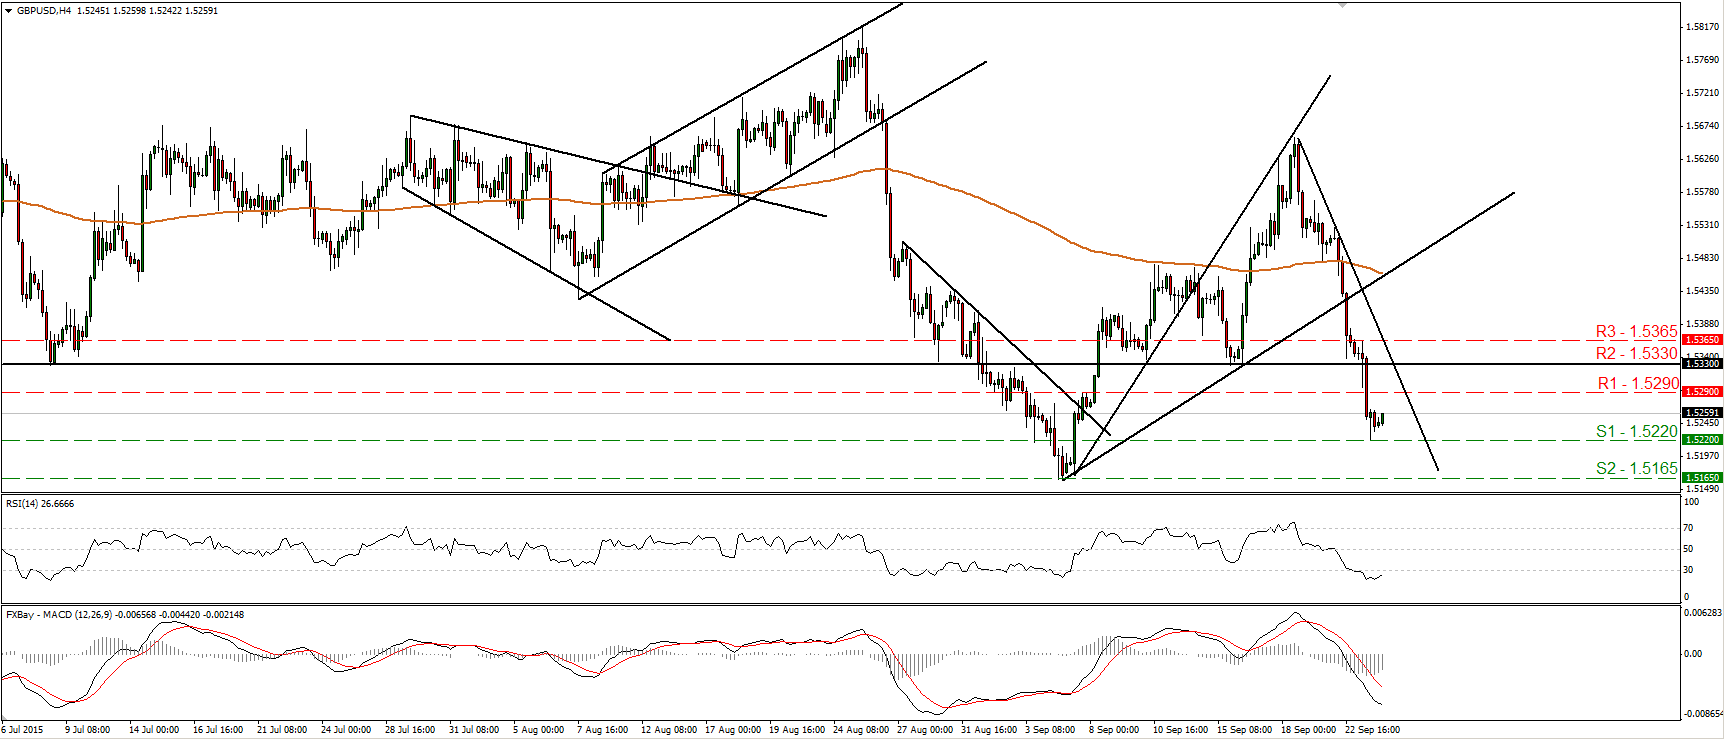
GBP/USD plunges and hits support at 1.5220
• GBP/USD collapsed further yesterday, falling below the key obstacle of 1.5330 (R2). The fall was stopped at 1.5220 (S1) and subsequently, the rate rebounded somewhat. The short-term trend remains negative in my view, but given our momentum signs, I would be careful of further upside, perhaps to challenge the 1.5290 (R1) barrier. A break above that line would set the stage for a test of the 1.5330 (R20 hurdle, as a resistance this time. The RSI has bottomed within its oversold territory and could move above 30 soon, while the MACD, although negative, shows signs of bottoming. Plotting the daily chart, I see that the rate is back below the 80 day exponential moving average. Given that Cable now oscillates above and below that average, which points sideways, I prefer to stay on the sidelines as far as the overall outlook is concerned.
• Support: 1.5220 (S1), 1.5165 (S2), 1.5100 (S3)
• Resistance: 1.5290 (R1), 1.5330 (R2), 1.5365 (R3)
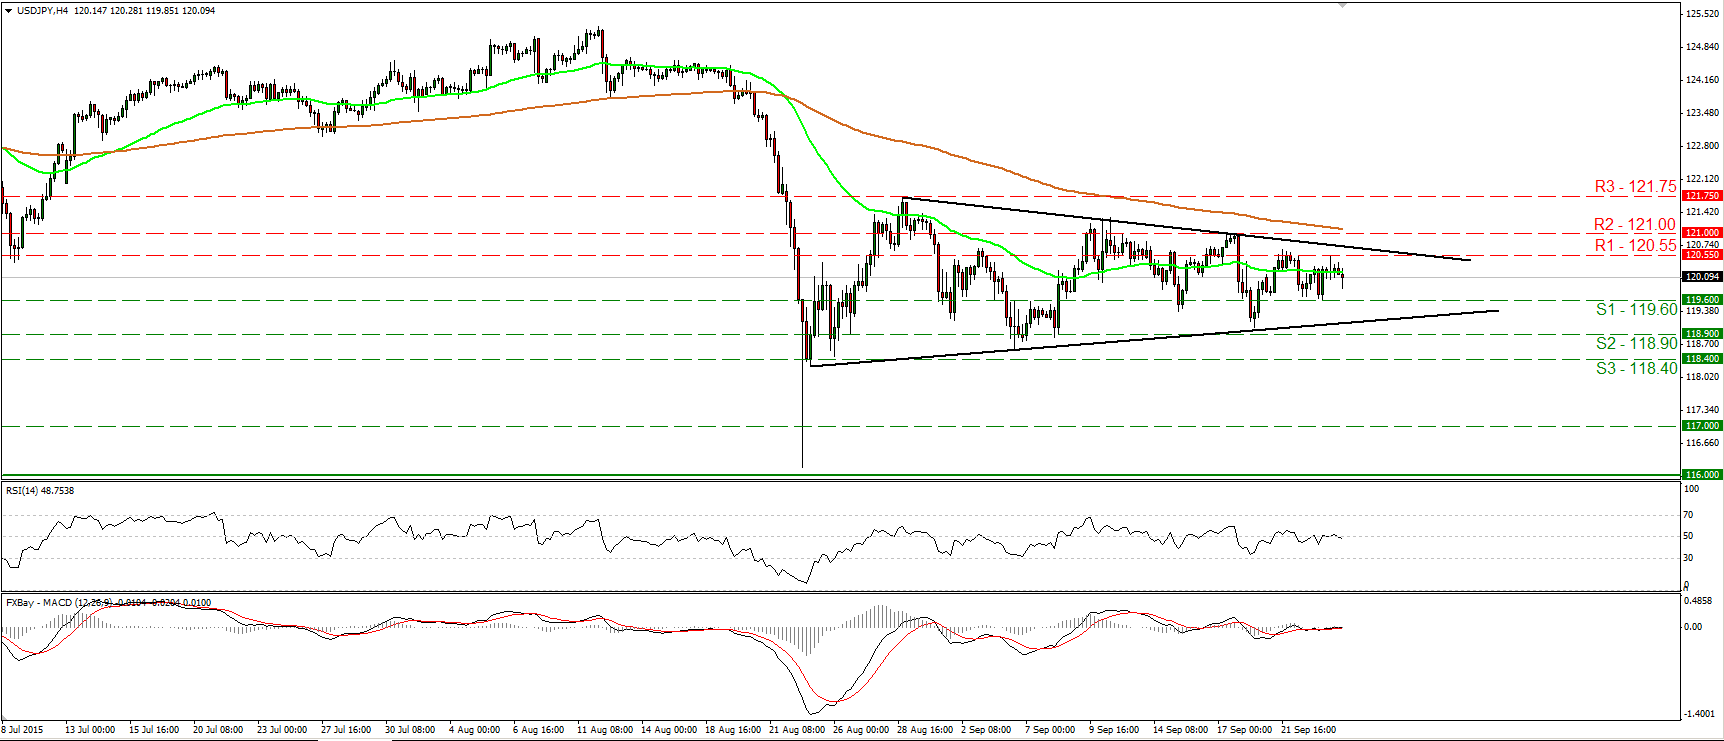
USD/JPY continues within a triangle pattern
• USD/JPY continued to trade within the triangle it’s been oscillating in since the 25th of August. As a result, I still consider the outlook of the pair to be flat. Yesterday, the rate hit resistance at 120.55 (R1) and then it retreated somewhat. I believe that the rate could continue lower for a while and perhaps challenge once again the 119.60 (S1) support line. However, a break below 118.90 (S2) is needed to signal the downside exit of the triangle. Something like that is likely to initially target the next support at 118.40 (S2). Our short-term momentum studies oscillate around their equilibrium barriers, supporting the flat near-term picture. As for the broader trend, the plunge on the 24th of August signaled the completion of a possible double top formation, which turned the medium-term outlook somewhat negative. As a result I would treat the recovery from the 116.00 zone as a corrective phase for now.
• Support: 119.60 (S1), 118.90 (S2), 118.40 (S3)
• Resistance: 120.55 (R1), 121.00 (R2), 121.75 (R3)
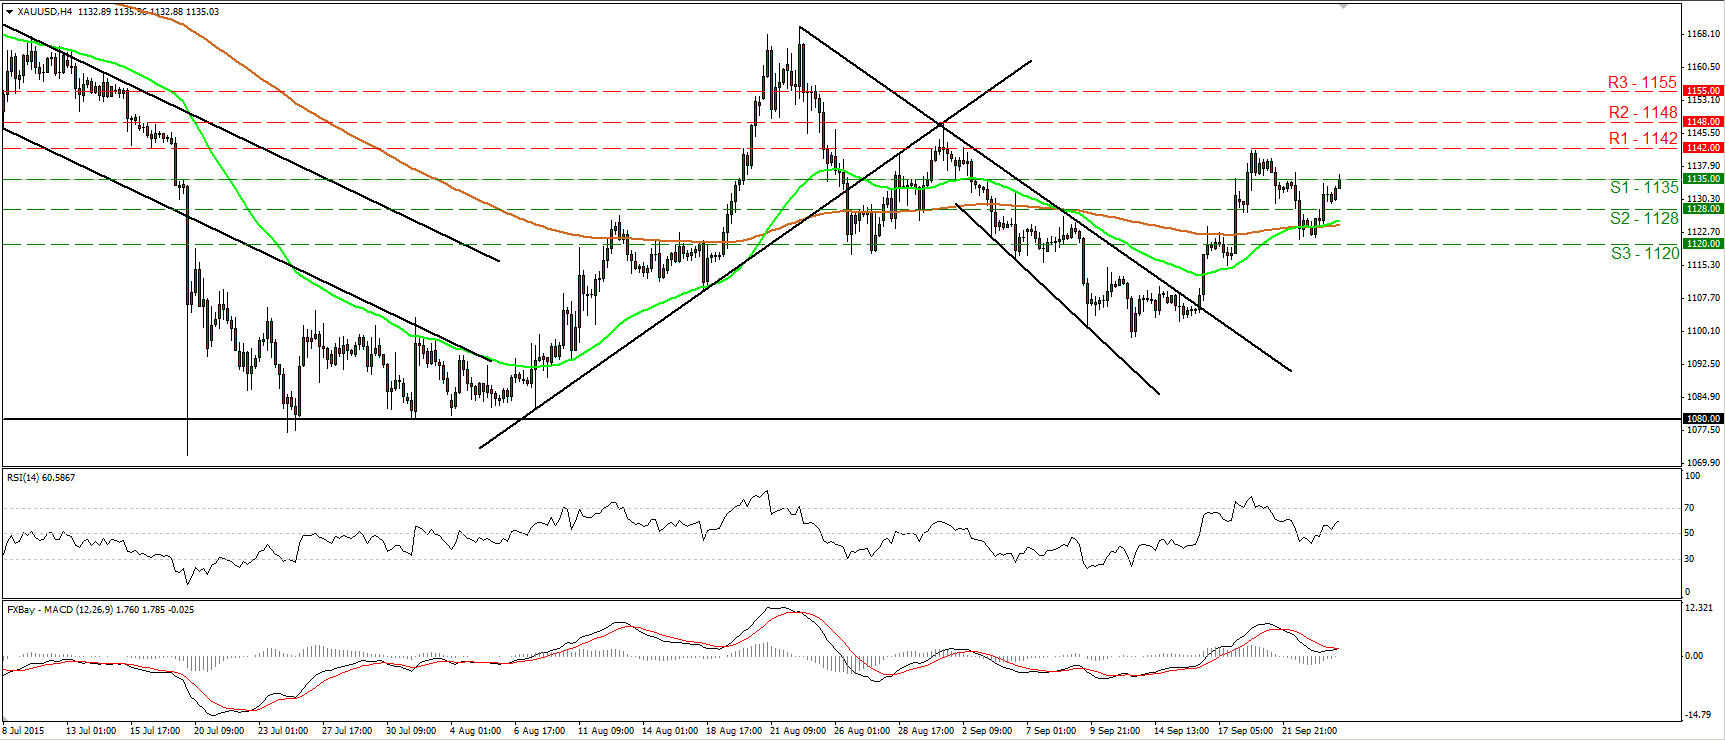
Gold rebounds and breaks above 1135
• Gold rebounded from slightly above the 1120 (S3) barrier on Wednesday and managed to break above the resistance (now turned into support) hurdle of 1135 (S1). Although it is possible for the positive move to continue towards 1142 (R1), I would change my stance to neutral for now. I prefer to see a clear break above 1142 (R1) before getting more confident on the upside. Such a move would confirm a forthcoming higher high and perhaps challenge the next resistance at 1148 (R2). On the downside, I prefer to see a clear dip below 1120 (S3) before assuming that the bears are in the front seat. As for the bigger picture, with no clear trending structure on the daily chart, I would hold my neutral stance as far as the overall outlook is concerned as well.
• Support: 1135 (S1), 1128 (S2), 1120 (S3)
• Resistance: 1142 (R1), 1148 (R2), 1155 (R3)
DAX consolidates above 9540
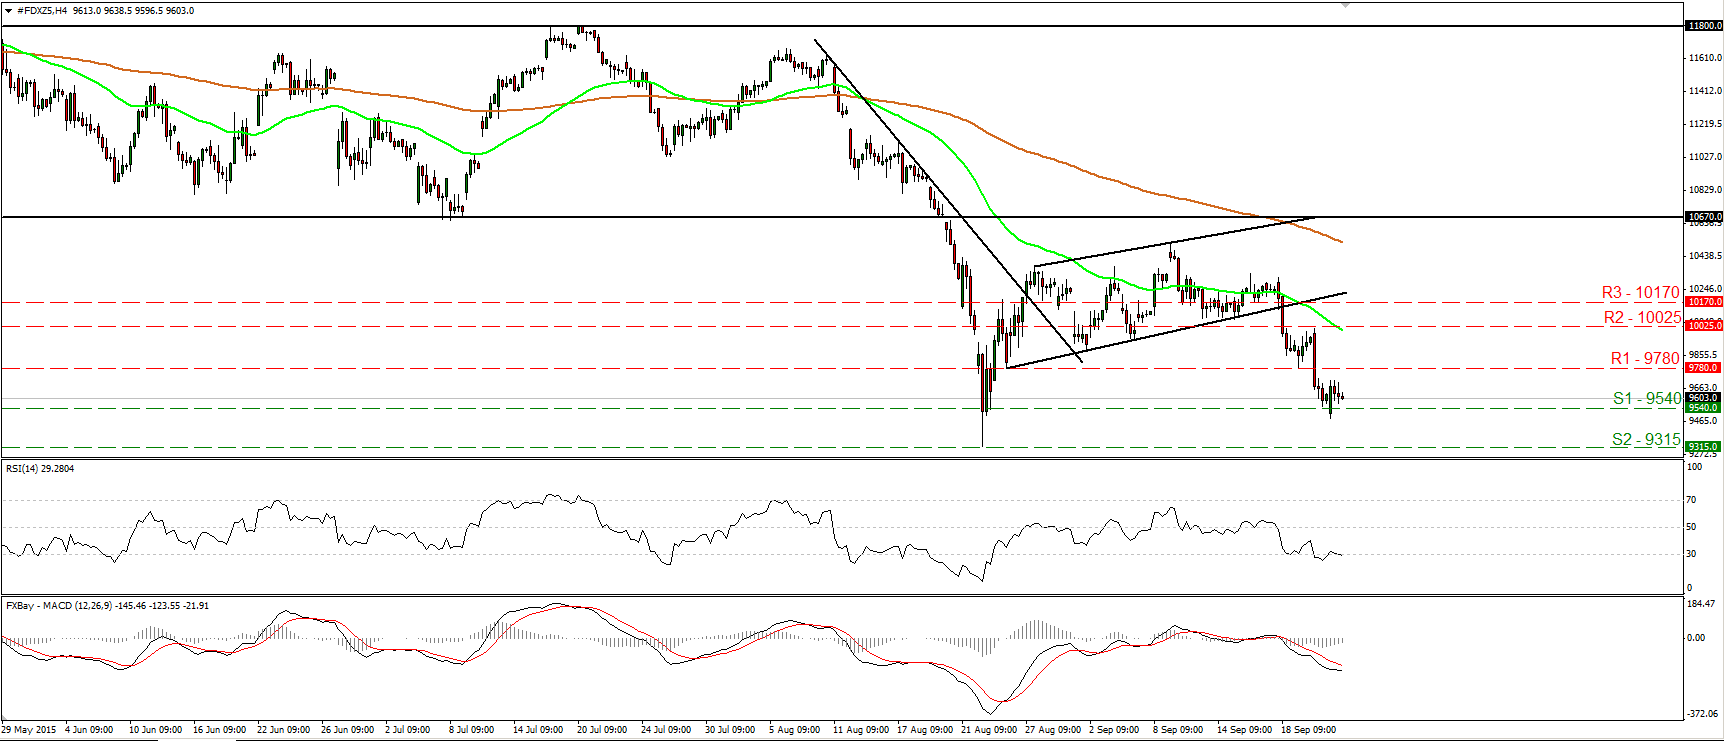
• DAX futures opened below 9540 (S1) on Wednesday, but rebounded to trade in a consolidative mode slightly above that hurdle. The price structure still suggests a short-term downtrend in my view and therefore, I would expect another attempt below 9540 (S1) to see scope for extensions towards the 9315 (S2) support, defined by the low of the 24th of August. Our momentum indicators detect strong downside speed and the case for further declines. The RSI fell back below its 30 line, while the MACD lies below both its zero and signal lines. On the daily chart, the break below 10670 on the 20th of August has shifted the medium-term outlook to the downside, in my view. Therefore, I would treat the 24th of August – 9th of September recovery as a corrective phase and I would expect the index to extend its declines.
• Support: 9540 (S1), 9315 (S2), 9130 (S3)
• Resistance: 9780 (R1) 10025 (R2), 10170 (R3)

