• Fed hikes rates: Ends zero-rate era The FOMC unanimously voted to increase the target range of the federal funds rate by 25bps and emphasized that the future hikes will be gradual. In the press conference following the decision Fed’s Chair Yellen said that “the Fed’s decision today reflects our confidence in the US economy”. This signals that the US economy has largely overcome the wounds of the financial crisis and is expected to continue to perform well. In the statement accompanying the decision, the committee acknowledged considerable improvements in the labor market conditions and expects inflation to return to 2% as the transitory effects of declines in energy prices fade away. The path of future policy will be determined by incoming data from the labor market and signs of inflationary pressures and inflation expectations. Overall, Fed officials expect that economic conditions will evolve in a manner that only warrants gradual increases in the fed funds rate. The “dot plot” median projections for 2016 were unchanged, showing that Fed officials still expect around 4 hikes next year. Although the pace of increases expected by the Committee is slower compared to earlier cycles of Fed rate increases, it is faster than what the market was pricing ahead of the meeting. As a result, the dollar regained some of its lost glamour and strengthened against its major peers. We will continue to closely monitor US economic data, and especially inflation data, as they will determine the course of how “gradually” next hikes will occur.
• Today’s highlights: During the European day, the main event will be the Norges Bank monetary policy meeting. The recent tumble in oil prices is slowing Norway’s oil and gas investments, which could put pressure on the Bank to act again. Nevertheless, inflation accelerated in November and currently lies above the Bank’s 2.5 % target, thus lowering the key interest rate further could be difficult to justify. In its latest monetary policy report, the Bank indicated that the depreciation of NOK should be seen with connection to declining oil prices, and that a weak currency contributes to higher inflation and economic activity. They noted that this pushes up the path for the key policy rate and therefore, we expect the Bank to remain on hold at this meeting, despite the plunge in oil prices. Additionally, the statement accompanying the decision will be closely monitored by market participants, as it is expected to indicate a dovish stance and could weaken NOK further. It could also provide strong signals regarding the Bank’s likelihood to ease further in March.
• EU leaders will meet in Brussels to hold their final two-day summit of 2015, which will focus on the migrant crisis, the terrorism threat, measures to boost the continent’s single market and the British referendum on EU membership. The UK Prime Minister David Cameron has pushed a set of suggestions for EU reform, which he would like to be high on the agenda of discussion. A failure to meet PM Cameron’s requests could increase the likelihood of a “Brexit” in the referendum to be held in 2017 and put further selling pressure on GBP.
• As for indicators: From Europe, Sweden’s official unemployment rate for November is expected to have declined. Given that the PES unemployment rate for the same month met expectations and remained unchanged, a decline in the official jobless rate could strengthen SEK at the release.
• The German Ifo survey for December is due to be released. The forecast is for the business climate index to remain unchanged, while the expectations index to tick up a bit. The forecast is somewhat in line with the ZEW survey for the same month, which showed that the outlook for the German economy shows signs of improvement. Therefore, we see a possibility for a positive surprise in the Ifo indices as well. This could support the Eurozone’s common currency.
• In the UK, the retail sales excluding volatile items for November are due to be released. Expectations are for a +0.6% mom increase, a turnaround from -0.9% mom the previous month. A rebound in the figure could indicate growing demand in the final quarter of the year and following a mixed employment report on Wednesday, a strong retail sales figure is needed for the GBP to regain some steam.
• From the US, we get initial jobless claims for the week ended 11th of December. Even though the forecast is for the figure to decrease, the 4-week moving average is expected to edge slightly higher. The Philadelphia Fed business activity index for December is expected to show a modest decrease, while the Conference Board leading index for November is expected to have decelerated from the previous month. Coming a day after the FOMC meeting, none of these indicators will be of a particular importance as the market will still be digesting any impact following the much-anticipated meeting.
• We have no speakers scheduled on Thursday’s agenda.
The Market
EUR/USD falls below 1.0900
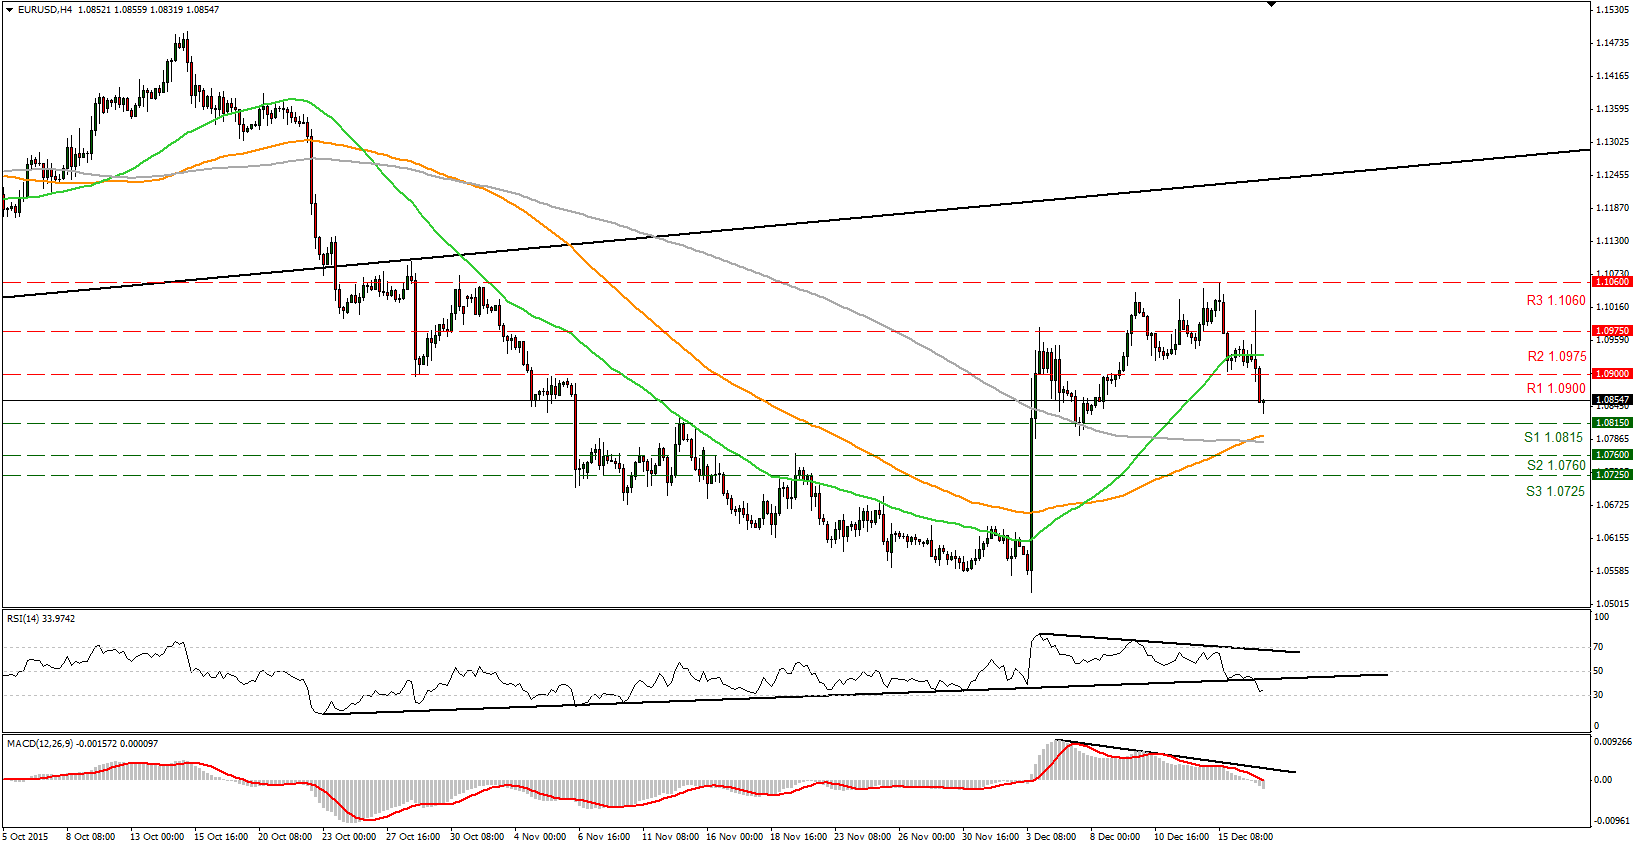
• EUR/USD plunged following Fed Chair Yellen’s press conference after the rate hike, as the market digested the positive tone of the speech, the unchanged “dot plots” and the first US rate hike after nearly a decade. The pair moved higher initially few minutes after the decision, breaking above our 1.0975 (R2) resistance area. Subsequently, EUR/USD fell to break below the round figure of 1.0900 (R1). During the early European morning session, the pair trades above our 1.0815 (S1) support zone. A break below that area could trigger larger bearish extensions and perhaps target our next support at 1.0760 (S2). Looking at our short-term oscillators the RSI lies just above 30 pointing down, while the MACD, continued to decline and fell below its zero line. These momentum signs support my view that we could see EUR/USD trading a bit lower, at least until the 1.0815 (S1) territory. As for the broader trend, the pair still trades above the 1.0800 barrier, the lower bound of the range it had been trading from the last days of April until the 6th of November. As a result, I prefer to take a neutral stance as far as the overall outlook of EUR/USD is concerned.
• Support: 1.0815 (S1), 1.0760 (S2), 1.0725 (S3)
• Resistance: 1.0900 (R1), 1.0975 (R2), 1.1070 (R3)
GBP/USD breaks below 1.5000
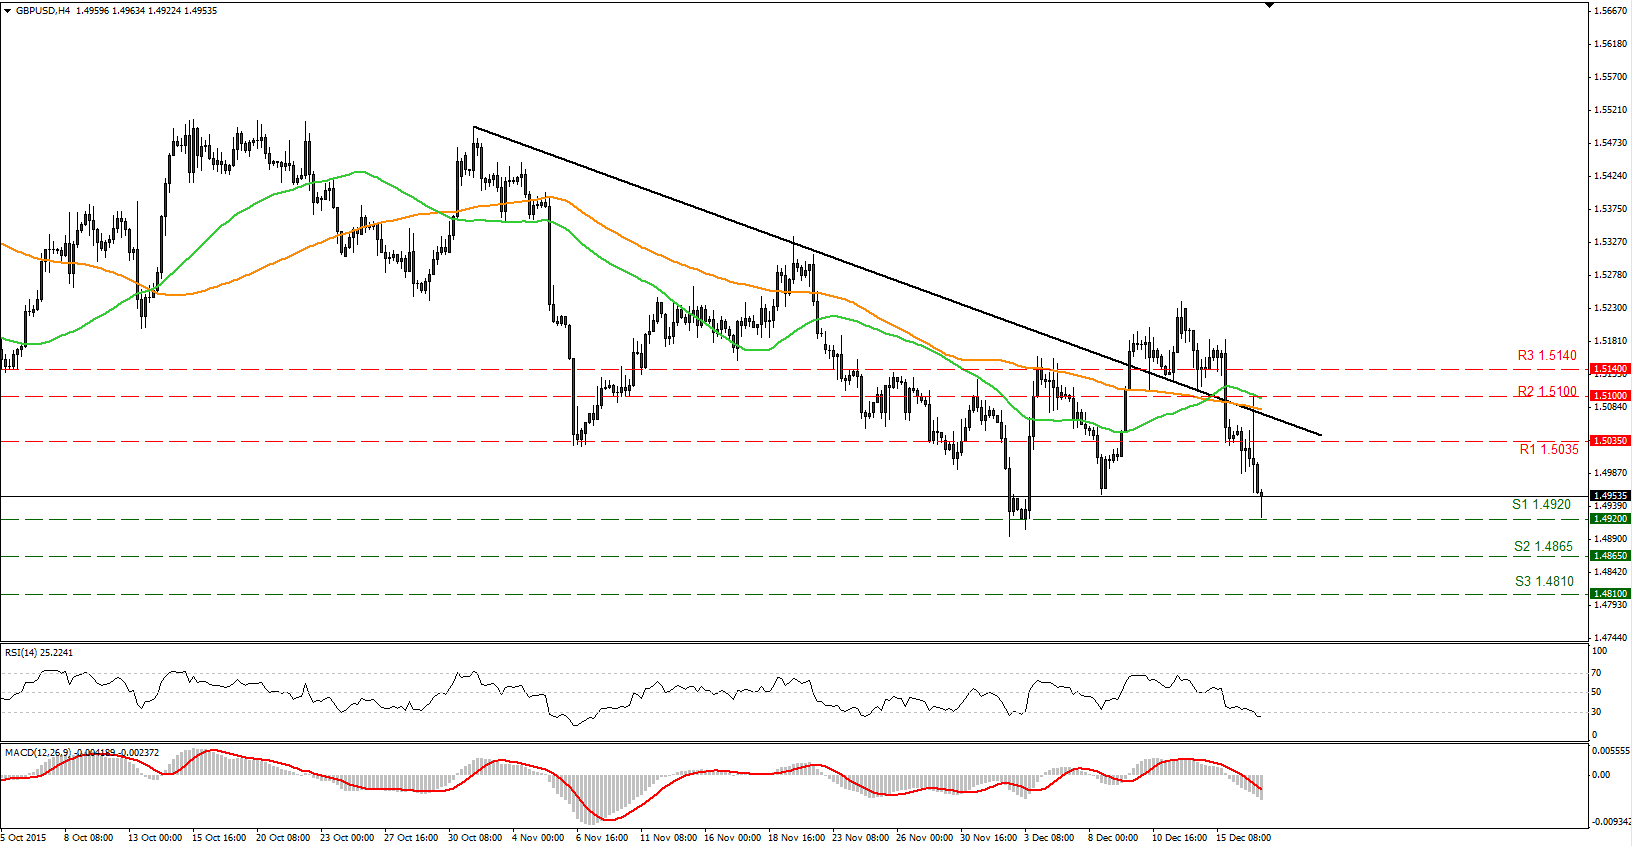
• GBP/USD tumbled on Wednesday after the FOMC meeting, breaking below the psychological 1.5000 area. The decline was halted near the 1.4920 (S1) support area as the pair found some buy orders at that level. A break below that support zone could push the rate lower, perhaps for a test of our next support at 1.4865 (S2). Even though our short-term momentum studies detect accelerating downside speed and support my case to see Cable trading lower, I would be mindful for a minor correction before the next leg lower. The main reason for this, is the fact that the RSI hardly exceeds the 30 level in the 4-hour chart, and it is currently just below it. Also on the broader trend, although the price structure remains lower peaks and lower troughs, we need a dip below 1.4900 to signal a lower low on the daily chart.
• Support: 1.4920 (S1), 1.4865 (S2), 1.4810 (S3)
• Resistance: 1.5035 (R1), 1.5100 (R2), 1.5140 (R3)
GBP/JPY hit resistance near 183.50
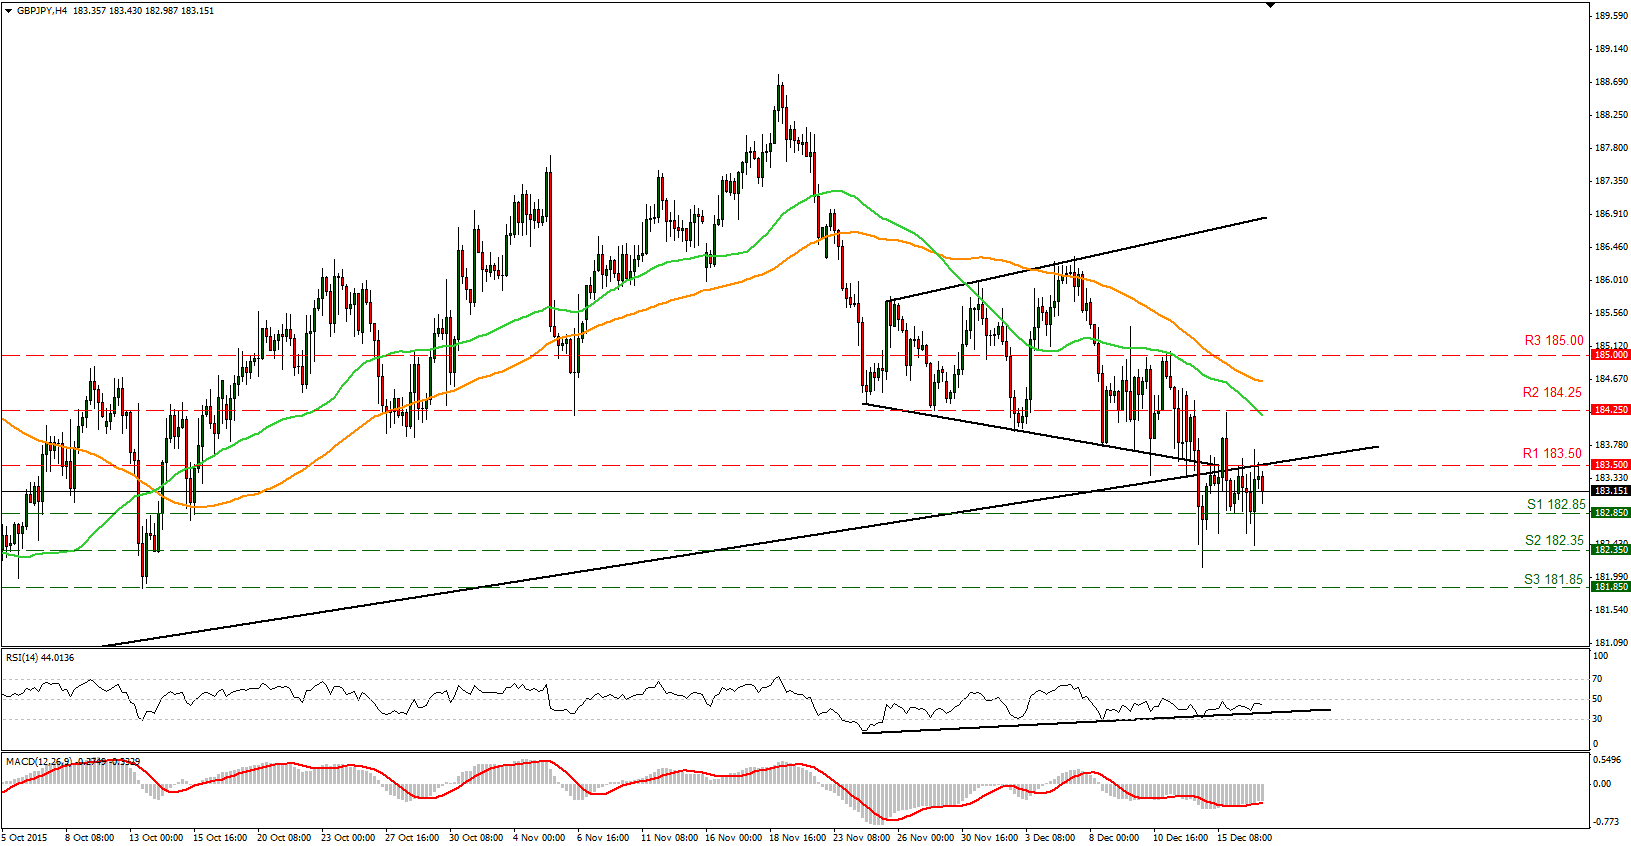
• GBP/JPY traded lower on Wednesday after hitting resistance at the crossroad of the 183.50 (R1) level and the prior black support line taken from the lows of October 2014. Given that the pair is trading below that line I believe that the medium-term bias is to the downside. A move below 182.85 (S1) is likely to initially aim for the 182.35 (S2) area, while a break below that level is possible to carry larger bearish extensions and perhaps set the stage for extensions towards the 181.85 (S3) hurdle. Looking at our oscillators, I see that the RSI found support just below its 50 line and is pointing down, while the MACD, already negative, seems willing to cross below its trigger line. These signs support my view that the pair could head lower, but to wait for a break below 182.85 (S1) to see scope for further declines. On the daily chart, as long as the pair is trading within a wide sideways range between the 180.50 and 188.50 zones, I would maintain my flat stance as far as the broader trend is concerned.
• Support: 182.85 (S1), 182.35 (S2), 181.85 (S3)
• Resistance: 183.50 (R1), 184.25 (R2), 185.00 (R3)
Gold still in the downside channel
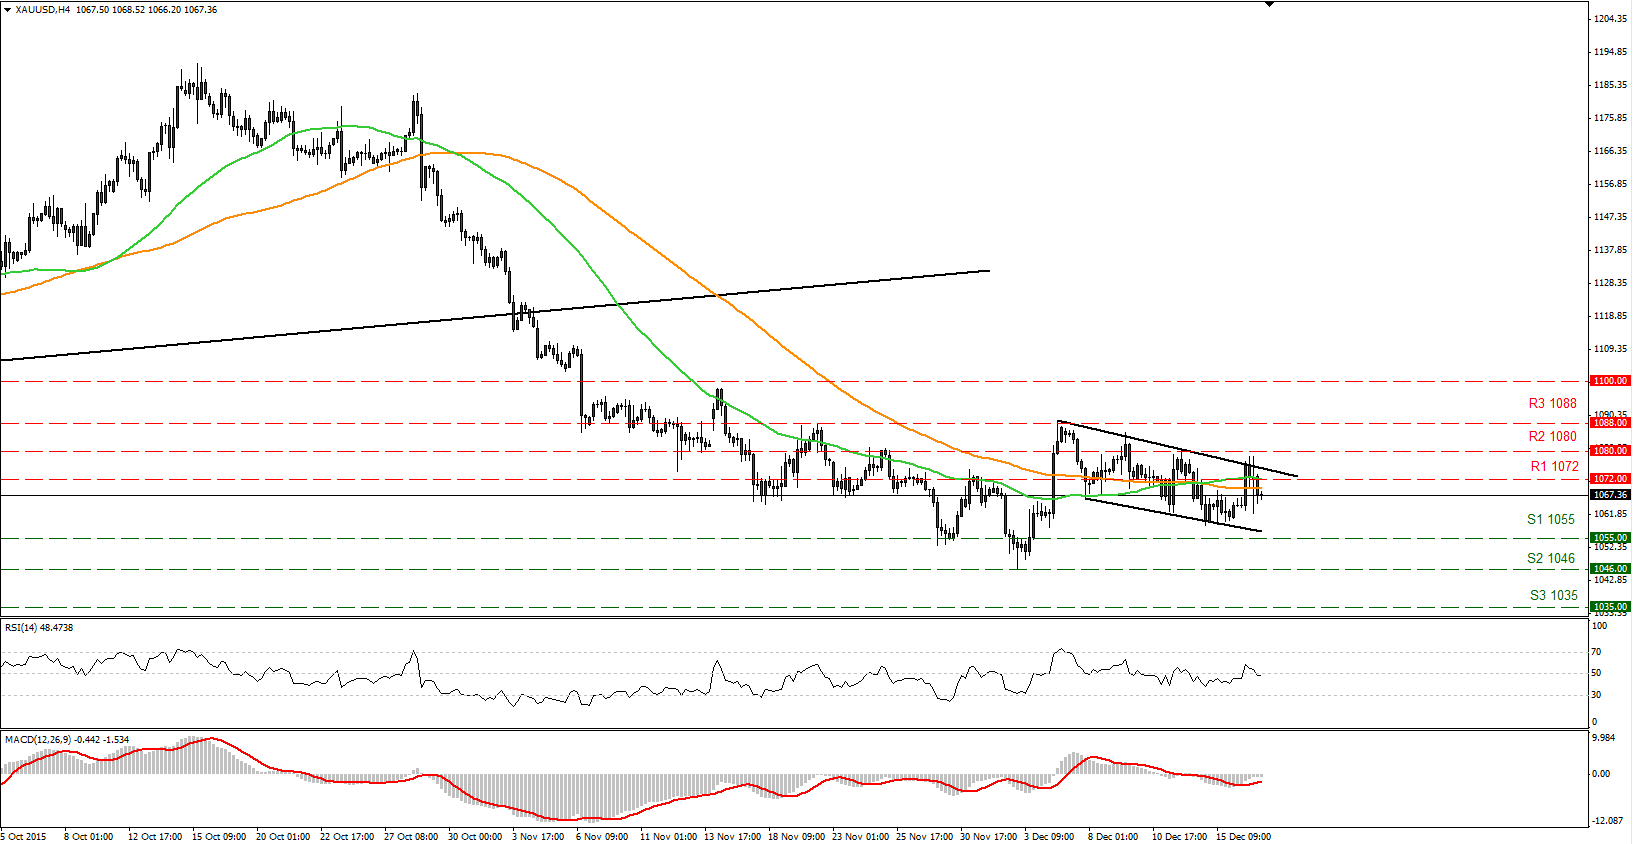
• Gold rose on Wednesday but the advance was halted at the upper boundary of the downside channel it has been trading since the 4th of December and the 1080 (R2) resistance line. Afterwards, the precious metal fell to trade again between the 1072 (R1) resistance level and the 1055 (S1) support zone. Given that there is no clear trending structure on the 4-hour chart and gold is still in that downside channel, I would prefer to adopt a neutral stance and wait for a break out from that channel to determine the near-term bias for the metal. So we have to wait and see whether the bears are strong enough to start a new attempt to push gold lower or the bulls will regain control and aim for another test of the 1080 (R2) resistance area. On the daily chart, I see that the plunge below the upside support line taken from the low of the 20th of July has shifted the medium-term outlook to the downside. As a result, I believe that the metal is poised to continue its down road in the foreseeable future and I would treat any possible extensions of it, as a corrective phase for now.
• Support: 1055 (S1), 1046 (S2), 1035 (S3)
• Resistance: 1072 (R1), 1080 (R2), 1088 (R3)
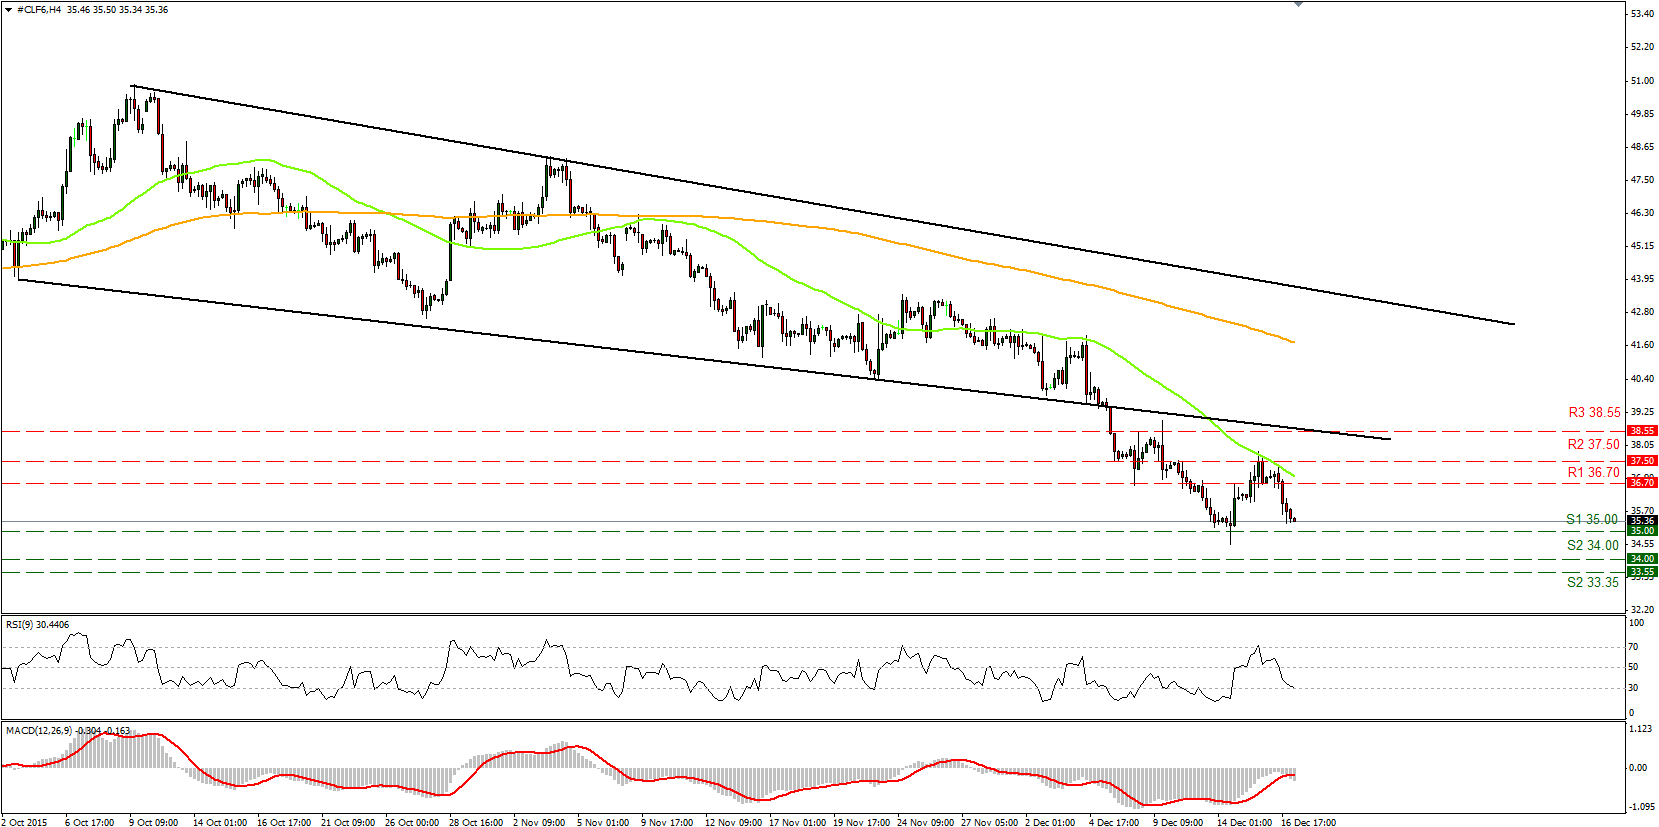
WTI slides to 35.00 again
• WTI slipped on Wednesday snapping a two-day rebound to trade again slightly above the psychological support level of 35.00 (S1). The sharp decline came after the US crude inventories unexpectedly climbed and the Fed raised rates for the first time in near a decade. A clear break below 35.00 (S1) is needed to trust further declines. I would expect a clear move below that hurdle to initially challenge the 34.00 (S2) line and a break below that hurdle is likely to pave the way for the key support zone of 33.55 (S3), last seen in February 2009. Taking a look at our oscillators though, I see the RSI found support at its 30 line, while the MACD, already negative, has crossed below its trigger line. These momentum signs support my view to wait for a clear break below 35.00 (S1) to trust another leg lower. On the daily chart, I see that WTI has been printing lower peaks and lower troughs since the 9th of October. What is more, on the 7th of December, the price fell below the lower bound of a downside channel, something that reveals accelerating downside speed and increases the possibilities for further declines and a test of the key zone of 33.55 (S3).
• Support: 35.00 (S1), 34.00 (S2), 33.55 (S3)
• Resistance: 36.70 (R1), 37.50 (R2), 38.55 (R3)

