• ECB officials hint lower interest rates. It has become almost certain that the ECB will ease further at its December monetary policy meeting, extending the size or the duration of its QE program and even lowering further the deposit rate. ECB President Mario Draghi signaled at the Bank’s latest policy meeting that they stand ready to undertake further stimulus measures to counter downside risks to the outlook for growth and inflation. The question the markets faced at that time was which of the available instruments the Bank would use. However, according to a Reuters exclusive released on Monday, the question the markets face now is not what instruments will be used, as probably a combination of all of tools will be exploited, but how much the deposit rates will be cut deeper into the negative territory. Even though when the ECB lowered the deposit rate to -0.2% last year it said that it had reached its floor and could not go any lower, the debate among the policymakers suggests that there is no bottom to the deposit rate and it could still be lowered quite sharply. As market expectations build-up for a rate cut by the ECB and a rate hike by the Fed in the same month, the monetary policy divergence is likely to put further selling pressure on the EUR/USD.
• China’s consumer prices slowed more than expected in October, while producer prices extended their decline. The soft data suggest persistent deflationary pressure in Asia’s largest economy. CPI rose 1.3% yoy in October compared with 1.6% yoy in the month before, well below market expectations of +1.5% yoy. As for the PPI, it fell 5.9% yoy at the same pace as in September, marginally below the forecasts of -5.8% yoy. The weak inflation data stress the need for further easing by the People’s Bank of China (PBoC) and leave the door open for additional stimulus by the end of the year. In such case, Australia and New Zealand, whose economies are heavily dependent on exports to China, could see their currencies gaining on the news. The advance, however, is most likely to be short-lived as the impact of the PBoC easing on AUD and NZD is becoming lesser and lesser.
• Today’s highlights: During the European day, we get the CPI data from Norway. Norway’s inflation rate is expected to have risen to 2.2% in October from 2.1% previously. In its latest policy meeting, the Norges Bank decided to leave its benchmark interest rate unchanged and noted that the weaker-than-projected NOK, along with a more expansionary fiscal policy, contributed to fueling demand for goods and serviced. Expectations of a rise in the CPI rate, are likely to confirm Norway’s central bank decision to remain on hold and this could support NOK a bit.
• In Sweden, the Riksbank releases the minutes of its latest policy meeting, when it kept its policy rate unchanged but expanded its bond purchases program. In the statement accompanying the decision, the Bank said that economic activity in Sweden is strengthening and inflation is showing a clear upward trend. However, it stressed that there is still considerable uncertainty regarding the strength of the global economy and central banks abroad are expected to pursue an expansionary monetary policy for a longer time. We will look into the minutes to get more clarification on how concerned the Bank is over these external factors and how ready it stands to ease further in the foreseeable future, in order to determine the near-term direction of SEK.
• From the US, we have the NFIB Business Optimism Index for October. Even though this indicator is not a major market mover, it is worth watching going into the December FOMC meeting because of the Fed’s emphasis on employment. Also, small businesses employ the majority of people in the US. Following the astonishing NFP figure for October, this indicator could attract more attention than usual. Wholesale inventories for September are coming out as well.
• We have three speakers on Tuesday’s agenda. ECB President Mario Draghi, Bank of England’s Deputy Governor Sir Jon Cunliffe and Chicago Fed President Charles Evans speak.
The Market
EUR/USD stays below 1.0800
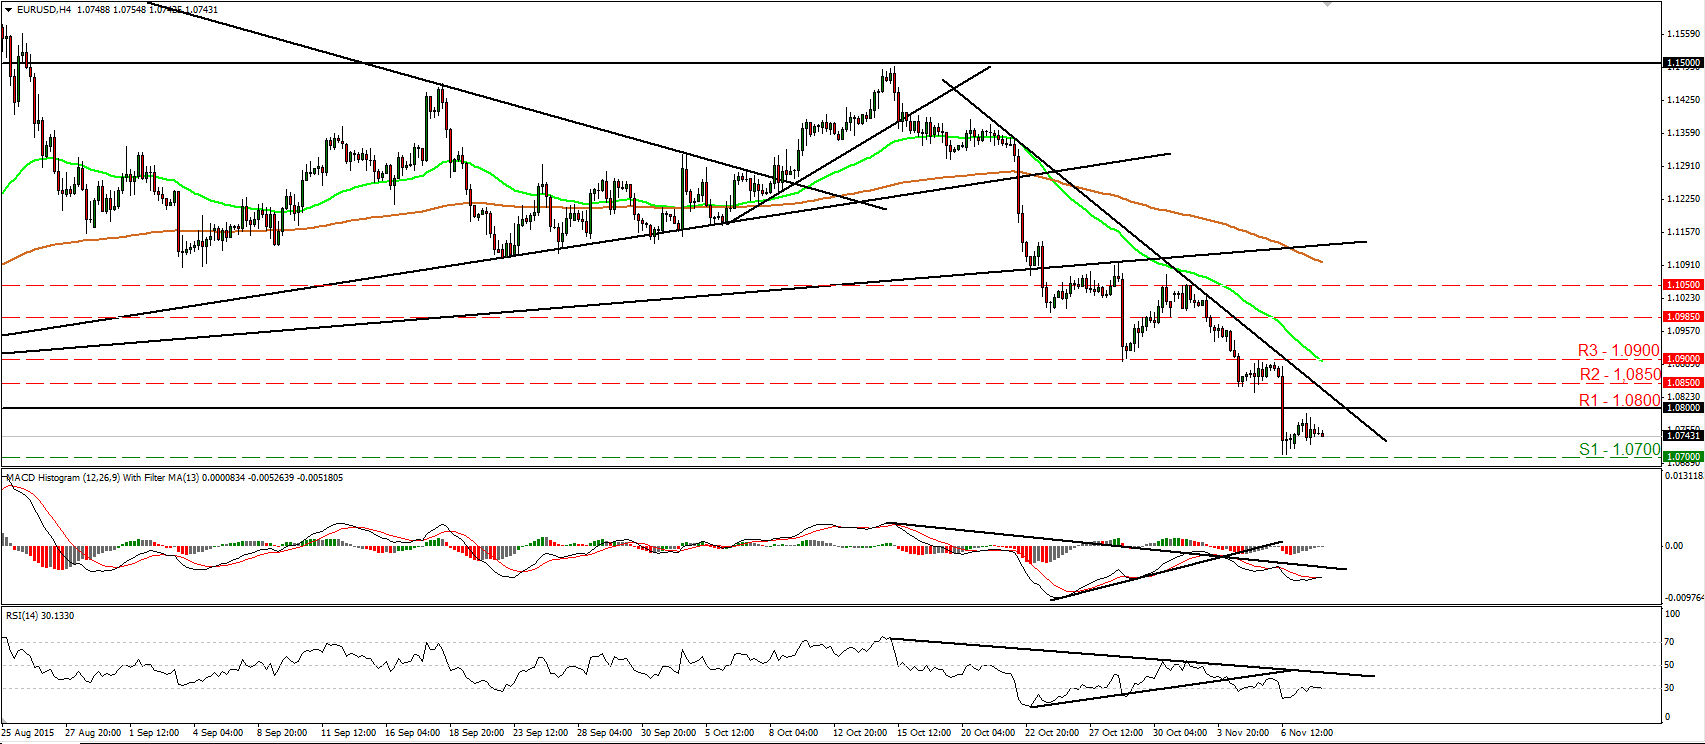
• EUR/USD traded slightly higher on Monday, but found resistance fractionally below the 1.0800 (R1) key obstacle and then it retreated again. On the 4-hour chart, as long as the pair is trading below the downtrend line taken from the peak of the 21st of October, the near-term picture remains negative in my view. As a result, I would expect a clear dip below 1.0700 (S1) to open the way for our next support of 1.0660 (S2). Our short-term oscillators detect negative momentum and support somewhat the notion. The RSI has turned down again and looks able to move back below its 30 line, while the MACD, already negative, shows signs that it could top and fall back below its trigger line. In the bigger picture, the break below the key support (turned into resistance) area of 1.0800 (R1) signaled the downside exit from the sideways range the pair had been trading since the last days of April. In my view, this has turned the longer-term outlook negative as well. • Support: 1.0700 (S1), 1.0660 (S2), 1.0625 (S3) • Resistance: 1.0800 (R1), 1.0850 (R2), 1.0900 (R3)
EUR/GBP hits resistance at 0.7155 and slides
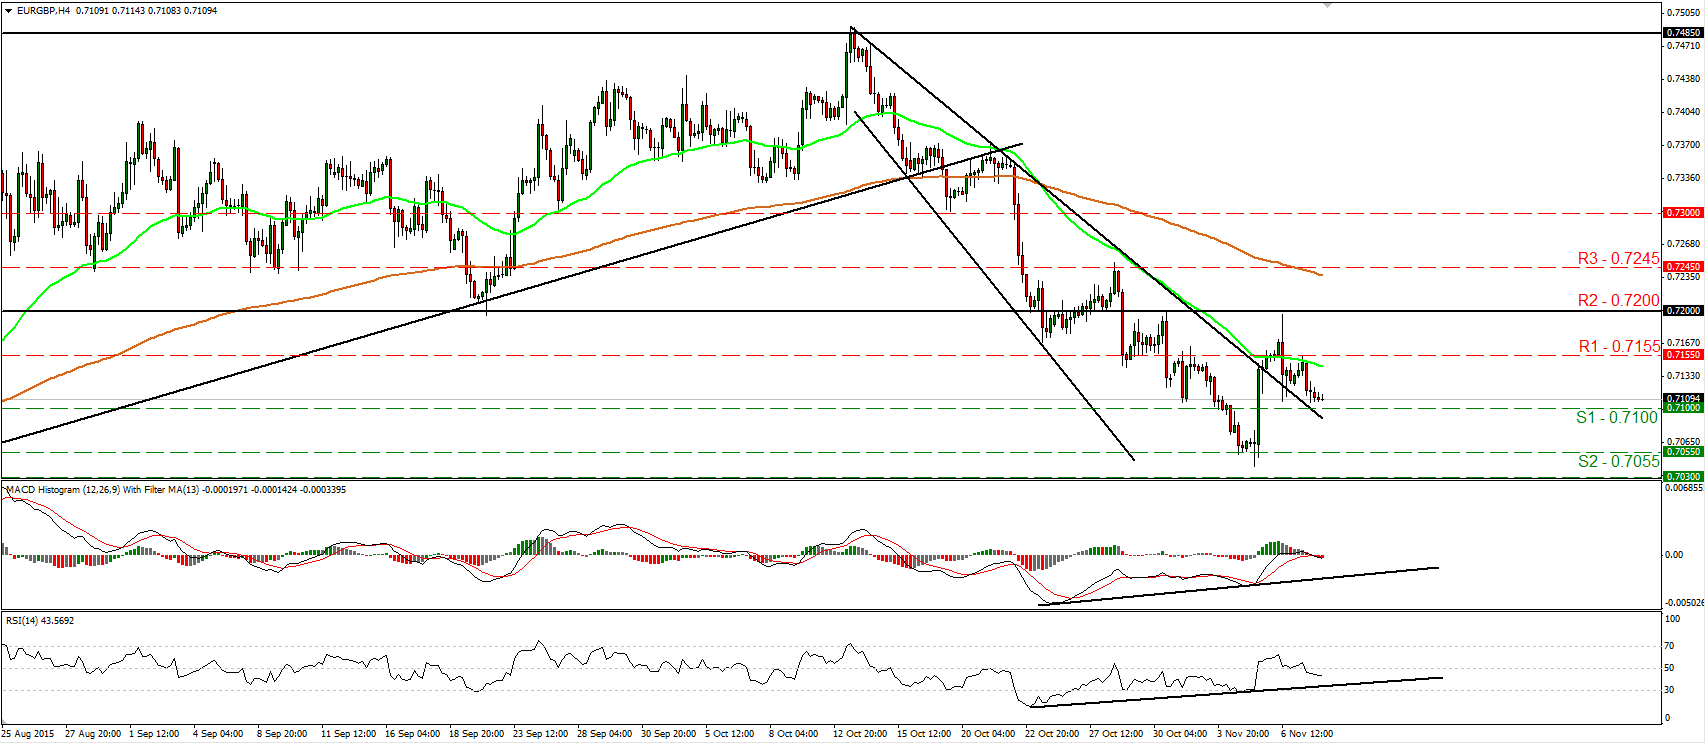
• EUR/GBP traded lower on Monday after it hit resistance at 0.7155 (R1). The rate now looks to be headed towards the 0.7100 (S1) level, where a clear dip could set the stage for more bearish extensions, perhaps towards our next support barrier of 0.7055 (S2). Our short-term oscillators reveal downside momentum and corroborate the view that the pair is likely to trade lower in the short run. The RSI fell below its 50 line, while the MACD, has topped and fallen below both its zero and signal lines. My only concern is that there is still positive divergence between both these indicators and the price action. Switching to the daily chart, I see that the dip below the 0.7200 (R2) hurdle on the 28th of October has confirmed the negative divergence between the daily oscillators and the price action, and has also turned the longer-term outlook back negative. This increases the possibilities for EUR/GBP to continue trading lower in the not-to-distant future. • Support: 0.7100 (S1), 0.7055 (S2), 0.7030 (S3) • Resistance: 0.7155 (R1), 0.7200 (R2), 0.7245 (R3)
AUD/USD trades in a consolidative manner
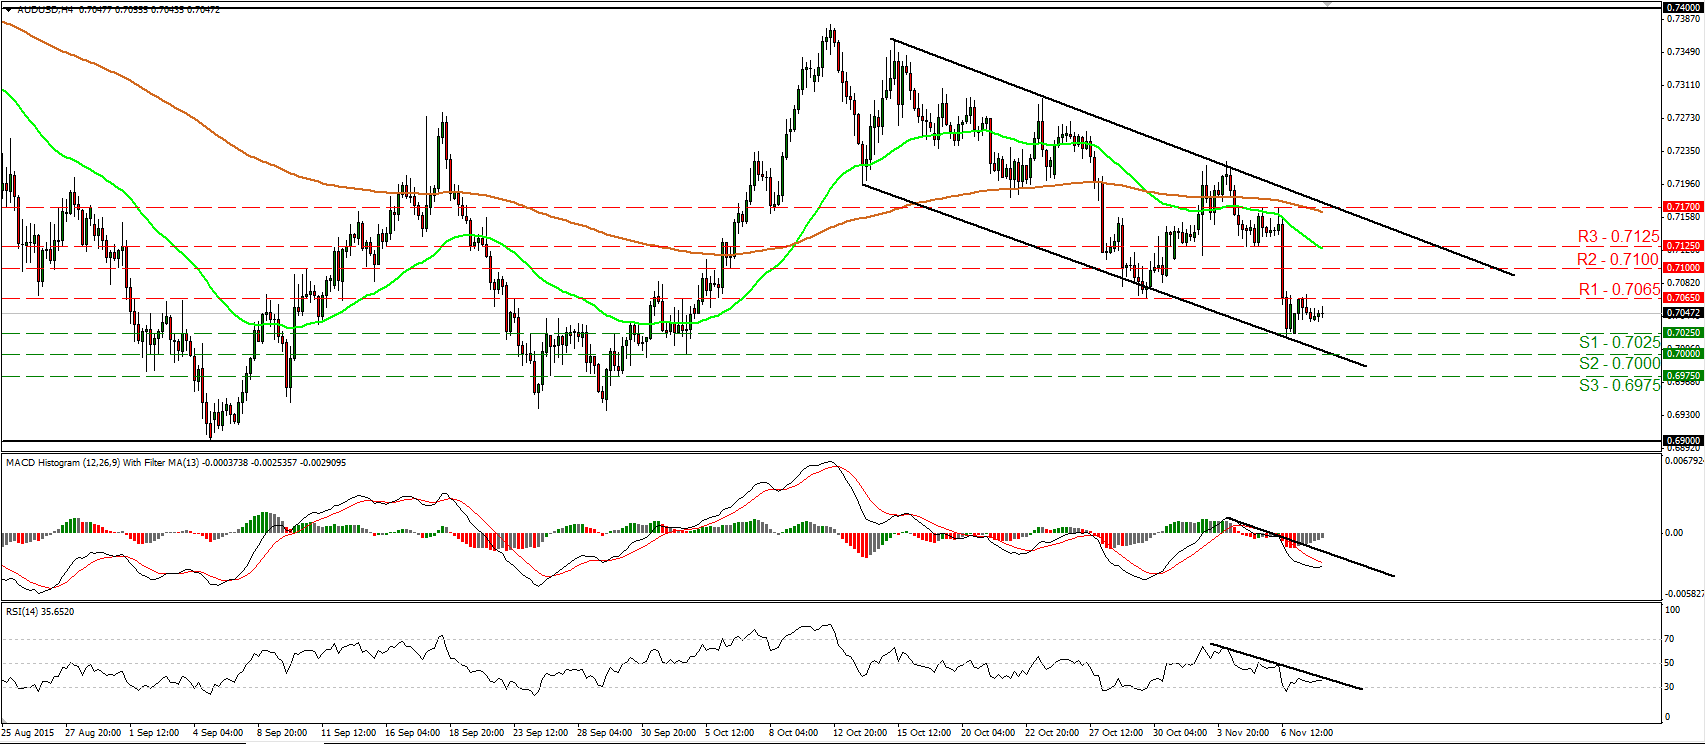
• AUD/USD moved in a consolidative manner yesterday, staying below the resistance barrier of 0.7065 (R1). The pair has been trading within a downside channel since the 14th of October and this keeps the short-term outlook negative in my view. I believe that sellers will eventually seize control and drive the battle below 0.7025 (S1), perhaps to challenge the psychological obstacle of 0.7000 (S2). Our momentum studies stand within their bearish territories and below their respective downside resistance lines, supporting the near-term negative outlook. Nevertheless, the RSI edged somewhat higher after hitting its 30 line, while the MACD shows signs of bottoming and it could cross above its trigger line soon. Bearing these signs in mind and given our proximity to the lower bound of the aforementioned channel, I cannot rule out an upside corrective move before the next bearish leg, perhaps even above 0.7065 (R1). On the daily chart, I see that AUD/USD still oscillates between 0.6900 and 0.7400 since mid-July. As a result, although the pair could trade lower in the short run, I would hold a flat stance for now as far as the broader trend is concerned. • Support: 0.7025 (S1), 0.7000 (S2), 0.6975 (S3) • Resistance: 0.7065 (R1), 0.7100 (R2), 0.7125 (R3)
Gold looks ready to correct a bit higher
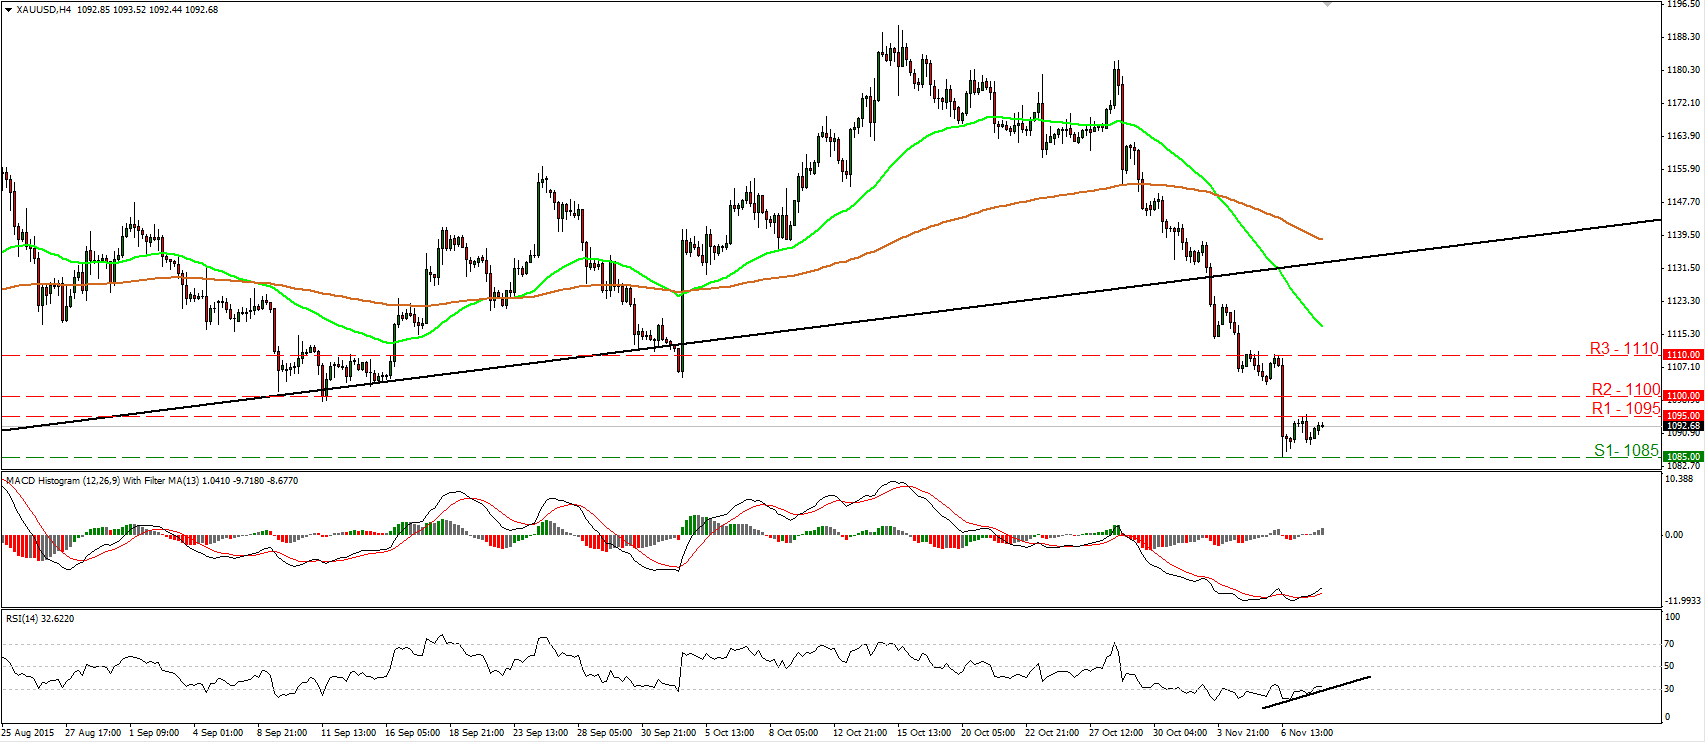
• Gold traded slightly lower after it hit resistance at 1095 (R1). However, the metal turned up again, and today during the early European morning, it is headed for another test at 1095 (R1). The short-term trend is still negative in my view and therefore, I would expect the bears to take control again at some point and push the price for another test at 1085 (S1). A move below 1085 (S1) could aim for our next support of 1080 (S2). Nevertheless, looking at our short-term oscillators, I see signs for further upside corrective rebound before sellers decide to shoot again, perhaps to challenge the 1100 (R2) zone as a resistance this time. The RSI edged higher and exited its below-30 territory, while the MACD has bottomed and crossed above its trigger line. On the daily chart, the plunge below the upside support line taken from the low of the 20th of July has shifted the medium-term outlook to the downside. As a result, I would treat any further short-term advances as a corrective move for now. I believe that the metal is poised to trade lower in the foreseeable future. Support: 1085 (S1), 1080 (S2), 1072 (S3) • Resistance: 1095 (R1), 1100 (R2), 1110 (R3)
WTI tries to break below 44.00
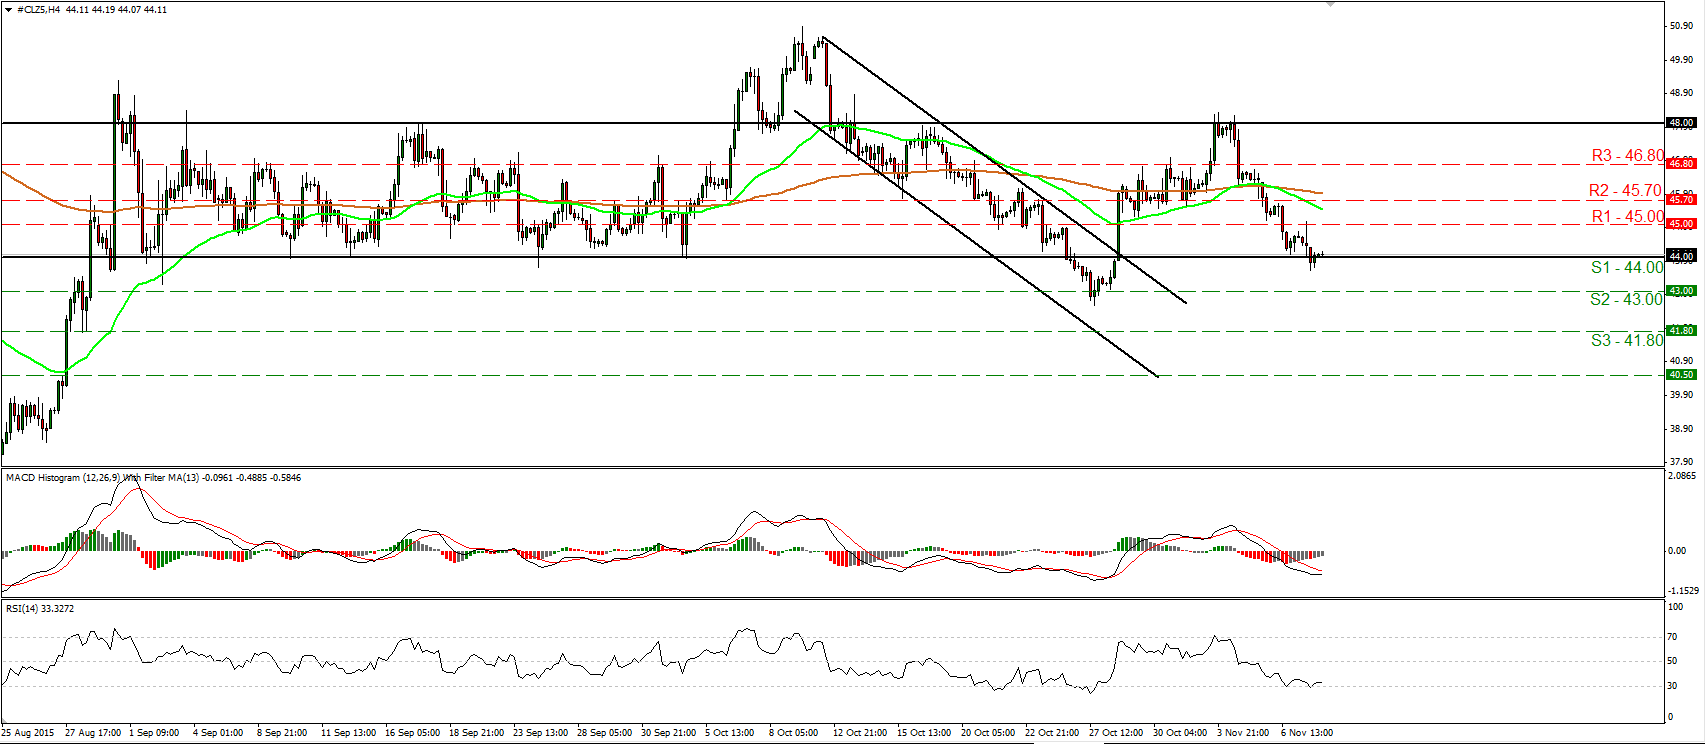
• WTI tried to break below the 44.00 (S1) barrier, but it rebounded to trade marginally above it. The price is still trading between the key obstacles of 48.00 and 44.00 (S1) and as a result I would consider the short-term outlook to be neutral for now. I prefer to see another attempt below 44.00 (S1) before I get confident on further declines. Such a move is likely to aim for our next support zone of 43.00 (S2). Taking a look at our short-term oscillators though, I see that a corrective bounce could be looming before and if the bears decide to shoot again. The RSI rebounded twice from its 30 line, while the MACD shows signs of bottoming and could move above its trigger soon. On the daily chart, WTI printed a lower high on the 3rd of November but given that it is still trading above the 44.00 (S1) area, I would keep a flat stance as far as the longer-term outlook is concerned as well. • Support: 44.00 (S1), 43.00 (S2), 41.80 (S3) • Resistance: 45.00 (R1), 45.70 (R2), 46.80 (R3)

