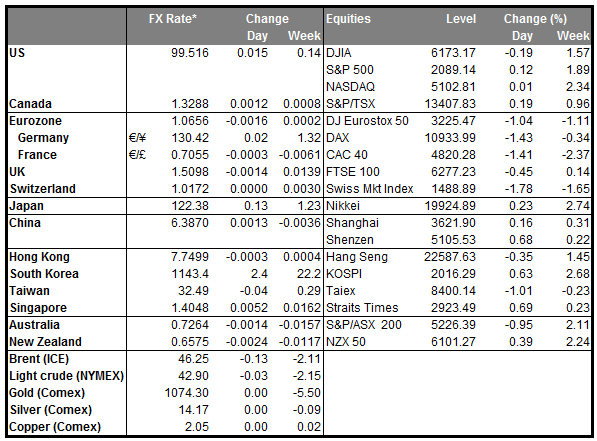
• Early accidental release shows US consumption accelerated Personal spending picked up in November, indicating that consumers boosted the largest part of the US economy heading into the final quarter of the year. Spending rose by 0.3% mom from a downwardly revised 0.0% mom in October, according to an early release of the data. Following a downward revision of the final US Q3 GDP data yesterday, the solid consumption figure suggests that household expenditure is being powered by improvements in the labour market and lower energy prices. Moreover, November’s spending increase could result in a moderate improvement in Q4 growth rate. USD reaction was limited on the news. However, as the Fed has stressed that the pace of the tightening cycle will be ‘data driven’, an accelerating consumption provides signs of upward inflationary pressure. This is positive news overall for the US and dollar could regain some of its recent losses.
• Today’s highlights: In the UK, the final estimate of Q3 GDP data is expected to confirm the 2nd estimate and show that the economy grew 0.5% qoq a slowdown from +0.7% qoq in Q2. The overall slowdown in Q3 compared to Q2 was primarily owed to weakness in the construction and manufacturing sectors. Since then, the two sectors have recovered somewhat, however this will not be reflected in Q3 data. Thus, the market reaction might be muted at this release, especially since expectations are for a confirmation of the 2nd estimate.
• From Norway, the AKU unemployment rate for October is expected to have remained unchanged. The official unemployment rate for the same month was also unchanged, which increases the likelihood for another flat reading. Thus the reaction on NOK could be muted at the release.
• From the US, we get durable goods orders as well as personal income, all for November. The durable goods orders headline figure is expected to have fallen, a turnaround from the month before, while durable goods excluding transportation equipment are forecast to have remained flat. The focus is usually on the core figure and the expected stagnation could cause the dollar to trade somewhat lower. Personal income is expected to have slowed, and since the personal spending figure released earlier was expected to offset the negative impact on the dollar by the other releases, strong data are now needed to prevent a tumble of USD. If personal income indeed decelerates, this discrepancy could be explained by the lower oil prices. As oil becomes cheaper, consumers have more disposable income to spend and this might increase the overall demand. The U o M final consumer sentiment for December and new homes sales for November are both expected to have increased. Following the disappointing existing home sales for the same month yesterday, a solid reading from new home sales is required in order to restore the confidence in the US housing market. The core PCE rate for November is also due to be released, but no forecast is currently available.
• From Canada, we get the monthly GDP data and retail sales figure, both for October. Even though the data is outdated, both indicators are expected to show a rebound from the previous month. This may ease some of the downward pressure on loonie, at least temporarily.
• There are no speakers scheduled on Wednesday’s agenda.
The Market
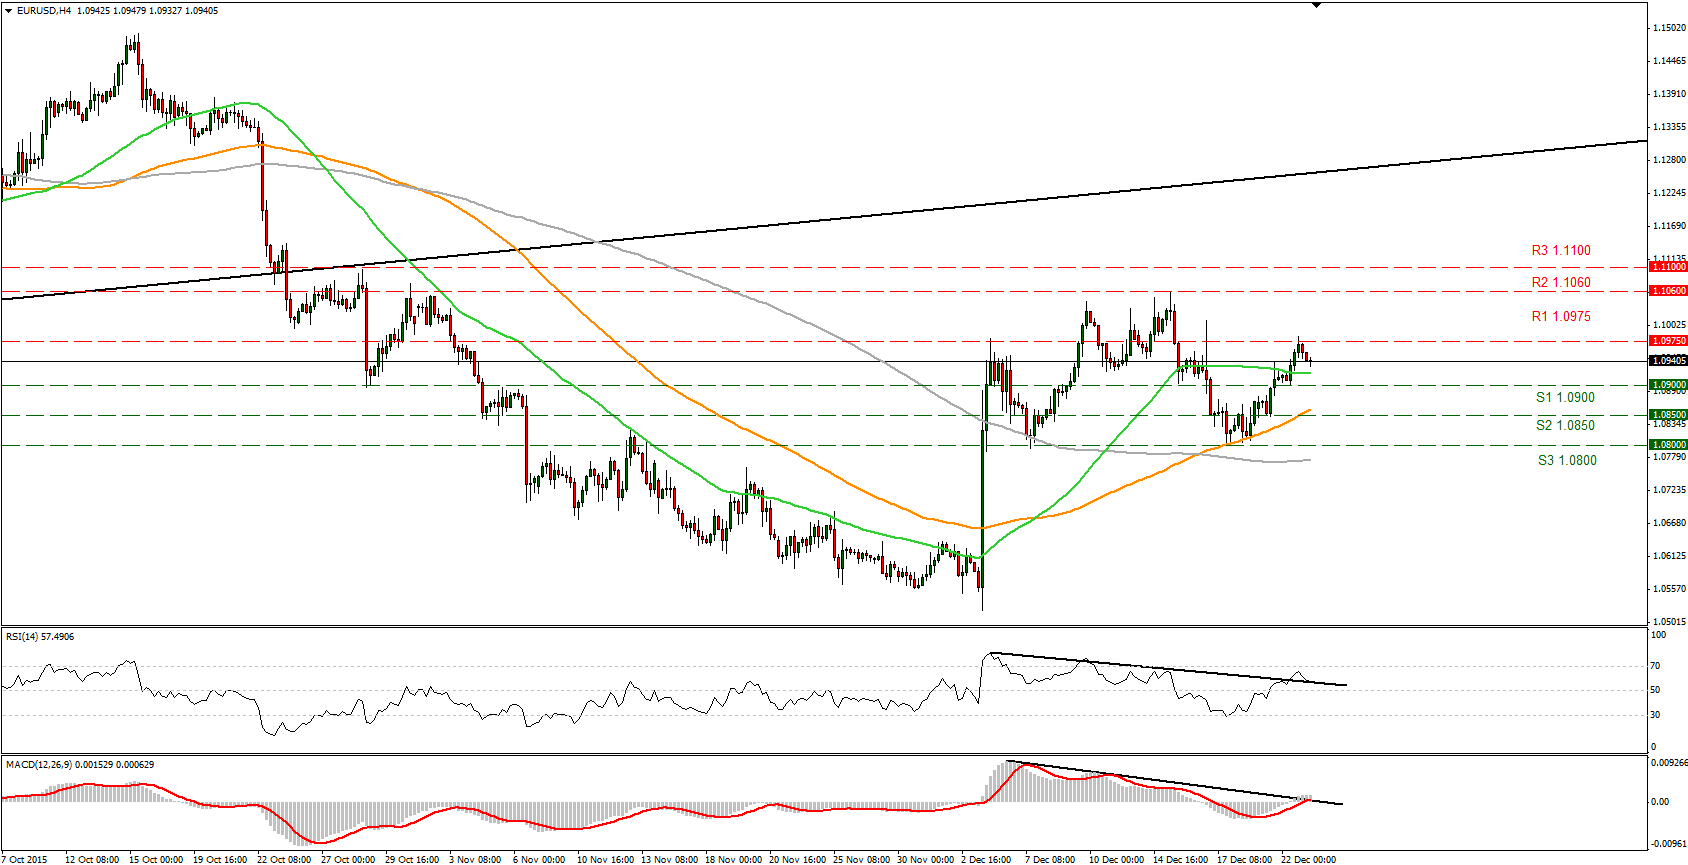
EUR/USD touches our 1.0975 resistance
• EUR/USD moved higher on Tuesday but found resistance at the 1.0975 (R1) level. Given that the pair is still trading above the 1.0900 (S1) support hurdle, the near-term bias is to the upside, in my view. If the bulls prove strong enough and overcome the 1.0975 (R1) territory, they could push the rate higher, perhaps towards our next resistance at 1.1060 (R2). Looking at our short-term oscillators, the RSI found resistance near 70 and declined, while the MACD, although above its zero and trigger lines, it shows signs of topping just above zero. These momentum signs support the case for a minor pullback before the next leg higher. However, the thin market liquidity could push the prices sharply in either direction on not very much at all. As for the broader trend, given the inability of the pair to break the 1.0800 (S3) barrier, the lower bound of the range it had been trading from the last days of April until the 6th of November, I would maintain my neutral stance.
• Support: 1.0900 (S1), 1.0850 (S2), 1.0800 (S3)
• Resistance: 1.0975 (R1), 1.1060 (R2), 1.1100 (R3)
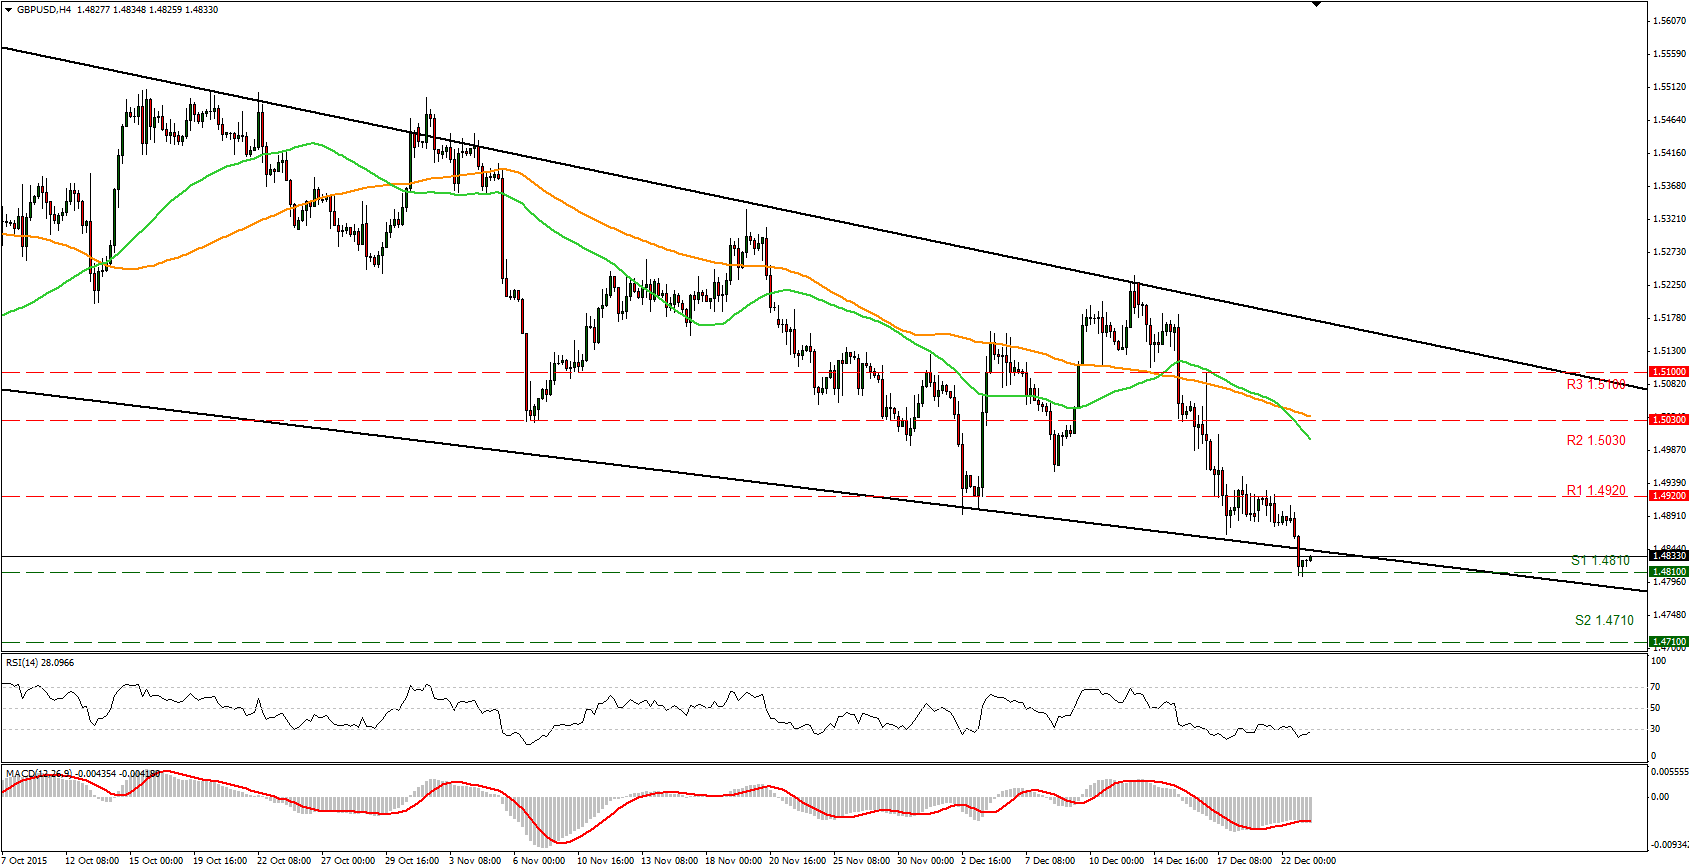
GBP/USD finds support near 1.4810
• GBP/USD fell sharply on Tuesday, breaking below the lower boundary of the downside channel it had being trading since the 7th of December. The move was halted near the 1.4810 (S1) support level, and currently, during the early European morning trading hours the pair seems willing to advance and re-enter the aforementioned channel. Our short-term momentum signs support the case for an advance. The RSI made an attempt to move above its 30 line again and is pointing up, while the MACD, although in its negative territory, stands above its trigger line and shows signs it could move higher. As for the broader trend, the dip below 1.4900 signaled a lower low on the daily chart, which keeps the long-term bias to the downside, in my view. As a result, I would treat any near-term advances as a correction of the longer-term downtrend.
• Support: 1.4810 (S1), 1.4710 (S2), 1.4640 (S3)
• Resistance: 1.4920 (R1), 1.5030 (R2), 1.5100 (R3)
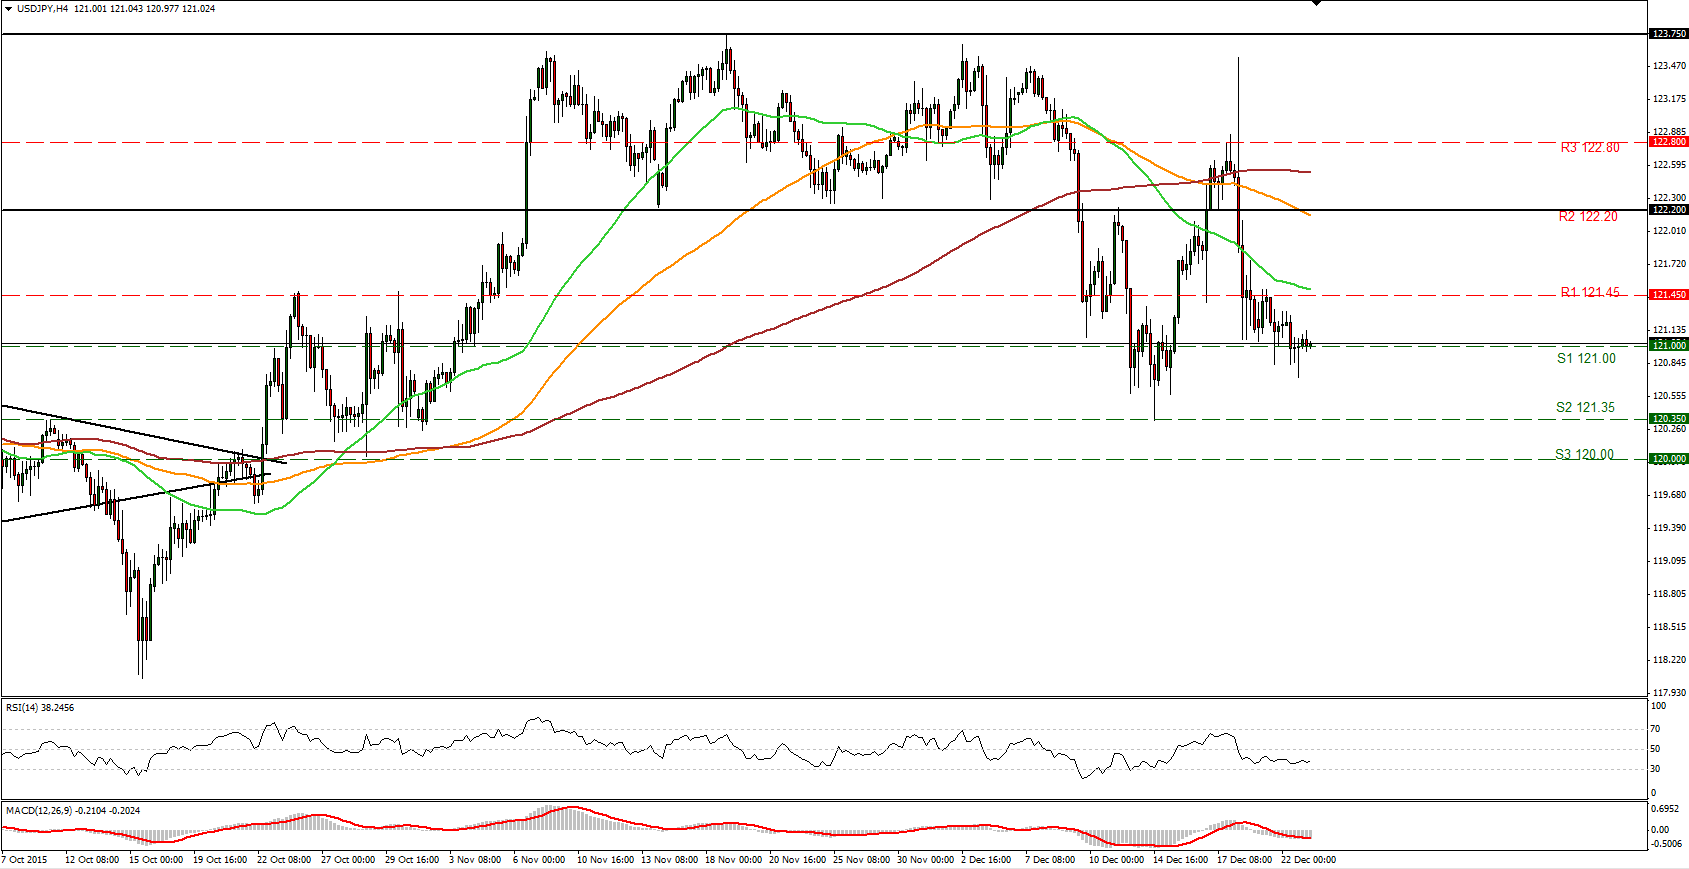
USD/JPY just above 121.00
• USD/JPY tumbled on Tuesday and made another attempt to close below the round support figure of 121.00 (S1). None of them however found much strength and the pair stayed fractionally above that hurdle. During the early European trading session Wednesday, the rate seems willing to challenge again the 121.00 (S1) support zone. A break below that level could carry larger bearish implications and open the way for the next support at 120.35 (S2). Looking at our short-term momentum signs, the RSI lies just above 30 pointing sideways, while the MACD stands between its trigger and zero lines in its negative territory. These momentum signs are more or less neutral with no clear trending direction. As a result, I prefer to see a clear break below 121.00 (S1) to trust further declines. As for the broader trend, the break below the 122.20 (R2) resistance zone, the lower boundary of the sideways range the pair has been trading since the 6th of November, keeps the bias to the downside, in my view. As such, any moves that remain limited below that level, I would treat them as corrections.
• Support: 121.00 (S1), 121.35 (S2), 120.00 (S3)
• Resistance: 121.45 (R1), 122.20 (R2), 122.80 (R3)
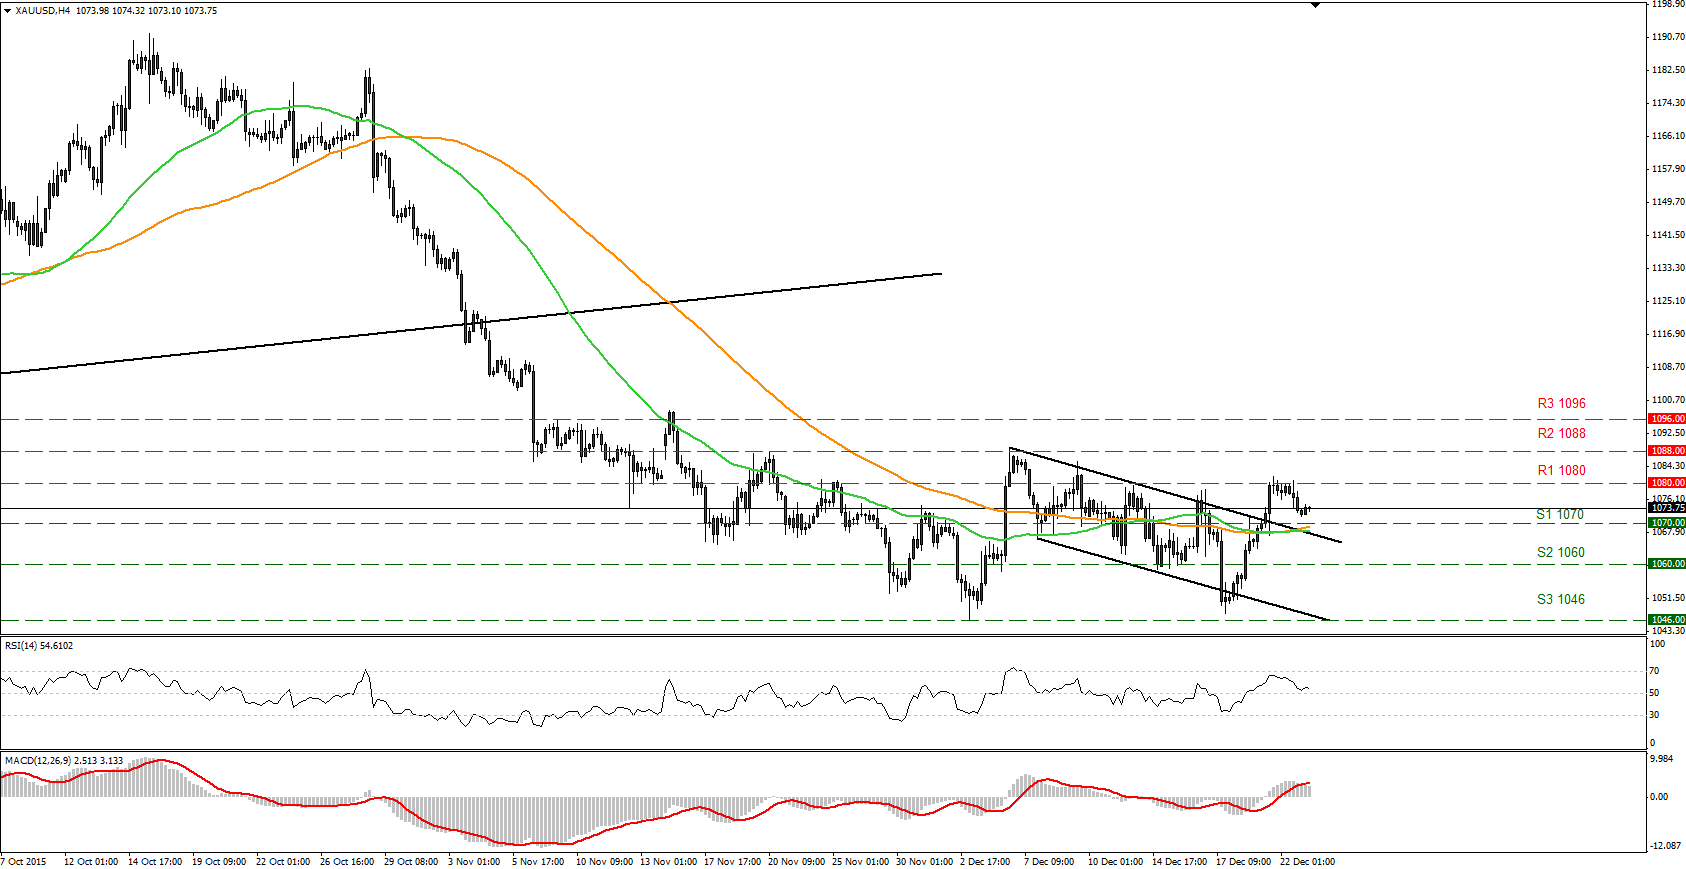
Gold breaks the upper boundary of the channel
• Gold remained locked in a consolidation mode on Tuesday, staying between the 1080 (R1) resistance zone and the 1070 (S1) support area. A break in either direction is likely to determine the forthcoming near-term bias. Although on Monday the precious metal broke above the downside channel it had been trading since the 4th of December, I believe that the short-term picture favor further pullback. A break below the 1070 (S1), could carry larger bearish implications and challenge our next support of 1060 (S2). Looking at our short-term momentum signs, the RSI found resistance at its 70 level and points down, while the MACD, has topped and crossed below its trigger line. These momentum signs point to a pullback before the bulls take control again. As for the broader trend, a break above 1088 (R2) resistance line is needed to print a higher high on the daily chart and shift the medium-term outlook to the upside. As a result, I would prefer to wait for a break above the aforementioned level to trust further advances.
• Support: 1070 (S1), 1060 (S2), 1046 (S3)
• Resistance: 1080 (R1), 1088 (R2), 1096 (R3)
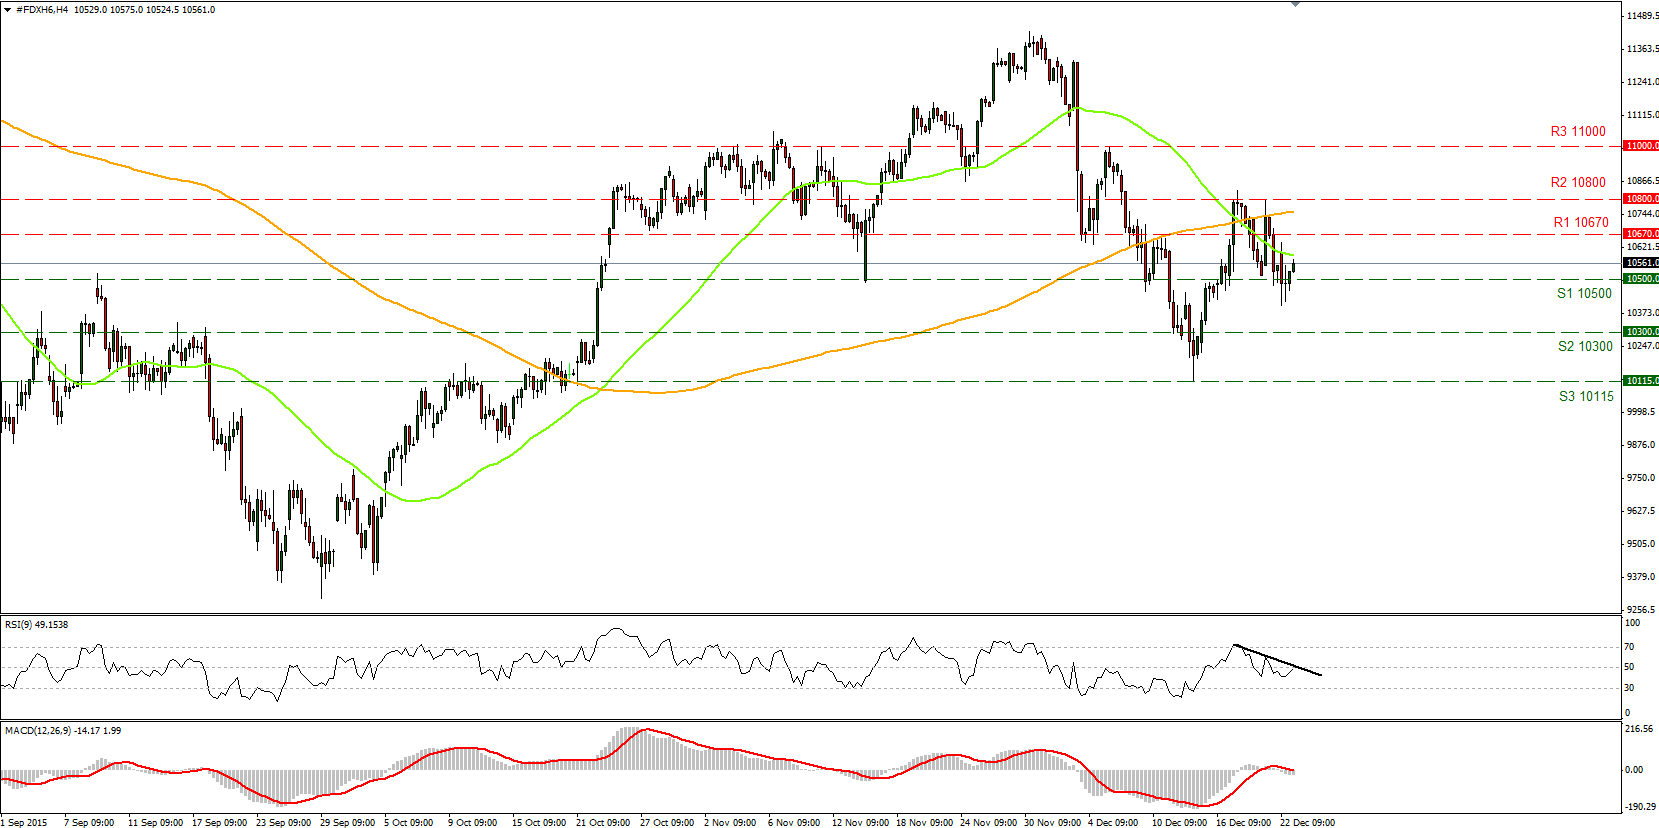
DAX futures rise above the 10500 zone
• DAX futures rose yesterday and moved again above the psychological zone of 10500 (S1). The move was halted however around the 50-period moving average. Even though the price structure on the 4-hour chart still points to a downtrend, I believe that the move above the 10500 (S1) barrier could trigger larger bullish extensions. Something that is likely to initially aim our next resistance at 10670 (R1). Our momentum studies however are mixed and amplify the case to take a wait-and-see stance for now. The RSI is just below its 50 level and seems willing to cross above it, while the MACD, already below its trigger line moves along its zero level. I can also detect negative divergence between the RSI and the price action. As for the broader trend, the price structure still points to a downtrend, but I prefer to see a close below 10115 (S3) to trust that the medium-term outlook is back to the downside.
• Support: 10300 (S1), 10115 (S2), 10000 (S3)
• Resistance: 10500 (R1), 10670 (R2), 10930 (R3)

