• FOMC meeting: Is a hike this year still on the table? At their last meeting, Fed officials decided to remain on hold, as the market had expected, but surprised investors with a very dovish outlook. They lowered their inflation forecasts and lowered their median forecasts for end-year Fed funds by 25 bps for end-2015, 2016 and 2017. Moreover, they do not see core inflation moving back up to their 2% target until 2018, which means probably that even when they do start hiking rates, they will only hike slowly and perhaps stop at a lower rate than expected. What is more, the Committee did discuss the idea of hiking rates at this meeting, but decided not to because of global factors.
• With no press conference scheduled or new forecast available today, the focus will be on the statement accompanying the decision. Even though there is a minor chance of a hike, we would expect the Committee to remain on hold and wait for signs of further improvement in the data before risking a lift-off. Indeed, global economic and financial developments have stabilized since the last meeting and therefore, they should become less of a risk. This will turn the policy emphasis back on the domestic data moving into the December meeting. We also expect the statement to acknowledge the latest weakness in job growth but this might be downplayed again as several Fed speakers did recently. A key point to watch will be on whether any other members join Fed’s Lacker in voting to raise rates, as this would readjust expectations of a December hike and could support the USD. The September meeting showed that 13 out of the 17 members expected a rate hike this year, given continued solid economic growth and further improvement in the labor data.
• After the conclusion of the FOMC meeting and given that Fed officials remain on hold, we will look closely to the minutes of this meeting and on any Fed speakers on the road to December for more insights about officials’ view about the timing of the first hike. Recent comments from Fed officials have highlighted the divergence in views between the Committee members. Fed’s Brainard and Tarullo said that they don’t see a rate hike coming before next year, while Vice Chairman Fischer, Lockhart and Williams shared the view for a hike this year, on the assumption of continued solid economic growth and further improvement in the labor market. The divergence between Fed officials is the reason we believe that the statement should lay the groundwork for the Committee to communicate more clearly on the timing of the first hike.
• Besides the Fed, two more central banks hold their policy meetings: the RBNZ and the Riksbank. Although we don’t expect any action from the Fed, we have a different opinion as far as the Riksbank and the RBNZ meetings are concerned. The Riksbank decided to leave policy unchanged at its latest meeting and noted that the expansionary monetary policy is supporting the continued positive development of the Swedish economy so that inflation can be expected to be close to 2% next year. With an economy running in line with the Riksbank’s forecasts, there should be no need for further stimulus. However, as Sweden’s neighbors keep a softer tone, also the ECB left the door open even for further deposit rate cut, and having in mind the current concerns over global growth, we see a high possibility for further action today, either additional QE or a rate cut.
• The Reserve Bank of New Zealand is expected by most forecasters to keep its cash rate unchanged at 2.75% but a minority of economists, including us, believe that another 25 bps cut could be in the works. At their last meeting, the Bank cut rates by 25 bps and Gov. Graeme Wheeler recently said that “further easing seems likely, but this will continue to depend on the emerging flow of economic data.” Since then, inflation rose a bit but still lies well below the Bank’s target range of 1%-3%. In addition, China’s slowdown keeps inflationary pressures in NZ weak and could prompt the RBNZ to act again. The recent appreciation of NZD may also be a reason of concern for the Bank. Given RBNZ’s preference of a lower exchange rate and the risk of an appreciation if they remain on hold, they may want to downplay their currency in case they keep rates unchanged.
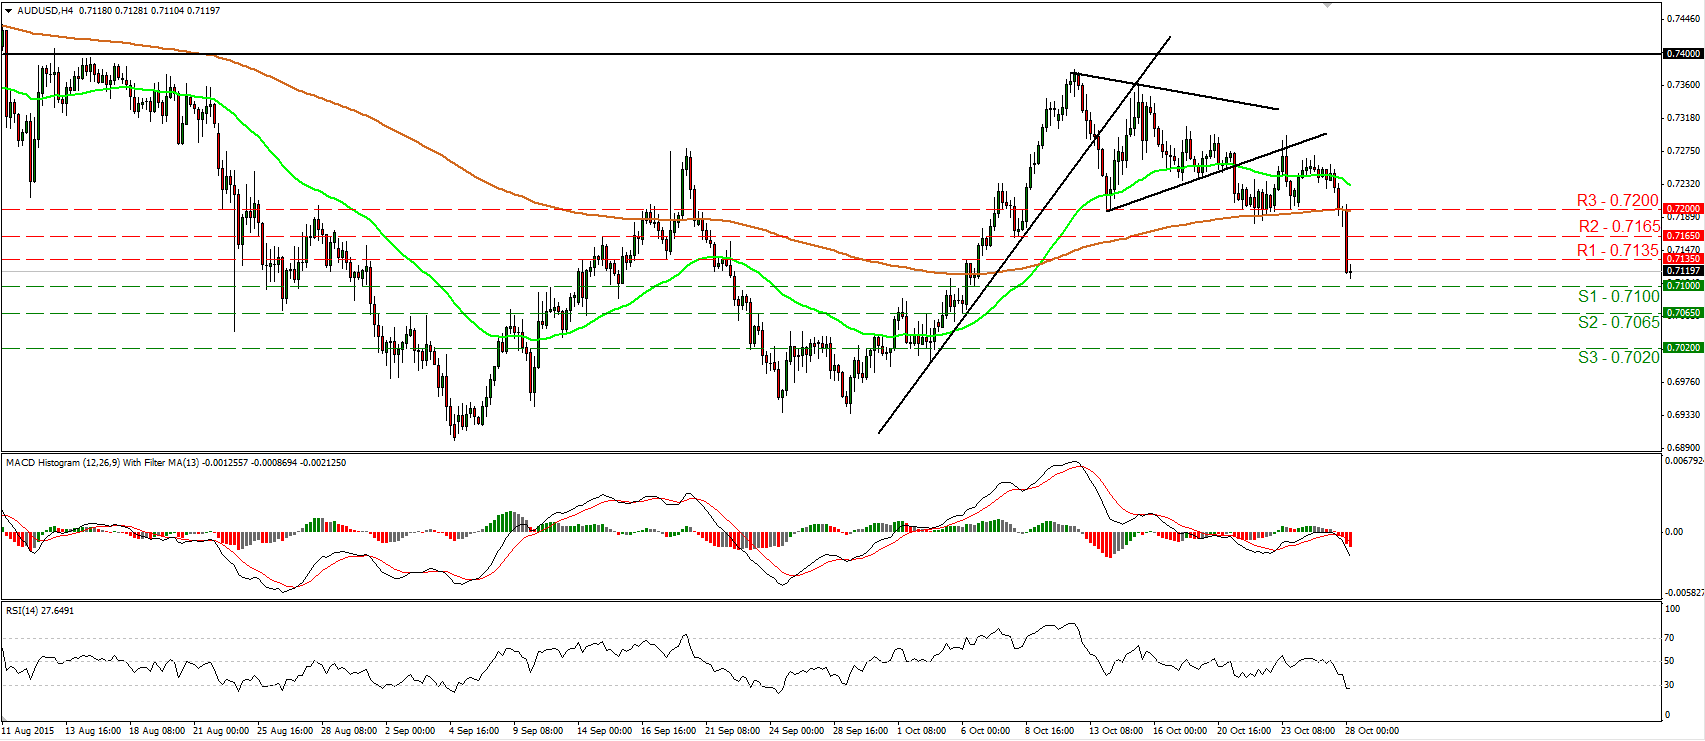
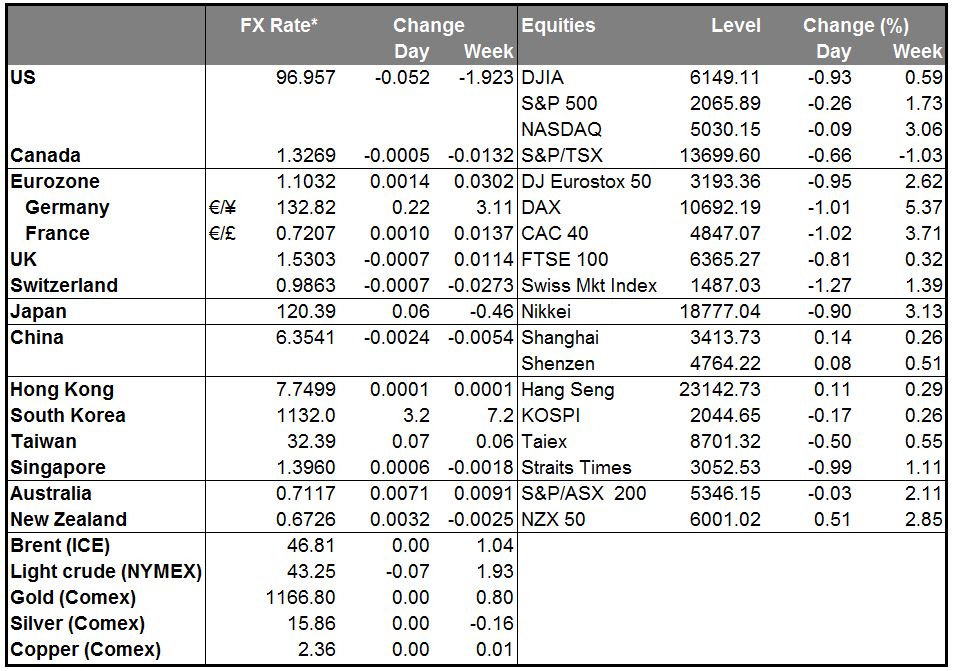
• Overnight, Australia’s Q3 CPI unexpectedly weakened, raising the likelihood for another rate cut this year by the Reserve Bank of Australia. The Australian dollar, which already was below 0.7200 against the dollar ahead of the CPI data, fell sharply to find support slightly above our 0.7100 support zone. The weaker-than-expected data following the recent lift in mortgage rates by Australia’s biggest lenders, make the November and December meetings live in our view. As such, we could see AUD/USD drifting lower in the not-to-distant future.
• As for today’s indicators: Norway’s AKU unemployment rate for August and the country’s retail sales for September are coming out. An increase in the AKU unemployment rate and a soft retail sales reading could weaken NOK a bit.
• We have four speakers scheduled on Wednesday. During the Asian morning, ECB Board Member Benoit Coeure speaks. As for the European day, ECB Executive Board member Peter Praet speaks at a panel discussion. The UK Prime Minister David Cameron speaks in parliament, while the Former Fed Chairman Ben Bernanke speaks at London School of Economics on his new book.
The Market
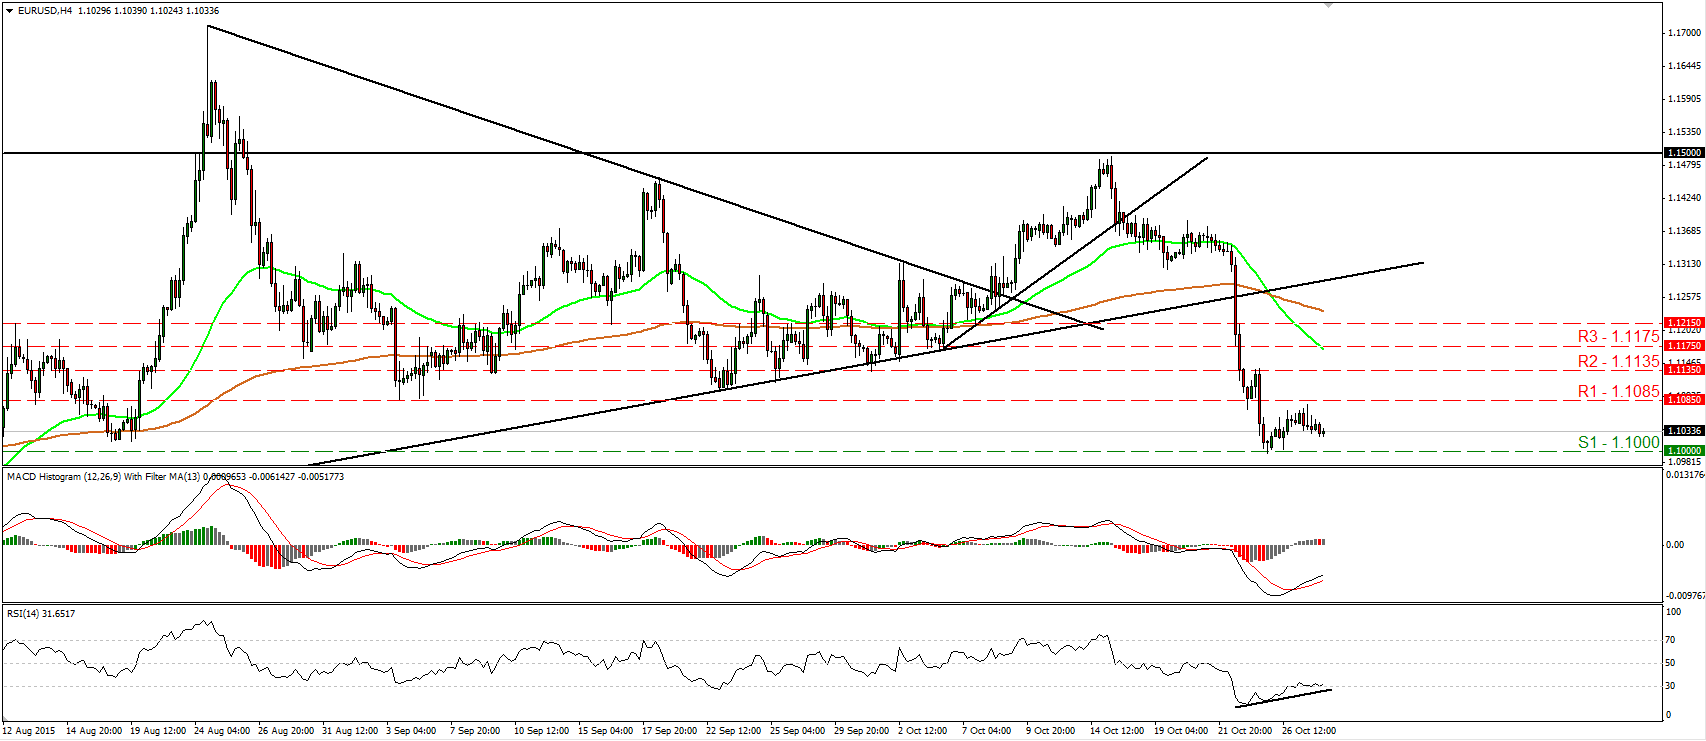
EUR/USD hits resistance near 1.1085 and turns down ahead of the FOMC meeting
• EUR/USD found resistance fractionally below the 1.1085 (R1) resistance line and turned down. The price structure on the 4-hour chart still suggests a short-term downtrend, but I prefer to see a clear move below the psychological figure of 1.1000 (S1) before I get confident again on the downside. Such a break would confirm a forthcoming lower low on the 4-hour chart and is likely to initially aim for our next support at 1.0950 (S2). The RSI still stands above its 30 line and moves sideways, while the MACD, although negative, stands above its trigger line and points north. These momentum signs is another reason I prefer to wait for a move below 1.1000 (S1) before trusting the short-term downtrend. Today, the FOMC ends its two day policy meeting and all eyes will be on whether Fed officials are confident in raising interest rates in December. This could be the catalyst for the aforementioned break below 1.1000 (S1). In the bigger picture, as long as EUR/USD is trading between the 1.0800 key support and the psychological zone of 1.1500, I would maintain my neutral stance as far as the overall picture is concerned. I would like to see a clear break below the 1.0800 hurdle before assuming that the longer-term trend is back to the downside. On the upside, another move above 1.1500 is needed to turn the overall outlook positive.
• Support: 1.1000 (S1), 1.0950 (S2), 1.0850 (S3)
• Resistance: 1.1085 (R1), 1.1135 (R2), 1.1175 (R3)
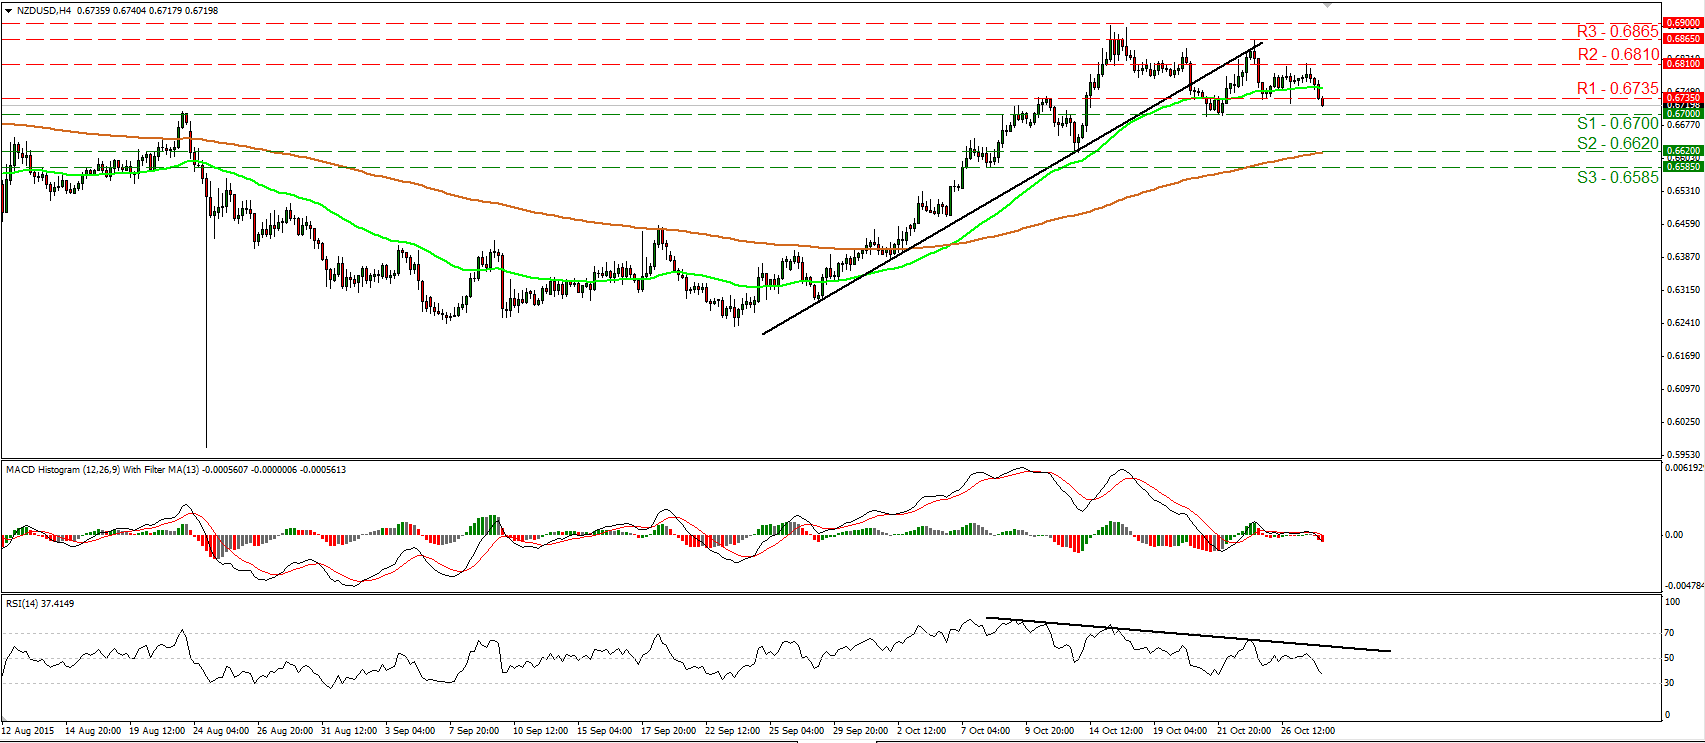
NZD/USD falls below 0.6735 ahead of the RBNZ meeting
• NZD/USD found resistance at 0.6810 (R2) yesterday, and today during the Asian morning, it fell below the 0.6735 (R1) barrier. The rate is now headed towards the 0.6700 (S1) key level, where a clear dip would confirm a forthcoming lower low on the daily chart and is likely to turn the short-term picture to the downside. If the RBNZ decides to cut rates today, the pair would probably continue its slide below 0.6700 (S1) and could challenge the 0.6620 (S2) zone, defined by the lows of the 13th and 14th of October. Our short-term oscillators reveal downside speed and amplify the case for the rate to trade lower, at least in the short run. The RSI fell below its 70 line and is pointing down, while the MACD has just moved below both its zero and signal lines, and points down as well. On the daily chart, the medium-term picture still looks somewhat positive. As a result, I would treat a possible short-term downtrend as a corrective move for now.
• Support: 0.6700 (S1), 0.6620 (S2), 0.6585 (S3)
• Resistance: 0.6735 (R1), 0.6810 (R2), 0.6865 (R3)
AUD/USD tumbles on Australia’s weak CPI data
• AUD/USD collapsed during the European morning Wednesday following the weaker-than-expected CPI data from Australia. The pair fell below the key support (now turned into resistance) hurdle of 0.7200 (R3), confirming a forthcoming lower low on the 4-hour chart and turning the short-term picture negative. Currently, the rate is trading between the support of 0.7100 (S1) and the resistance of 0.7135 (R1) and thus, I would expect a dip below 0.7100 (S1) to prompt extensions towards the 0.7065 (S2) line. Our momentum indicators detect strong downside speed and support the notion. The RSI edged lower and fell below its 30 line, while the MACD stands below both its zero and trigger lines, pointing down. As for the broader trend, on the 9th of October, we had the completion of a failure swing bottom formation. However, given the sharp fall below the 0.7200 (R3) obstacle, I would hold a flat stance for now as far as the longer-term picture is concerned.
• Support: 0.7100 (S1), 0.7065 (S2), 0.7020 (S3)
• Resistance: 0.7135 (R1), 0.7165 (R2), 0.7200 (R3)
WTI falls below the key support of 44.00
• WTI fell below the key support (now turned into resistance) of 44.00 (R1) on Monday and yesterday it hit support at 42.60 (S1), before rebounding somewhat. The price is still trading within a downside channel and this keeps the short-term outlook negative in my view. Our short-term oscillators though, give evidence that the current bounce may continue for a while, perhaps to test the 44.00 (R1) line as a resistance this time. The RSI exited its below-30 territory, while the MACD, has bottomed and looks ready to move above its trigger line. On the daily chart, WTI printed a higher high on the 9th of October, but the close back below 44.00 (R1) has turned the medium-term outlook back to the downside. Therefore, I would expect the bears to continue pushing the price lower in the foreseeable future.
• Support: 42.60 (S1), 41.80 (S2), 41.00 (S3)
• Resistance: 44.00 (R1), 44.85 (R2), 45.85 (R3)
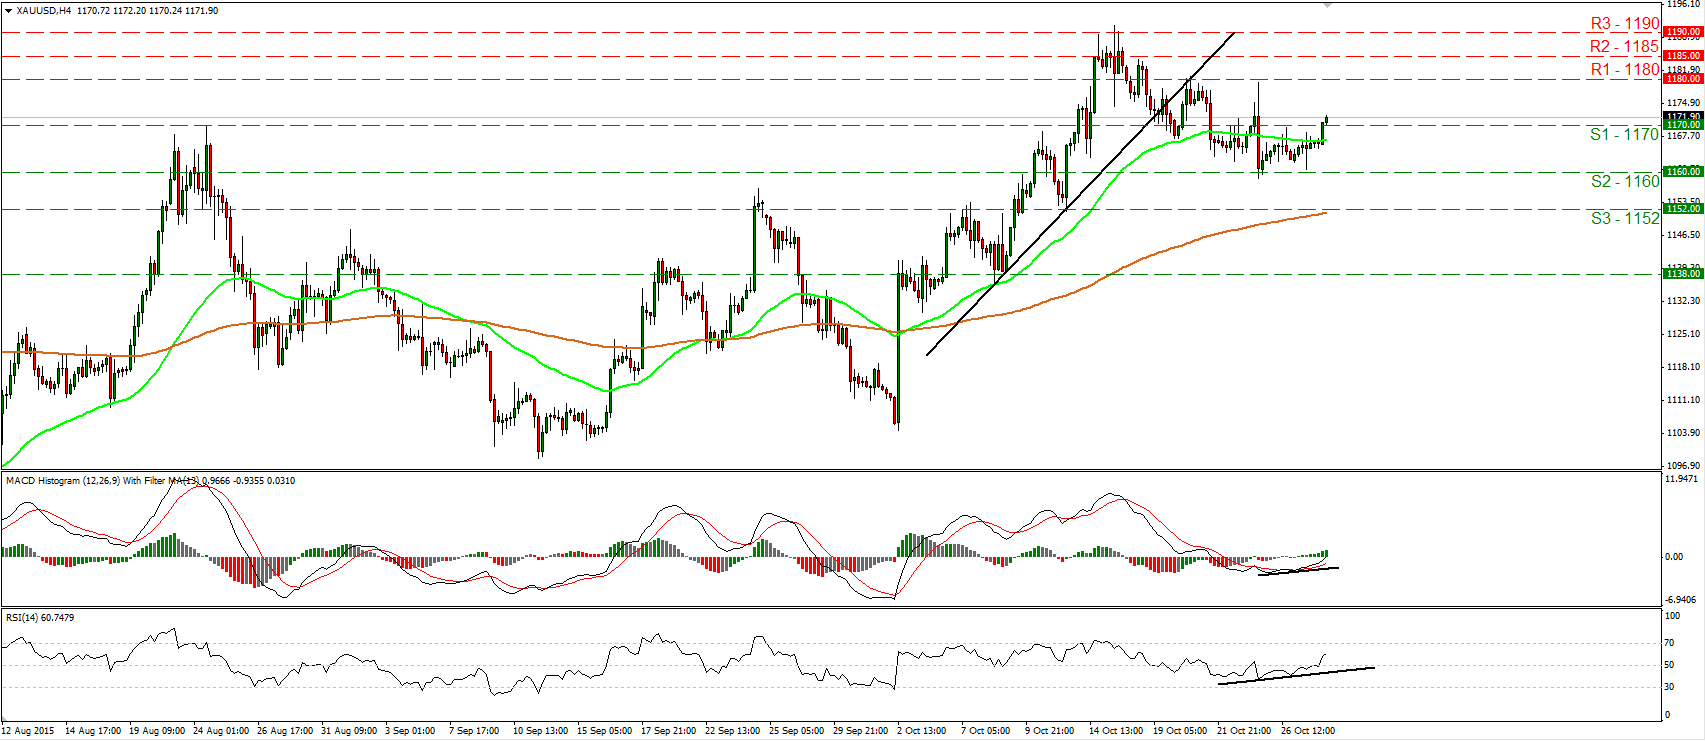
Gold breaks above 1170
• Gold traded higher during the early European morning Wednesday, breaking above the resistance (turned into support) barrier of 1170 (R1). In my view, the break above that hurdle could prompt extensions towards our next obstacle of 1180 (R2). Our short-term momentum studies corroborate my view and magnify the case for further advances. The RSI continued moving higher and emerged above its 50 line, while the MACD, already above its trigger line, has just turned positive. On the daily chart, the longer-term outlook remains somewhat positive. As a result, I would consider the retreat started on the 15th of October as a corrective phase, at least for now. • Support: 1170 (S1), 1160 (S2), 1152 (S3) • Resistance: 1180 (R1), 1185 (R2), 1190 (R3)

