The Big Picture
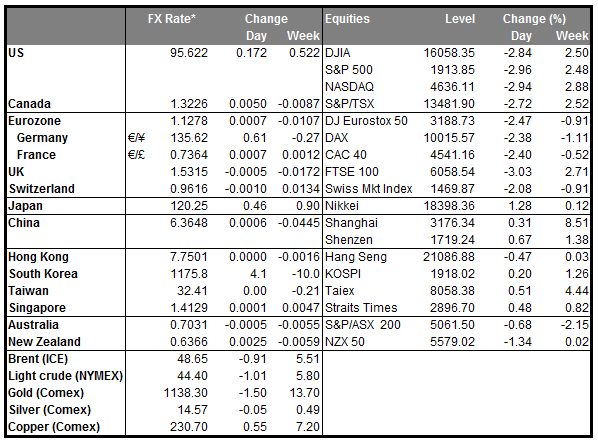
• A better day today? Stocks fell around the world yesterday, culminating in an almost 3% drop in New York. But this morning, most Asian stock markets are trading slightly higher. It could be that they’re taking their lead from China, where speculation that state-backed funds were buying on the last trading day of the week helped to erase losses. In that case, we could see a retreat by EUR and JPY today and some rebound in the hard-hit commodity currencies, but so far there’s little sign of that.
• As I pointed out yesterday, EUR and JPY have been used as funding currencies recently and so as stock markets collapsed yesterday, they were the only two G10 currencies to gain vs USD. CAD, on the other hand, fell sharply as oil went into reverse and plunged (WTI and Brent are both down around 7% this morning from yesterday’s opening levels!) after three days of dramatic gains. The fall in CAD came despite better-than-expected June and Q2 GDP figures, with mining and oil and gas making a particularly strong contribution. CAD rallied on the GDP report, but gradually lost all the gains and more. That suggests people are focusing on global factors and looking forward to weaker growth ahead, not backward at better-than-expected performance recently. NOK is lower too this morning, while RUB is the worst-performing EM currency of the ones that we track, continuing the focus on oil.
• GBP is also opening up lower this morning following yesterday’s disappointing manufacturing PMI for the UK. The action in GBP is somewhat surprising given how hawkish BoE Gov. Carney was in his Jackson Hole speech. The market may be losing faith in central bank communication, as their economists' banks can’t predict future economic trends any better than the private sector and their “forward guidance” has proved to be pretty worthless.
• NZD is down slightly too, despite a strong rise of around 12% at yesterday’s milk auction and further acceleration in house prices to the fastest pace in nearly eight years. The poor performance of NZD despite this favorable domestic news demonstrates how risk aversion and fears about the global economy are dominating the markets.
• The big surprise this morning is AUD, which is the worst-performing G10 currency. I said yesterday that I thought it would probably follow stock markets lower instead of being carried still higher on momentum from the RBA meeting, but even I was surprised by the pace of decline. It peaked shortly after European trading opened Monday and fell steadily during the day along with stocks. News this morning that Australian growth in 2Q was only half as strong as forecast on a qoq basis (+0.2% instead of +0.4% as expected) temporarily pushed AUD/USD below 0.70, although it quickly recovered to trade little changed. It was notable that exports were a major drag on the report; the decline in exports subtracted 0.7 percentage points from the yoy growth of 2.2%, the biggest drag of any sector. While Australia’s performance is still better than that of some other commodity-based economies, such as Canada and Brazil, the big impact of exports suggests further weakness to come and raises the possibility of RBA interest rate cuts down the line. That’s likely to keep AUD on a weakening trend, in my view.
• US data mixed The US data out yesterday was mixed. The manufacturing ISM fell sharply, well below estimates, although it remains in expansionary territory. The prices paid index meanwhile also fell, although that was as expected. Slower growth and falling prices = not the best environment for hiking rates. On the other hand, US auto sales and construction spending surprised on the upside, so clearly the US economy isn’t doing that badly by any means. Nonetheless, Fed fund rate expectations fell across the curve, with everything from March 2017 onwards losing 6 bps of expected tightening. That may be due to comments by Boston Fed President Rosengren, who argued that doubts about inflation justify a “much more gradual normalization process” than occurred previously. The fact that USD generally gained despite the sharp downward revision in rate expectations though just emphasizes the fact that the fears moving the markets are global, not local, and still leave the USD in a good position relative to other countries’ currencies.
• Today’s highlights: In the UK, the construction PMI for August is expected to have risen to 57.5 from 57.1 in July. Nevertheless, having in mind that the manufacturing PMI for August unexpectedly fell, it is possible that the construction PMI is going to miss estimates as well and weigh on expectations of solid growth in Q3. This could pull the trigger for another attempt at the 1.5250 area defined by the low of the 9th of June.
• From the US, we get the ADP employment report for August, two days ahead of the most important NFP number of the year. The ADP report is expected to show a print above the crucial 200k level and that the private sector gained more jobs in August than it did in the previous month. With just a couple of weeks before the Fed’s September meeting, further improvement in the labor market could be the additional information Fed members need for a rate hike to become “compelling.” The Fed also releases the Beige Book, which includes a summary and analysis of current economic conditions in each district and sector. This will provide qualitative information to Fed officials on how the US economy has been performing after the turmoil in China and the collapse in equity markets worldwide. US factory orders for July are also coming out.
• No speakers are scheduled on Wednesday.
The Market
EUR/USD finds resistance at around 1.1330
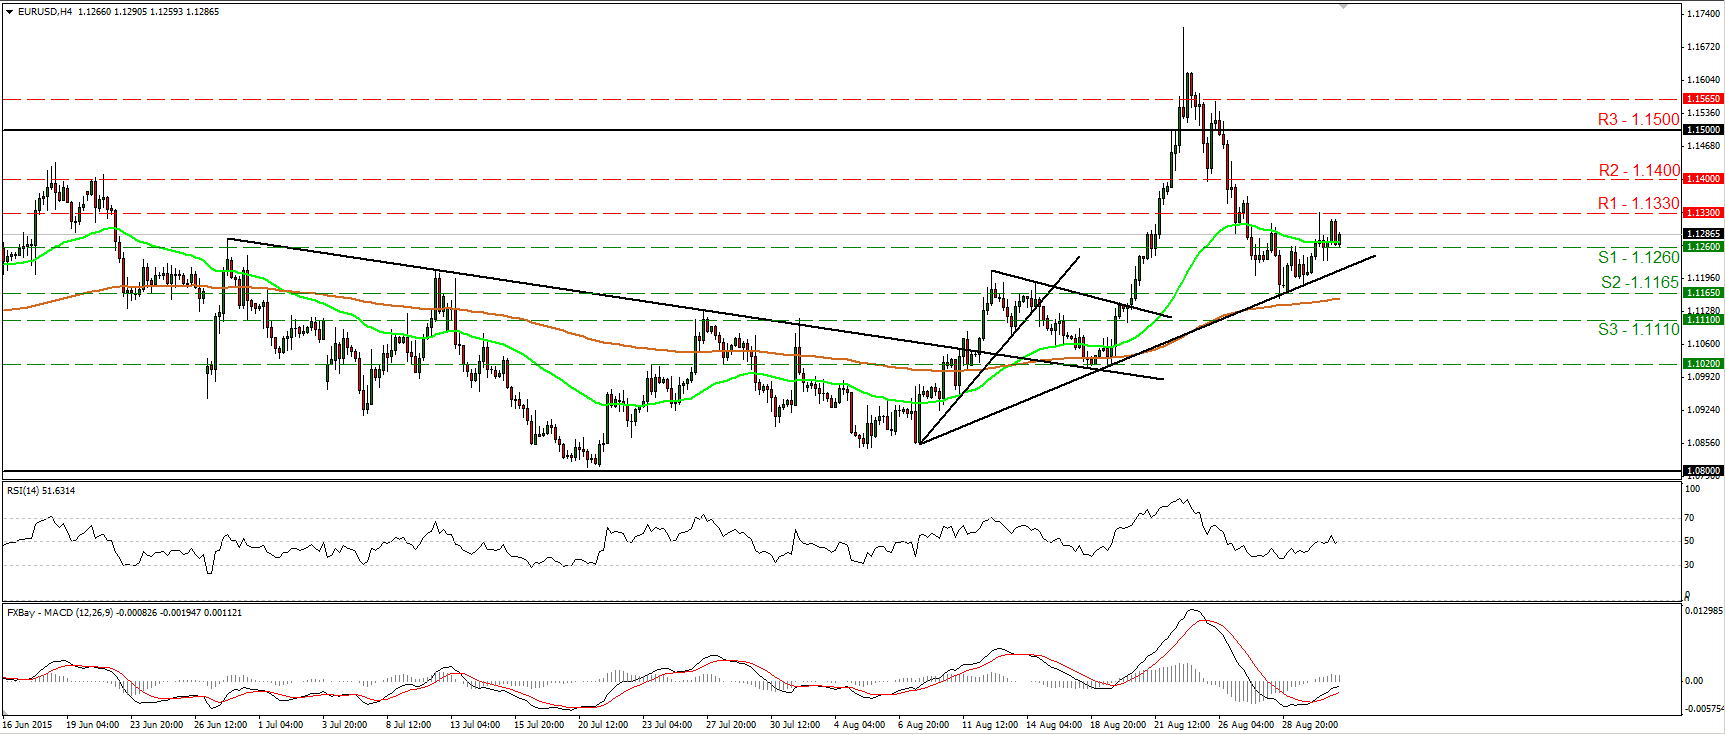
• EUR/USD tried to trade higher yesterday, but hit resistance at 1.1330 (R1) and then pulled back. I would like to see a break above that hurdle before I get confident on more bullish extensions. Something like that could pave the way for the 1.1400 (R2) zone. Our momentum studies detect upside momentum and support the case that EUR/USD could trade higher for a while. The RSI is back above its 50 line and it points up, while the MACD stands above its trigger line and is headed towards its zero line. However, today we get the ADP report from the US, which is expected to show improvement from the month before. This could distort the technical picture and could push the pair below 1.1260 (S1). • As for the broader trend, given that on the 26th of August, EUR/USD fell back below 1.1500 (R3), I would hold my neutral stance. The move below that psychological hurdle confirmed that the surge on the 24th of the month was a false break out. Therefore, I would like to see another move above 1.1500 (R3) before assuming that the overall outlook is back to positive. • Support: 1.1260 (S1), 1.1165 (S2), 1.1110 (S3) • Resistance: 1.1330 (R1), 1.1400 (R2), 1.1500 (R3)
GBP/USD dips below 1.5330 following the UK manufacturing PMI
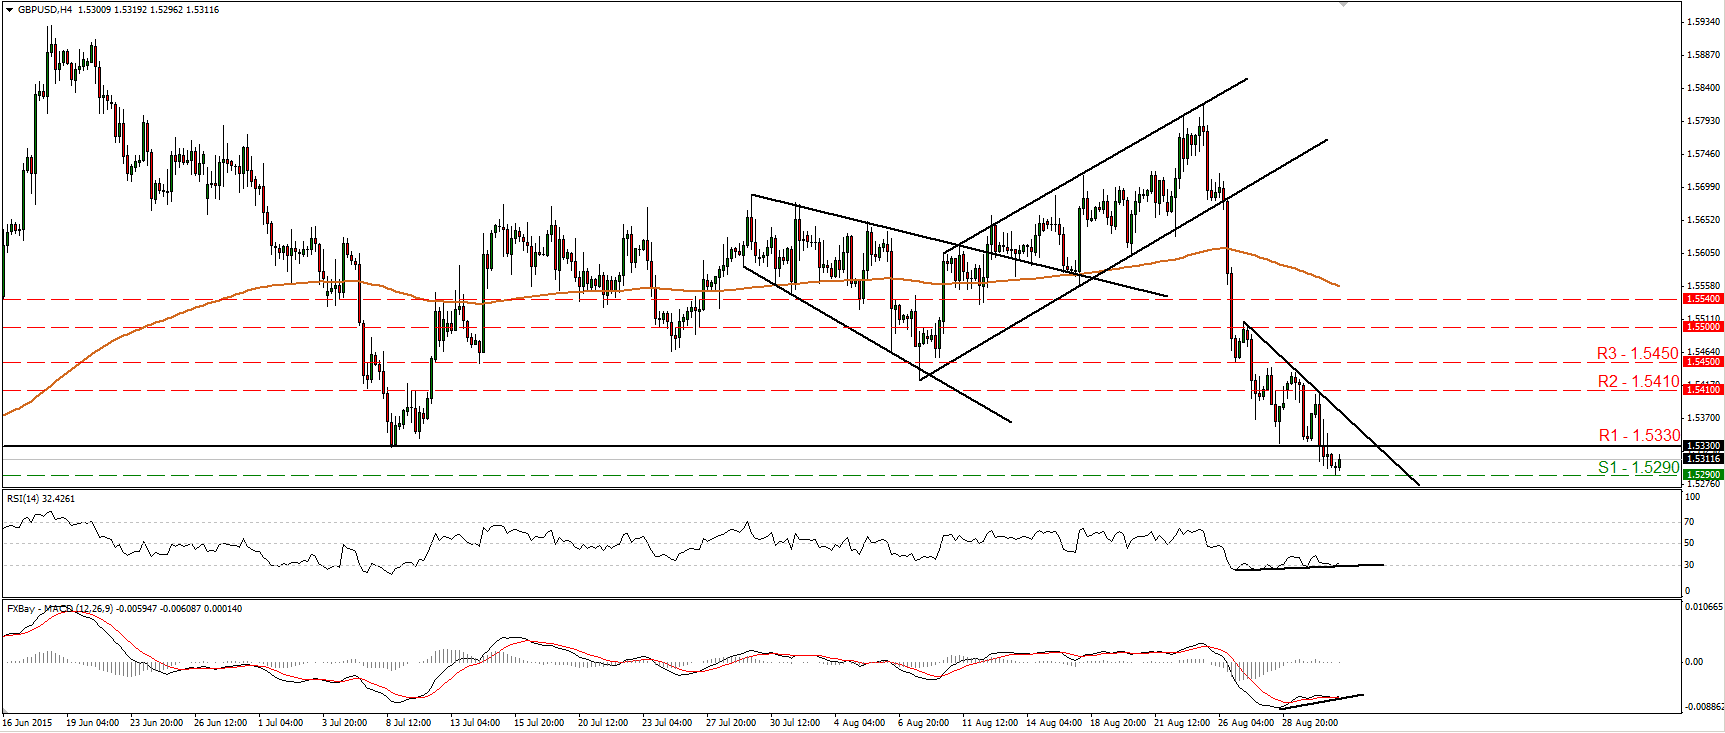
• GBP/USD tumbled on Tuesday, following the unexpected decline in the UK manufacturing PMI for August. The pair fell below the 1.5330 (R1) key hurdle, defined by the low of the 8th of July, but the decline fell short of reaching the 1.5250 (S2) line and hit support at 1.5290 (S1). The bias remains negative in my view. A disappointment in today’s construction PMI could push the rate for a test at 1.5250 (S2). However, given that there is positive divergence between our short-term oscillators and the price action, an upside corrective wave could also be on the cards, perhaps even back above 1.5330 (R1).
• As for the bigger picture, the collapse on the 26th of August brought the rate back below the 80-day exponential moving average. What’s more, the move below 1.5330 confirmed a forthcoming lower low on the daily chart. In my view, this shifts the overall outlook cautiously to the downside.
• Support: 1.5290 (S1), 1.5250 (S2), 1.5185 (S3)
• Resistance: 1.5330 (R1), 1.5410 (R2), 1.5450 (R3)
AUD/USD reaches the psychological number of 0.7000
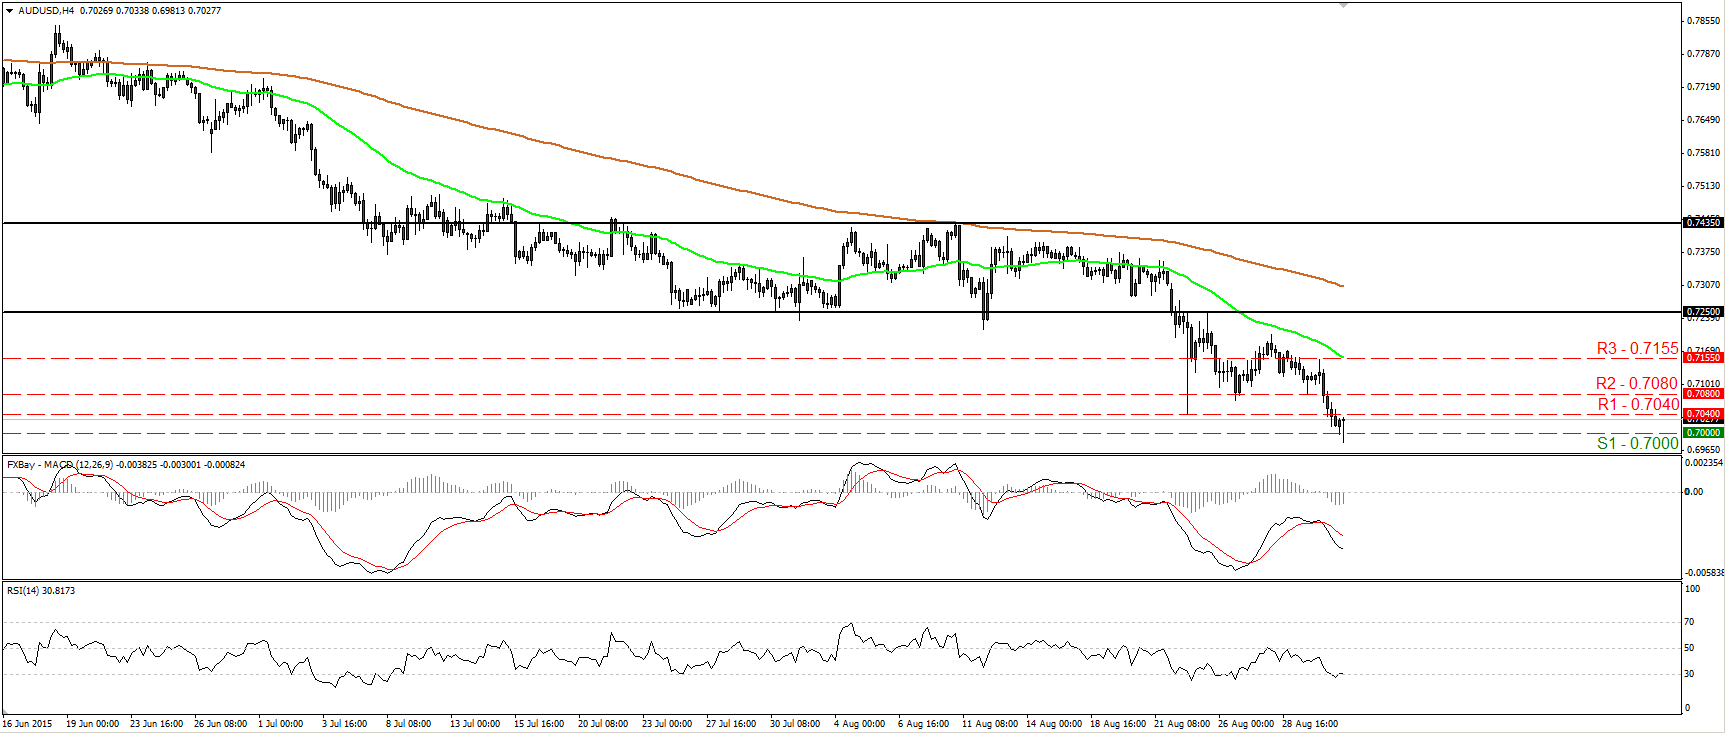
• AUD/USD traded lower during the Asian morning Wednesday after Australia’s weaker-than-expected Q2 GDP. Immediately following the disappointing release, the pair managed to breach the psychological zone of 0.7000 (S1) but stayed below there for less than 10 minutes. The short-term bias remains negative in my view, and as a result, I would expect a clear move below 0.7000 (S1) to initially aim for the 0.6950 (S2) line, defined by the low of the 20th of April 2009. Another break below that hurdle could set the stage for extensions towards the low of the 30th of March 2009 at 0.6765 (S3). Taking a look at our momentum studies though, I see that some profit taking, a minor bounce, could follow the challenge near the 0.7000 (S1) zone. The RSI rebounded from slightly below its 30 line, while the MACD shows signs that it could start bottoming. In the bigger picture, the break below 0.7250 confirmed a forthcoming lower low on the daily chart, and this supports the case that AUD/USD could trade below the 0.7000 (S1) territory in the foreseeable future.
• Support: 0.7000 (S1), 0.6950 (S2), 0.6765 (S3)
• Resistance: 0.7040 (R1), 0.7080 (R2), 0.7155 (R3)
WTI falls back below 45.00
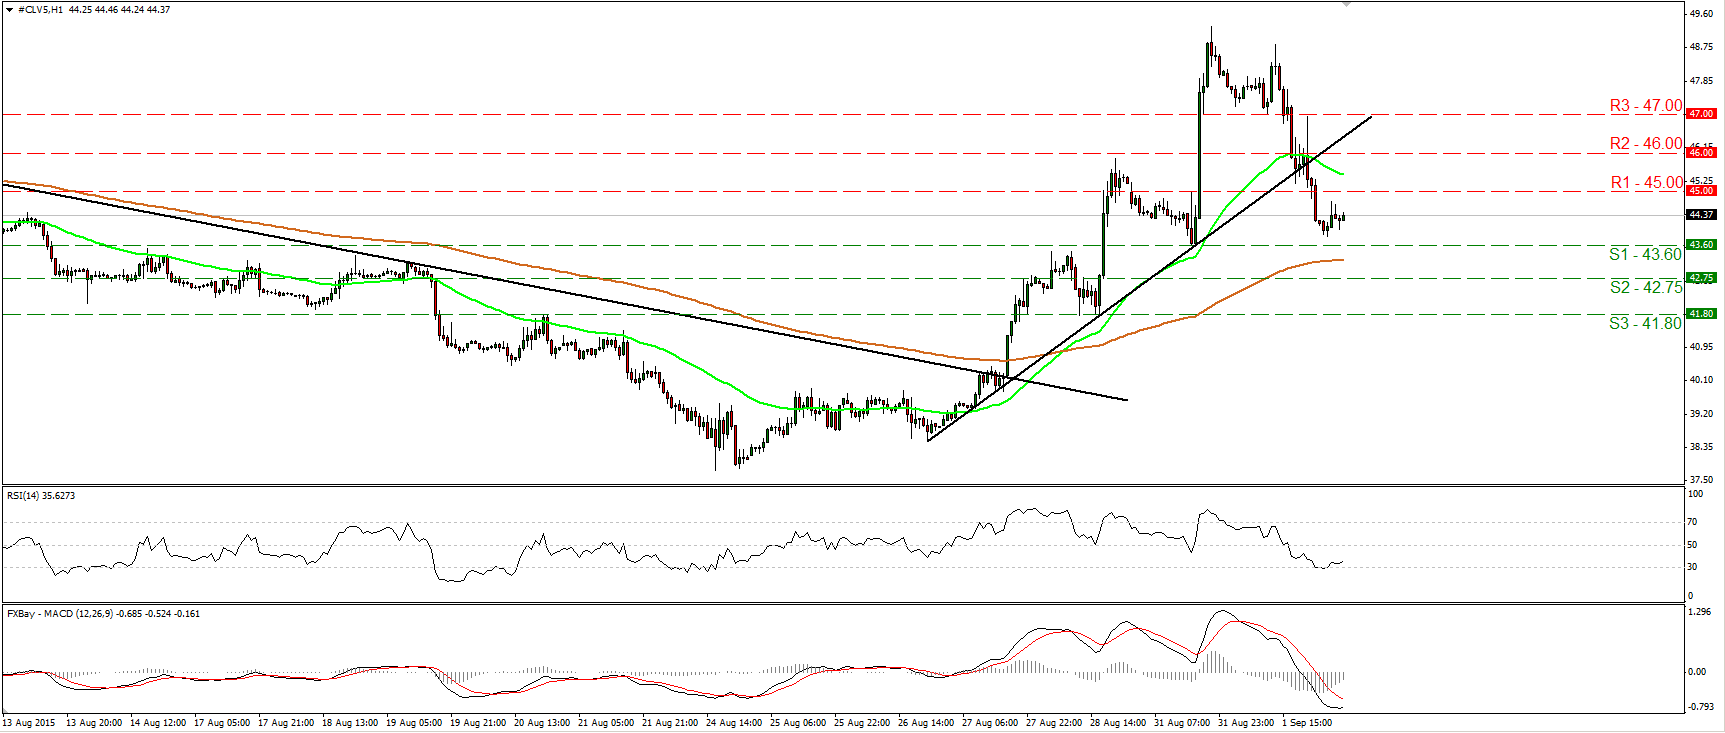
• WTI collapsed on Wednesday, falling below the short-term uptrend line taken from the low of the 26th of August. Subsequently, it fell below the psychological barrier of 45.00 (R1). This has shifted the short-term bias back to the downside and therefore, I would expect the bears to challenge the 43.60 (S1) support soon. A break below that hurdle is likely to extend the declines, perhaps towards the 42.75 (S2) line. Taking a look at our hourly oscillators though, I see the possibility of a minor bounce before sellers decide to shoot again. The RSI rebounded from near its 30 line, while the MACD has bottomed and could move above its trigger line soon. On the daily chart, I still see a longer-term downtrend. As a result, I would treat the 26th – 31st of August advance as a corrective move of that major downside path.
• Support: 43.60 (S1), 42.75 (S2), 41.80 (S3)
• Resistance: 45.00 (R1) 46.00 (R2), 47.00 (R3)
Gold hits the trend line again
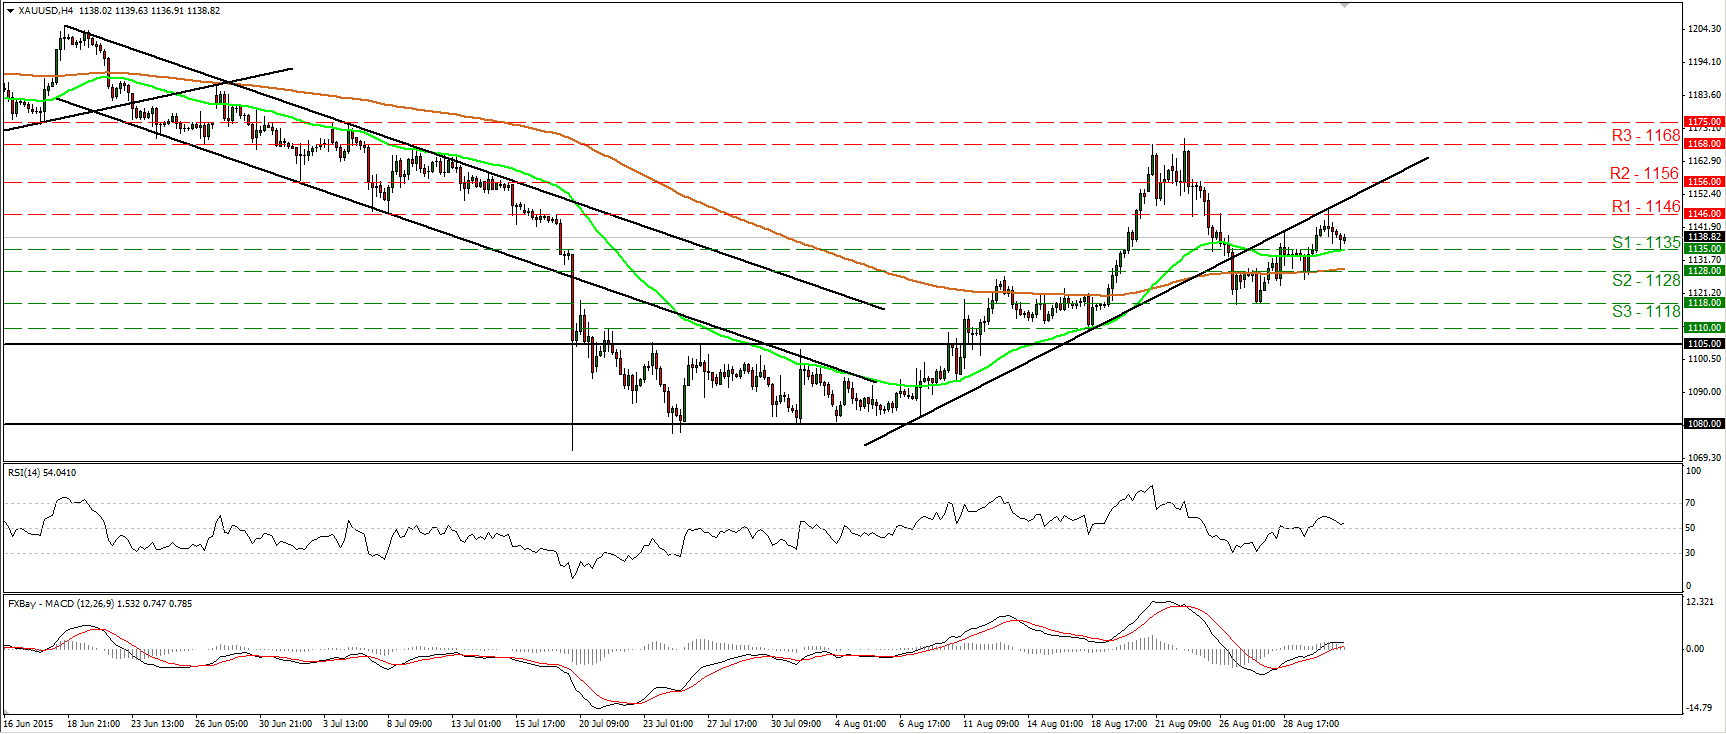
• Gold traded higher on Tuesday, but found again resistance at the prior uptrend line taken from the low of the 7th of August. Subsequently, the rate retreated to find support at 1135 (S1). I still believe that a move above the aforementioned trend line could shift the short-term bias back positive. On the other hand, a break below 1135 (S1) could extent the current retreat and perhaps challenge the 1128 (S2) line. The RSI turned up from slightly above its 50 line, while the MACD lies slightly above its zero line and points sideways.
• Taking into account these momentum signs, I would hold a flat view for now and I prefer to wait for clearer directional movements. As for the bigger picture, with no clear trending structure on the daily chart, I would hold my neutral stance as far as the overall outlook is concerned as well.
• Support: 1135 (S1), 1128 (S2), 1118 (S3)
• Resistance: 1146 (R1), 1156 (R2), 1168 (R3)

