• Fed “approaching” hike conditions, but not yet there The minutes of the latest FOMC meeting showed that most Fed officials judged that the conditions for a rate hike are approaching but had not yet been achieved. The uncertain tone of the minutes suggested that the members were somewhat less likely to raise rates at their September meeting, mainly due to concerns over inflation that is not yet moving towards the necessary conditions to justify a rate hike. As mentioned in the minutes, “Almost all members indicated that they would need to see more evidence that economic growth was sufficiently strong and labor market conditions had firmed enough for them to feel reasonably confident that inflation would return to the Committee’s longer-run objective over the medium term.”
• In addition to wariness over the pace of the inflation, it’s important to keep in mind that events since the July meeting –China’s yuan devaluation– will probably give FOMC members a new reason for caution. This could make Fed’s decision even more difficult. Another important point in the minutes was the FOMC members attempt to communicate once again that the expected path for policy, not the initial increase, would be the most important determinant of financial conditions. USD pulled back sharply after the minutes were released and the probability of a September hike fell to 40% from around 50% before. Nevertheless, following the July FOMC minutes, we retain our view that September is the most likely month for a lift-off. However, the bar for the rate hike has been pushed a bit higher, given the lower energy prices and the weakening international outlook since the July meeting.
• Today’s highlights: Sweden’s official unemployment rate for July is expected to decline. The PES unemployment rate for the same month increased a bit, raising questions over expectations of a strong decline in the official figure. In any case, a decline in the jobless rate could strengthen SEK at the release.
• In Norway, Q2 GDP is expected to contract from the previous quarter, while the mainland GDP is expected to expand at a slower pace than in Q1. Following the below-expectations inflation rate last week, this may add pressure on the Norges Bank to ease at its September meeting. This could prove NOK-negative.
• In the UK, retail sales for July are forecast to have risen, a turnaround from the previous month. Last month, GBP plunged after the country’s retail sales unexpectedly fell in June, disappointing investors who were expecting a strong reading. Therefore, a strong reading in July is likely to strengthen GBP, as this will add to the solid wage growth and support BoE officials’ expectations that inflation is likely to pick up towards the end of the year. With the UK inflation rate back above zero, market participants will be closely watching the data for signs of demand-pull inflation.
• From the US, we get the initial jobless claims for the week ended on August 15 and the Philadelphia Fed Business activity index for August. The Conference Board leading index for July is expected to decelerate somewhat from the month before. Existing home sales for July are also coming out. The housing starts and building permits released earlier this week were consistent with an improving housing market. Therefore, another strong housing figure could strengthen USD.
The Market
EUR/USD surges on the Fed minutes
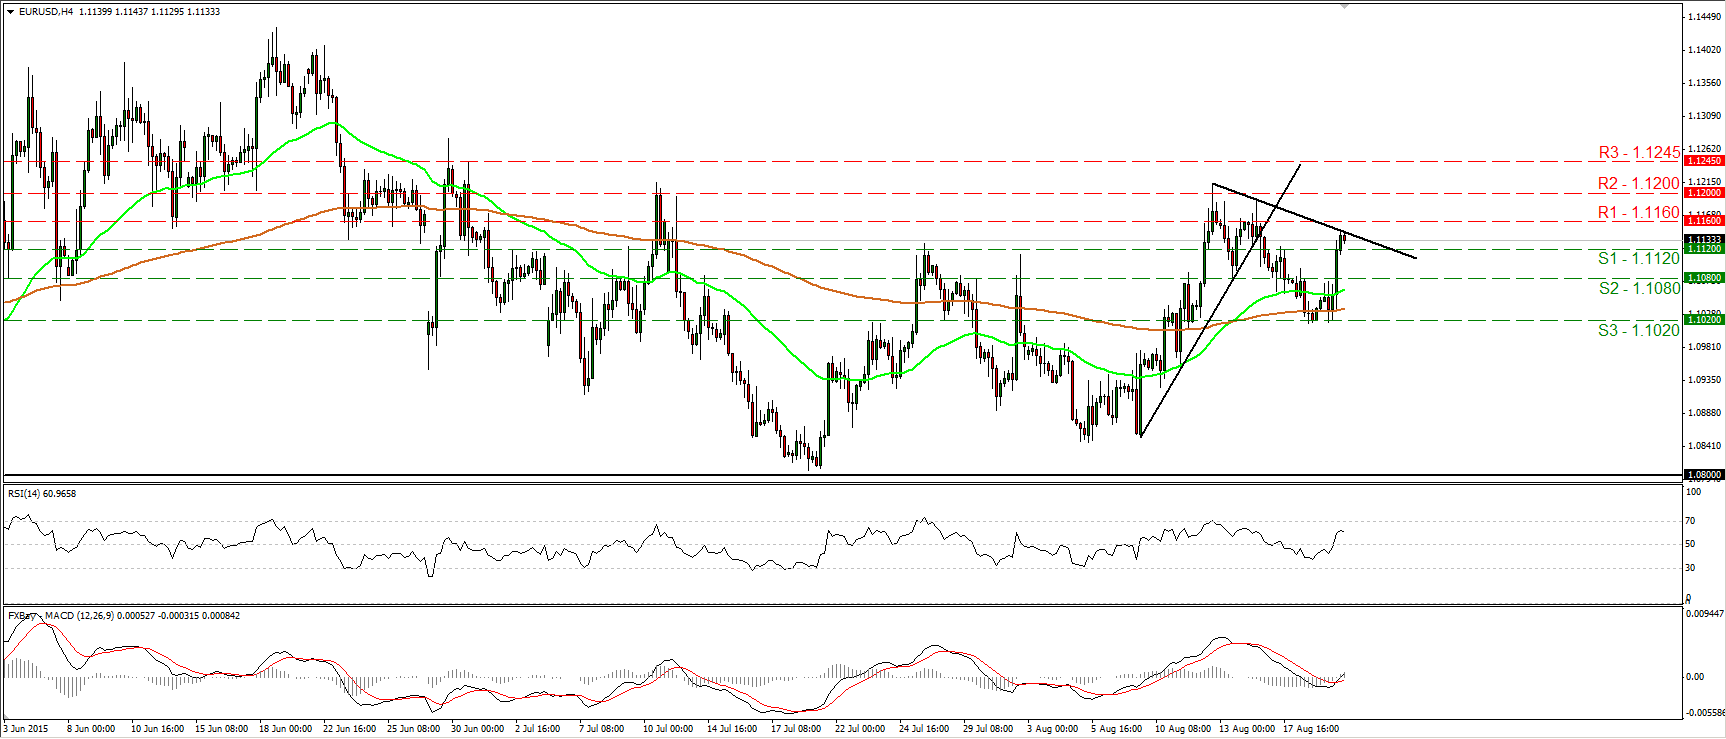
• EUR/USD rallied on Wednesday as the minutes from the latest FOMC meeting gave little to no indication that the Committee could raise rates in September. The pair surged and violated two resistance (now turned into support) barriers in a row, and therefore, I would switch my stance to neutral for now. During the early European morning Thursday, the rate is trading between the 1.1120 (S1) and 1.1160 (R1) lines. A clear break above the latter barrier is likely to extend the rally towards the 1.1200 (R2) zone, while a dip back below 1.1120 (S1) could challenge the next support at 1.1080 (S2). The RSI, although above 50, has turned down, while the MACD has bottomed and turned positive. The mixed momentum signs support my choice to take the sidelines, at least for now. As for the broader trend, as long as EUR/USD is trading between 1.0800 and 1.1500, I would consider the longer-term picture to stay flat as well. I believe that a move above the psychological zone of 1.1500 is the move that could carry larger bullish implications, while a break below 1.0800 is needed to confirm a forthcoming lower low on the daily chart and perhaps turn the overall bias back to the downside.
• Support: 1.1120 (S1), 1.1080 (S2), 1.1020 (S3)
• Resistance: 1.1160 (R1), 1.1200 (R2), 1.1245 (R3)
GBP/JPY continues its sideways path
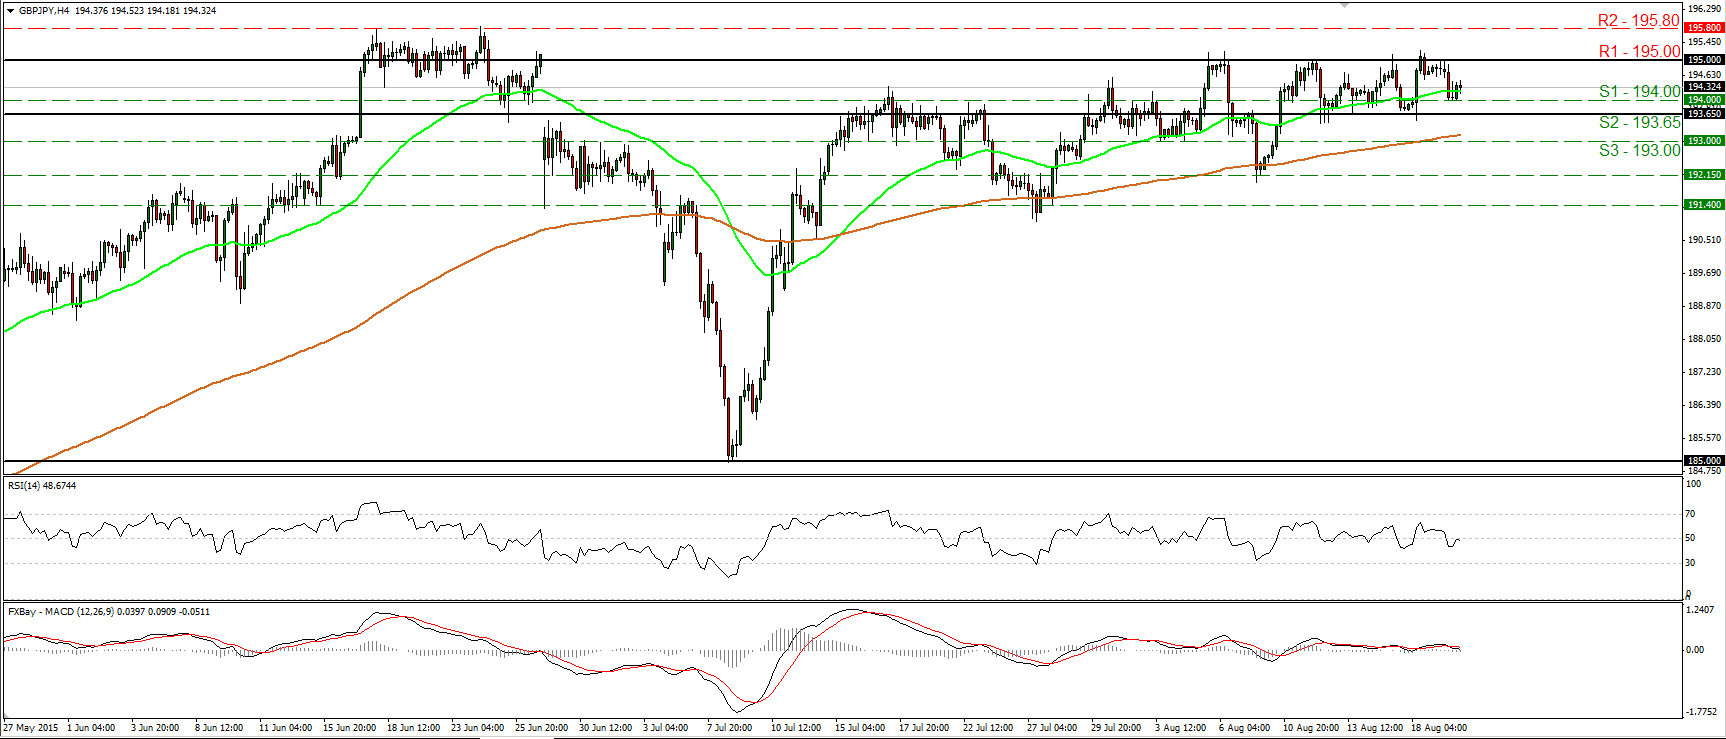
• GBP/JPY traded lower yesterday, but hit support at 194.00 (S1) and then rebounded somewhat. The pair has been oscillating between 193.65 (S2) and the psychological zone of 195.00 (R1) since the 10th of August, and therefore, I would consider the short-term picture to stay flat. The RSI has turned up and now lies near its 50 line, while the MACD stands fractionally above zero and points sideways. These indicators reveal neutral momentum and support my choice to hold a flat stance. Today, we get the UK retail sales for July and expectations are for a better figure than the previous month. This could push GBP/JPY higher, perhaps for another test at the 195.00 (R1) psychological resistance. A break above that zone could open the way for the 195.80 (R2) hurdle, defined by the peaks of the 18th and 24th of June. On the daily chart, I see that on the 8th of July, the rate rebounded from the 185.00 psychological zone, which stands pretty close to the 50% retracement level of the 14th of April – 24th of June rally. As a result, I would consider the overall path of this pair to be to the upside.
• Support: 194.00 (S1), 193.65 (S2), 193.00 (S3)
• Resistance: 195.00 (R1), 195.80 (R2), 197.00 (R3)
AUD/USD hits 0.7320 and rebounds
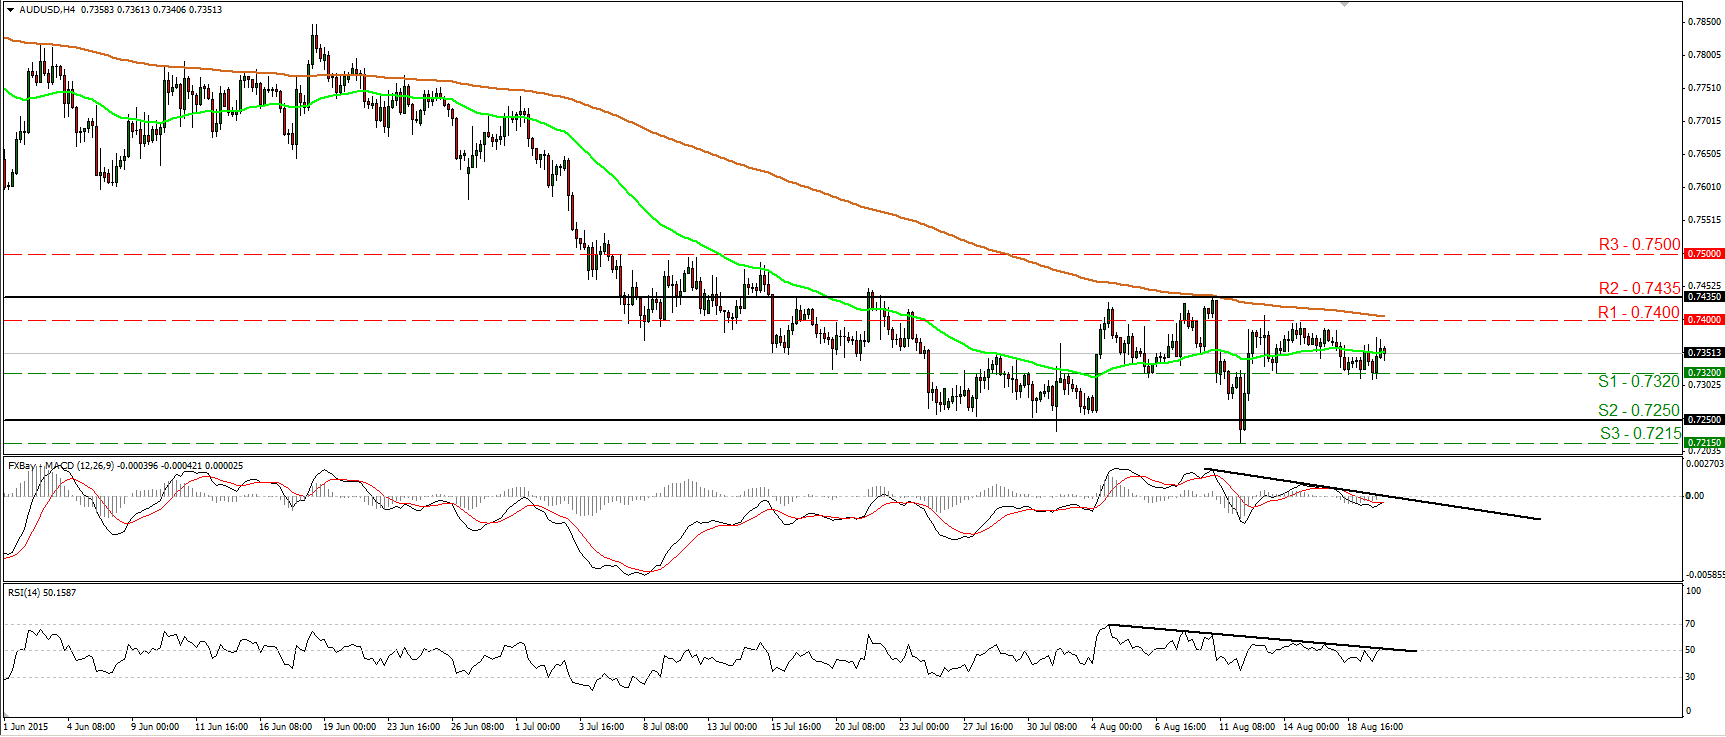
• AUD/USD hit the 0.7320 (S1) support barrier on Tuesday, and on Wednesday, it rebounded somewhat. On the 4-hour chart, the price structure still suggests a sideways short-term path, therefore I would consider the near-term picture to stay neutral for now. However, I would expect the bears to eventually take control again and push the rate lower. The RSI hit its downside resistance line and looks ready to fall below 50 again, while the MACD, although it points up, is still negative and still lies below its respective downside line. A clear dip below 0.7320 (S1) would confirm the case and perhaps see scope for extensions towards 0.7250 (S2). On the daily chart, the completion of a head and shoulders formation and the move below the psychological zone of 0.7500 signaled the continuation of the prevailing long-term downtrend, in my opinion. Nevertheless, I still believe that it would be better to wait for a break below 0.7215 (S3), defined by the low of the 12th of August, before trusting again the longer-term down path. Such a move would confirm a forthcoming lower low on the daily chart and perhaps open the way for the psychological zone of 0.7000.
• Support: 0.7320 (S1), 0.7250 (S2), 0.7215 (S3)
• Resistance: 0.7400 (R1), 0.7435 (R2), 0.7500 (R3)
Gold breaks above 1127
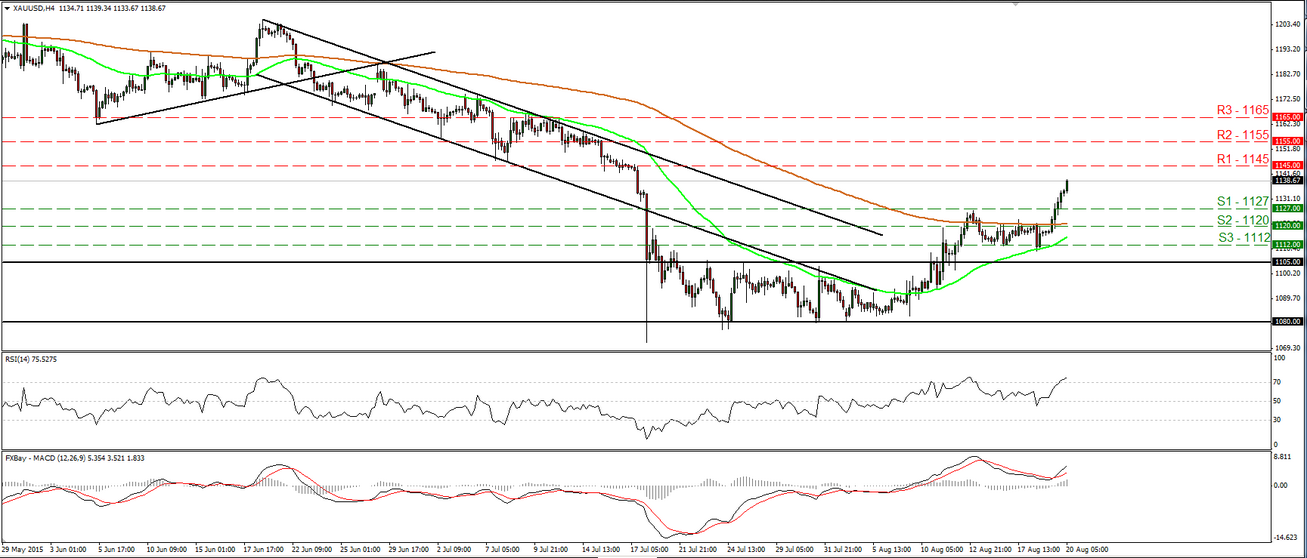
• Gold surged on Wednesday, breaking above the resistance (now turned into support) barrier of 1127 (S1). Now, the metal looks to be headed towards the 1145 (R1) zone, where an upside break is likely to extend the bullish move towards our next resistance of 1155 (R2). Our momentum indicators detect strong upside speed and amplify the case that gold could continue to trade higher for a while, at least towards the 1145 (R1) barrier. The RSI crossed above 70 and is pointing up, while the MACD, already positive has bottomed and crossed above its trigger line. In the bigger picture, the plunge on the 20th of July triggered the continuation of the longer-term downtrend and this keeps the overall bias of the yellow metal to the downside in my view. As a result, I would treat the short-term uptrend as a corrective move of the longer-term downtrend.
• Support: 1127 (S1), 1120 (S2), 1112 (S3)
• Resistance: 1145 (R1), 1155 (R2), 1165 (R3)
DAX futures tumble and hit the key support zone of 10670
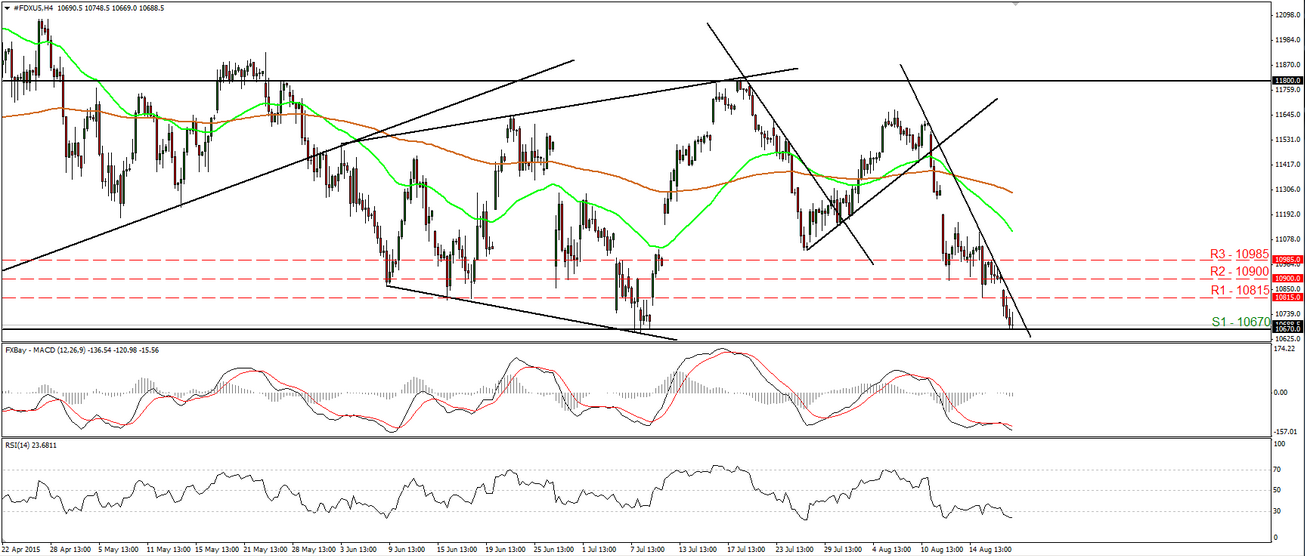
• DAX futures slid yesterday, fell below the support (now turned into resistance) barrier of 10815 (R1), and hit the key barrier of 10670 (S1), defined by the lows of the 7th and 8th of July. The short-term trend remains negative in my view, but I would like to see a clear break below 10670 (S1) before I trust that down path again. Something like that is likely to initially target the next support at 10600 (S2). Our oscillators support the negative short-term picture. The RSI fell below its 30 line and points down, while the MACD, already negative, crossed again below its signal line. As for the broader trend, I will maintain my flat stance. A clear and decisive break below 10670 (S1) is the move that could bring a bearish trend reversal, while a clear close above 11800 is needed to trigger the continuation of the prevailing upside path.
• Support: 10670 (S1), 10600 (S2), 10500 (S3)
• Resistance: 10815 (R1) 10900 (R2), 10985 (R3)

