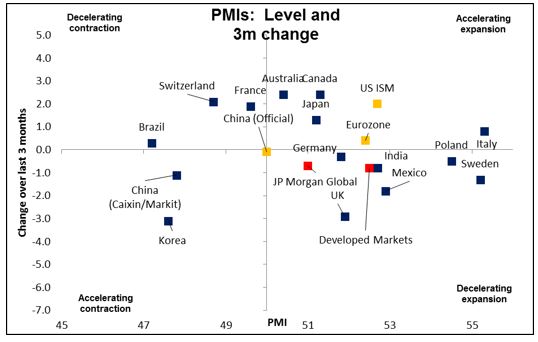
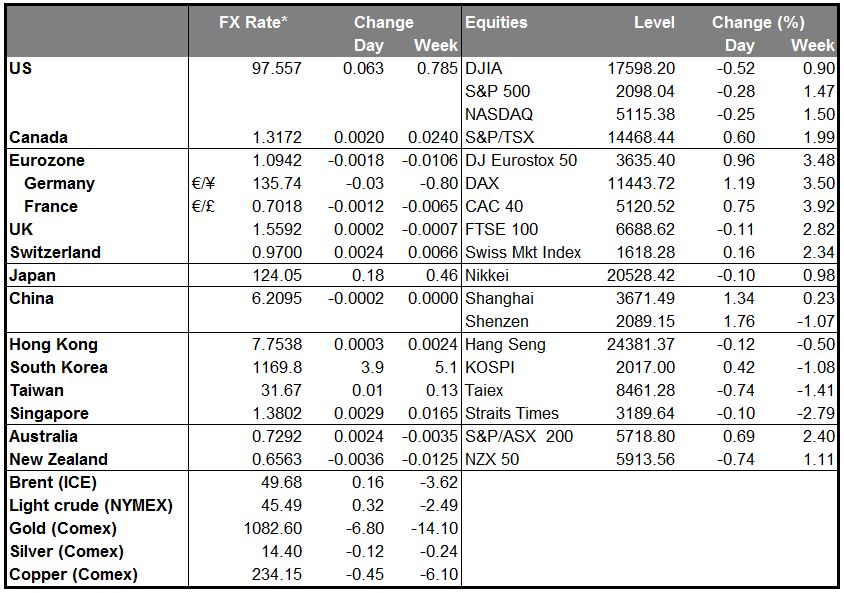
• Commodity prices continue to fall as global growth slows: Yesterday’s purchasing managers’ indices (PMIs) showed continued weakness in global growth, with seven of the Asian PMIs remaining below the 50 line that signals the difference between expansion and contraction. New orders remain sluggish, suggesting that demand is weak. This suggests continued poor trade performance from these countries and a continued preference for a weak currency. In the US too, the ISM manufacturing index fell to 52.7 from 53.5; although new orders and production were both higher, new export orders fell further into below-50 territory, corroborating the slide in global demand. Switzerland and France were both below 50. On the other hand, Italy and Spain were both in expansionary territory, indicating that some of the peripheral countries (but not all! See below) are recovering.
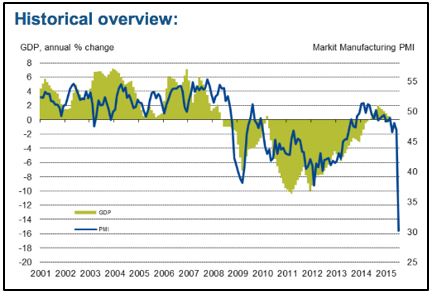
• One horror story: the Greek PMI collapsed to 30.2 as employment plunged. That suggests a contraction in GDP of around 16%. It’ll be interesting to see how Germany plans on getting its money back once all the Greek companies have gone bankrupt and the entire country is unemployed.
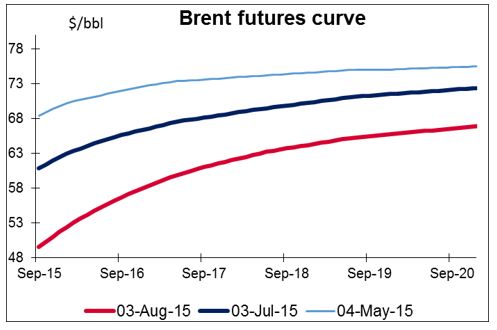
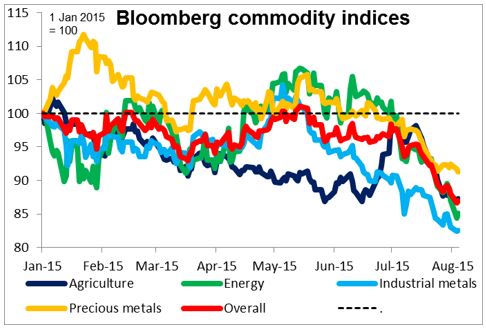
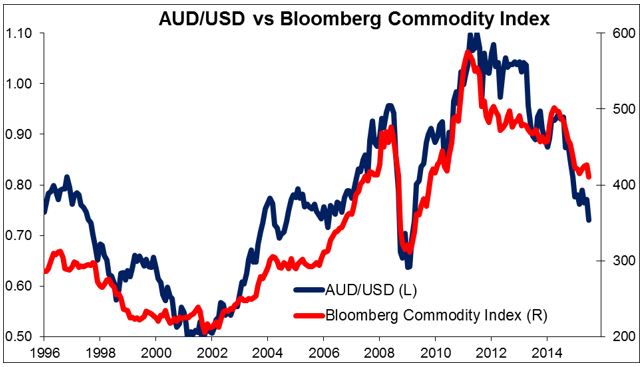
• Meanwhile, every metal listed on Bloomberg is lower this morning, as are about half the agricultural commodities. Oil prices are up from their New York close, but are down substantially on the day. Of particular note is that the longer-dated oil contracts are also moving down, albeit not as much as the near-term contracts. The fall in longer-dated prices is important for monetary policy because some central banks, including the ECB, use the oil futures curves in forecasting future oil prices and therefore future inflation rates. The market’s forecast that oil prices will not rebound back to previous levels will therefore influence central banks’ forecasts for inflation and their monetary policy response. In addition of course, the broad-based decline in commodity prices means that the fall in prices is much broader than just lower oil, and so the monetary policy response is likely to be stronger as well.
• Conclusion: “currency wars” to continue The official response to these two problems – sluggish global growth and falling commodity prices – would both be to keep interest rates low and try to prevent currencies from appreciating. In other words, if each central bank responds the way it should to its domestic problems, the result is likely to be a resumption of the “currency wars” as each one tries to loosen policy relative to the next. This kind of response is generally good for financial markets, as low interest rates may support stock and bond prices, but it risks competitive devaluations and increased friction in the currency markets. Ultimately it may give rise to trade restrictions, particularly in the US, whose trade deficit (= demand excess) seems to be the counterpart to much of the world’s trade surpluses (= demand deficits).
• In this context, USD and GBP are likely to be in demand as the only currencies bucking the loosening trend. The commodity currencies, especially those dependent on trade with China, are likely to weaken as their terms of trade deteriorate further. EM currencies may continue to weaken as global growth slows and their export-oriented economic structures come under stress.
• RBA keeps rates steady, as expected; signals AUD has fallen far enough The Reserve Bank of Australia (RBA) met today and kept rates unchanged, as expected. The key point for the FX market was that it removed the line from its statement that “further depreciation (of AUD) seems both likely and necessary, particularly given the significant declines in key commodity prices,” instead saying only that “the Australian dollar is adjusting to the significant declines in key commodity prices.” The conclusion of the statement was unchanged from July, which was resolutely neutral. In the long run, however, I would expect AUD to remain under pressure as the slowdown in the mining sector and mining investment has been substantial, and the Bank now puts emphasis on the slowdown in non-mining business investment as well. With several surveys pointing to weak investment over the coming year, not to mention the falling commodity prices, AUD could head lower, in my opinion.
• Today’s highlights: During the European day, we have a relatively light calendar day. Eurozone’s PPI for July is expected to fall at an accelerating pace. In Norway, manufacturing PMI for July is expected to remain unchanged at 44.0, below the threshold of 50 level dividing expansion from contraction. Coming on top of the falling oil prices, this could put further selling pressure on NOK.
• In the UK, we get the construction PMI for July. Following the improved manufacturing PMI on Monday, another strong reading could strengthen GBP. The Nationwide house price index came out at +0.4% mom, as expected, showing that house prices continue to rise.
• From Canada, we get the RBC manufacturing PMI for July. No forecast is available for this indicator and the market pays more attention to the Ivey PMI to be released on Friday. Therefore, the market reaction could be limited at the release.
• From the US, the factory orders for June are forecast to rise, a turnaround from the previous month. This could prove USD-supportive.
The Market
EUR/USD falls below the 1.0965 barrier
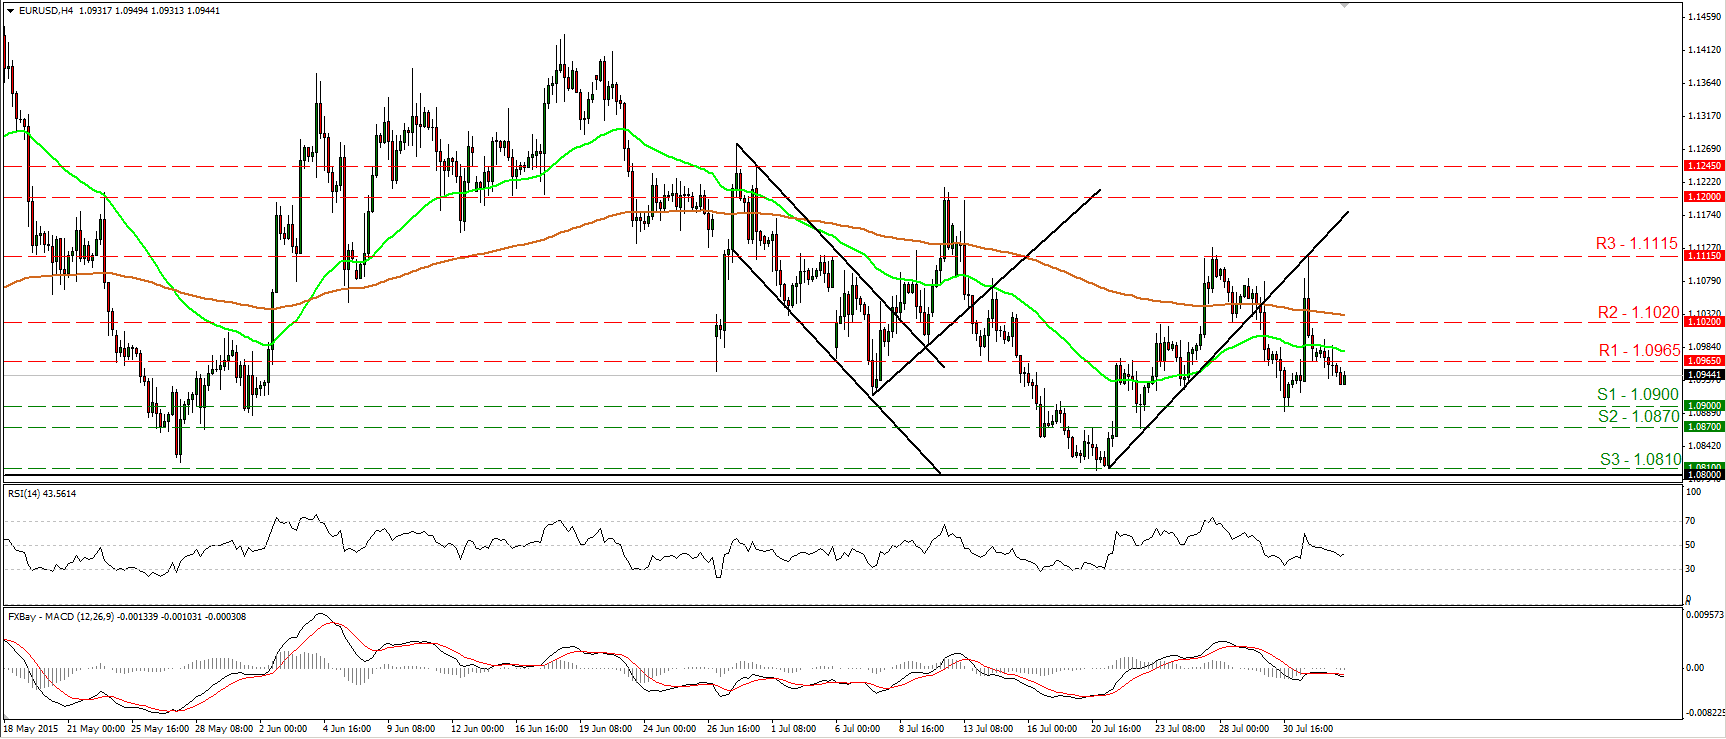
• EUR/USD traded lower on Monday, falling below the support (now turned into resistance) hurdle of 1.0965 (R1). I would now expect the bears to continue pushing the rate down and to eventually aim for another test at the 1.0900 (R1) territory. Our short-term oscillators detect negative momentum and amplify the case. The RSI declined after falling below its 50 line, while the MACD, already negative, has fallen below its trigger line. As for the broader trend, as long as EUR/USD is trading between 1.0800 and 1.1500, I would expect the longer-term picture to stay flat. I believe that a move above the psychological zone of 1.1500 is the move that could carry larger bullish implications, while a break below 1.0800 is needed to confirm a forthcoming lower low on the daily chart and perhaps turn the overall bias back to the downside.
• Support: 1.0900 (S1), 1.0870 (S2), 1.0810 (S3)
• Resistance: 1.0965 (R1), 1.1020 (R2), 1.1115 (R3)
AUD/USD races higher after the RBA decision
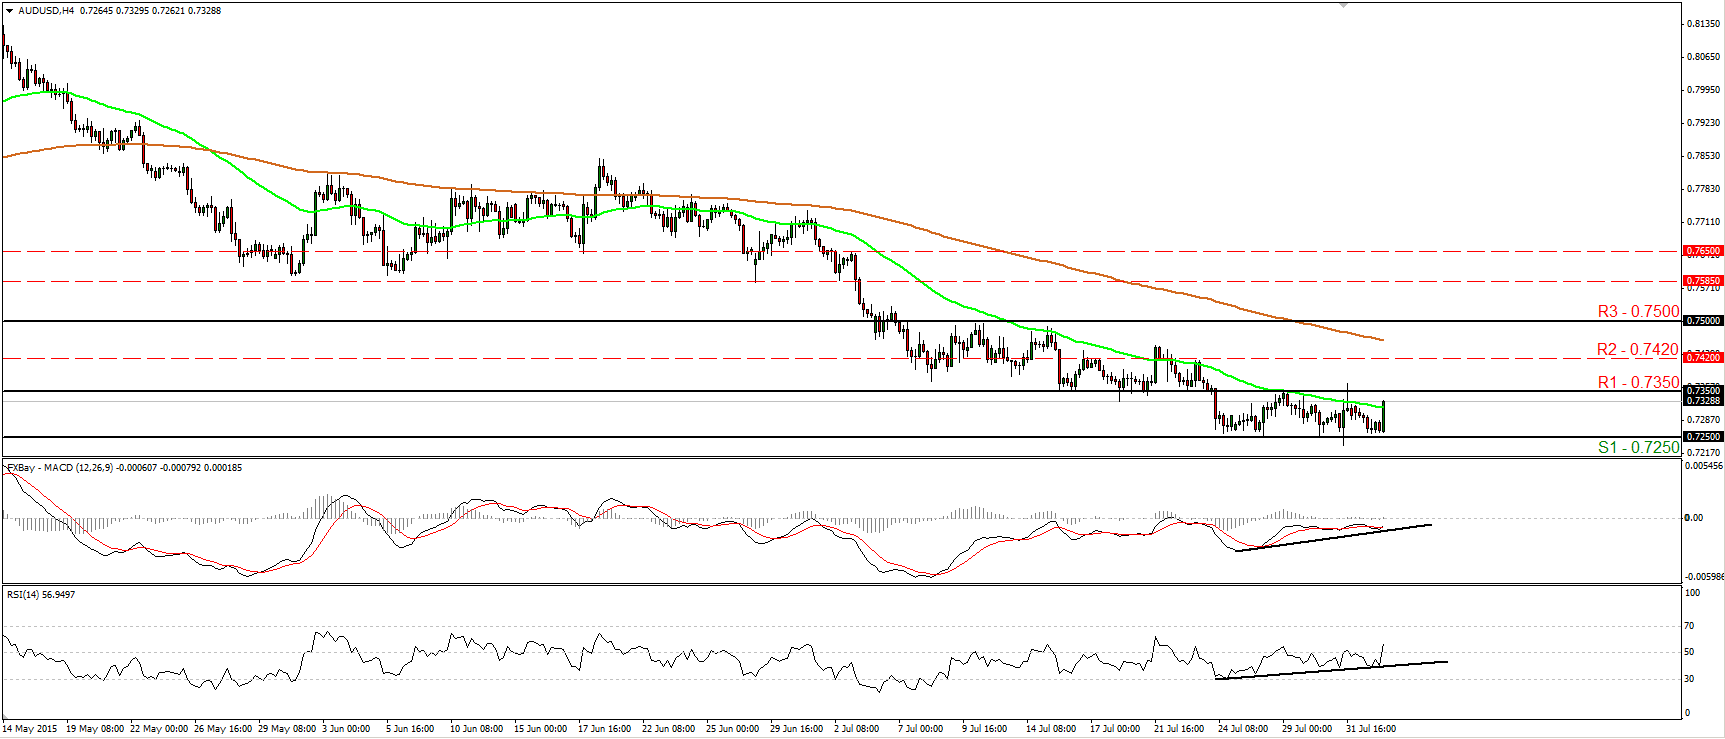
• AUD/USD edged higher during the early European morning Tuesday after the RBA kept its key policy rate unchanged and removed the phrase that “further fall in AUD is likely and necessary” from its statement. The rate rebounded after hitting support fractionally above the 0.7250 (S1) barrier and is now headed towards the 0.7350 (R1) obstacle. The pair has been trading between these barriers since the 24th of July, and hence, I still consider the near-term picture to be neutral. Taking a look at our short-term oscillators though, I see signs that the pair could extend higher. The RSI emerged above its 50 line and is now pointing up, while the MACD, although negative, has moved again above its trigger line. What is more, there is positive divergence between both these indicators and the price action. A break above 0.7350 (R1) would confirm the case and perhaps target our next resistance at 0.7420 (R2). On the daily chart, the completion of a head and shoulders formation and the move below the psychological zone of 0.7500 (R3) signaled the continuation of the prevailing long-term downtrend, in my opinion. Therefore, I would consider any possible future advances as a corrective move of that major down path. I would expect a clear move below 0.7250 (S1) in the future to open the way for the psychological zone of 0.7000 (S2).
• Support: 0.7250 (S1), 0.7000 (S2), 0.6900 (S3)
• Resistance: 0.7350 (R1), 0.7420 (R2), 0.7500 (R3)
GBP/JPY finds support at 193.00
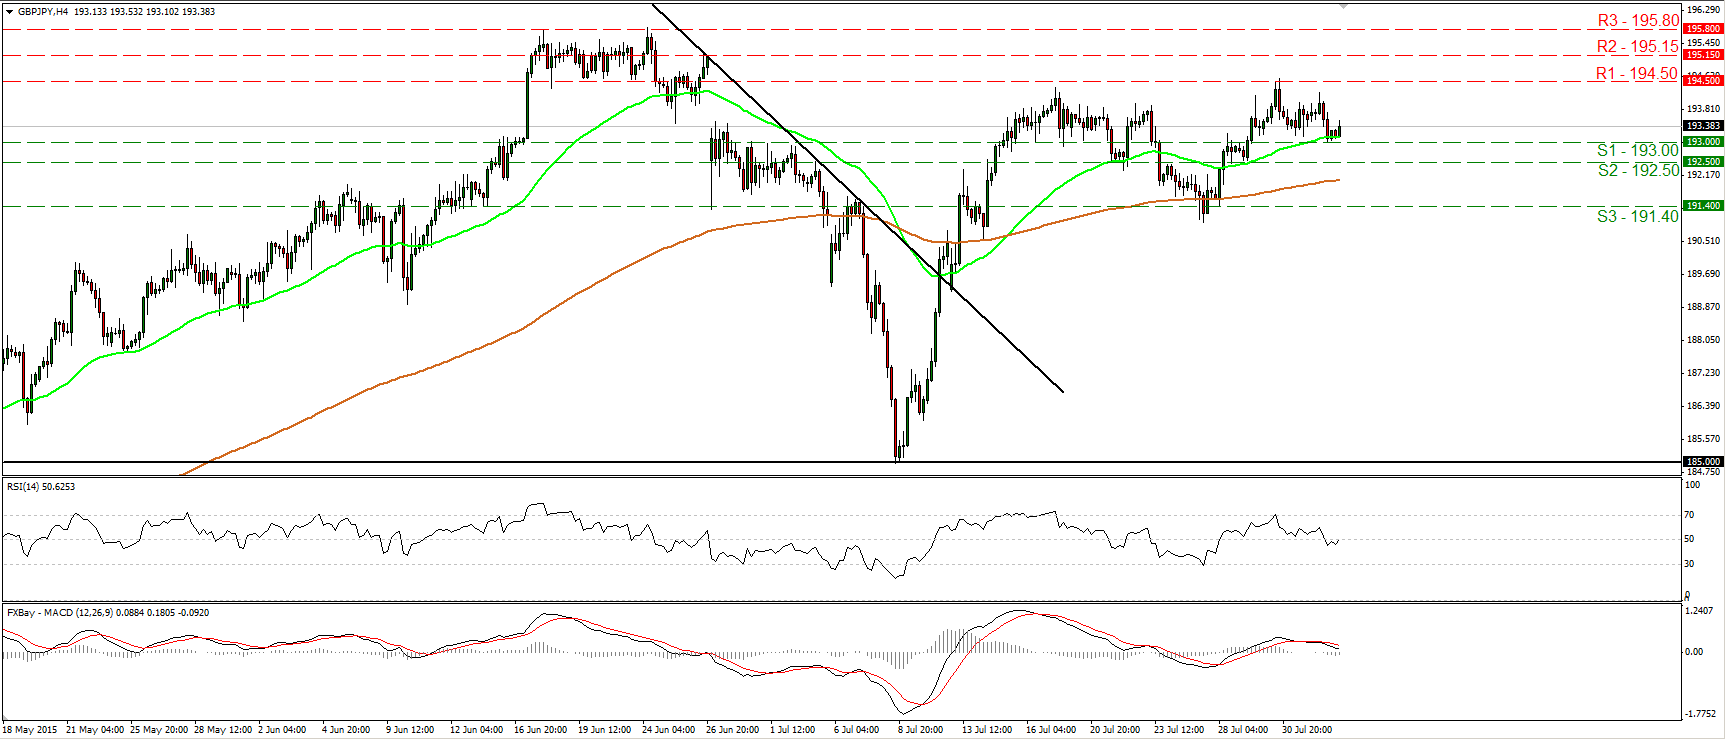
• GBP/JPY declined on Monday, but during the early European morning Tuesday, it hit support at 193.00 (S1) and rebounded. I believe that the short-term outlook is somewhat positive and I would expect the forthcoming wave to be positive, perhaps for another test at the 194.50 (R1) barrier. A break above that level would probably extend the bullish wave and perhaps target the 195.15 (R2) hurdle, marked by the high of the 26th of June. The RSI has bottomed slightly below its 50 line and just poked its nose within its bullish territory, while the MACD, already positive, shows signs of bottoming and could move above its trigger line any time soon. These signs increase the likelihood that GBP/JPY might trade higher in the near term. On the daily chart, I see that on the 8th of July, the rate rebounded from the 185.00 psychological zone, which stands pretty close to the 50% retracement level of the 14th of April – 24th of June rally. As a result, I would consider the overall path of this pair to be to the upside as well.
• Support: 193.00 (S1), 192.50 (S2), 191.40 (S3)
• Resistance: 194.50 (R1), 195.15 (R2), 195.80 (R3)
Gold falls back to 1080
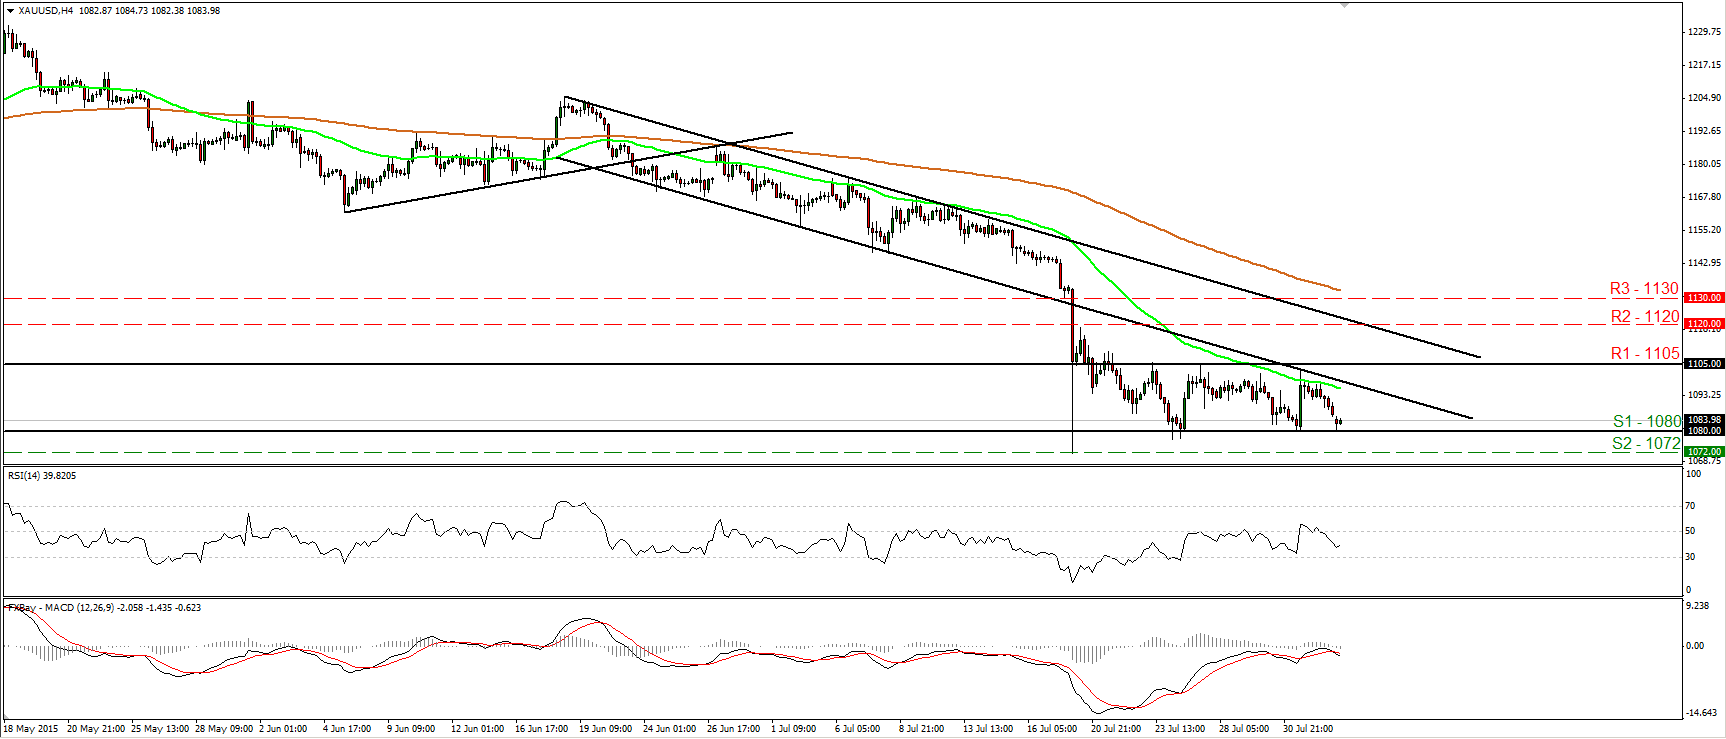
• Gold tumbled on Monday to hit once again the support zone of 1080 (S1). The metal has been oscillating between that support area and the resistance of 1105 (R1) since the 21st of July, and therefore, I would consider the short-term picture to be neutral. A break below 1080 (S1) is likely to shift the bias to the negative and perhaps bring into play the 1072 (S2) barrier marked by the low of the 20th of July. A break below that hurdle would set the stage for more bearish extensions and perhaps target the 1060 (S3) zone. Our short-term oscillators reveal negative momentum and increase the likelihood of the metal exiting the sideways range to the downside. In the bigger picture, the plunge on the 20th of July triggered the continuation of the longer-term downtrend and kept the overall bias of the yellow metal to the downside, in my view.
• Support: 1080 (S1), 1072 (S2), 1060 (S3)
• Resistance: 1105 (R1), 1120 (R2), 1130 (R3)
DAX trades higher and hits resistance at 11470
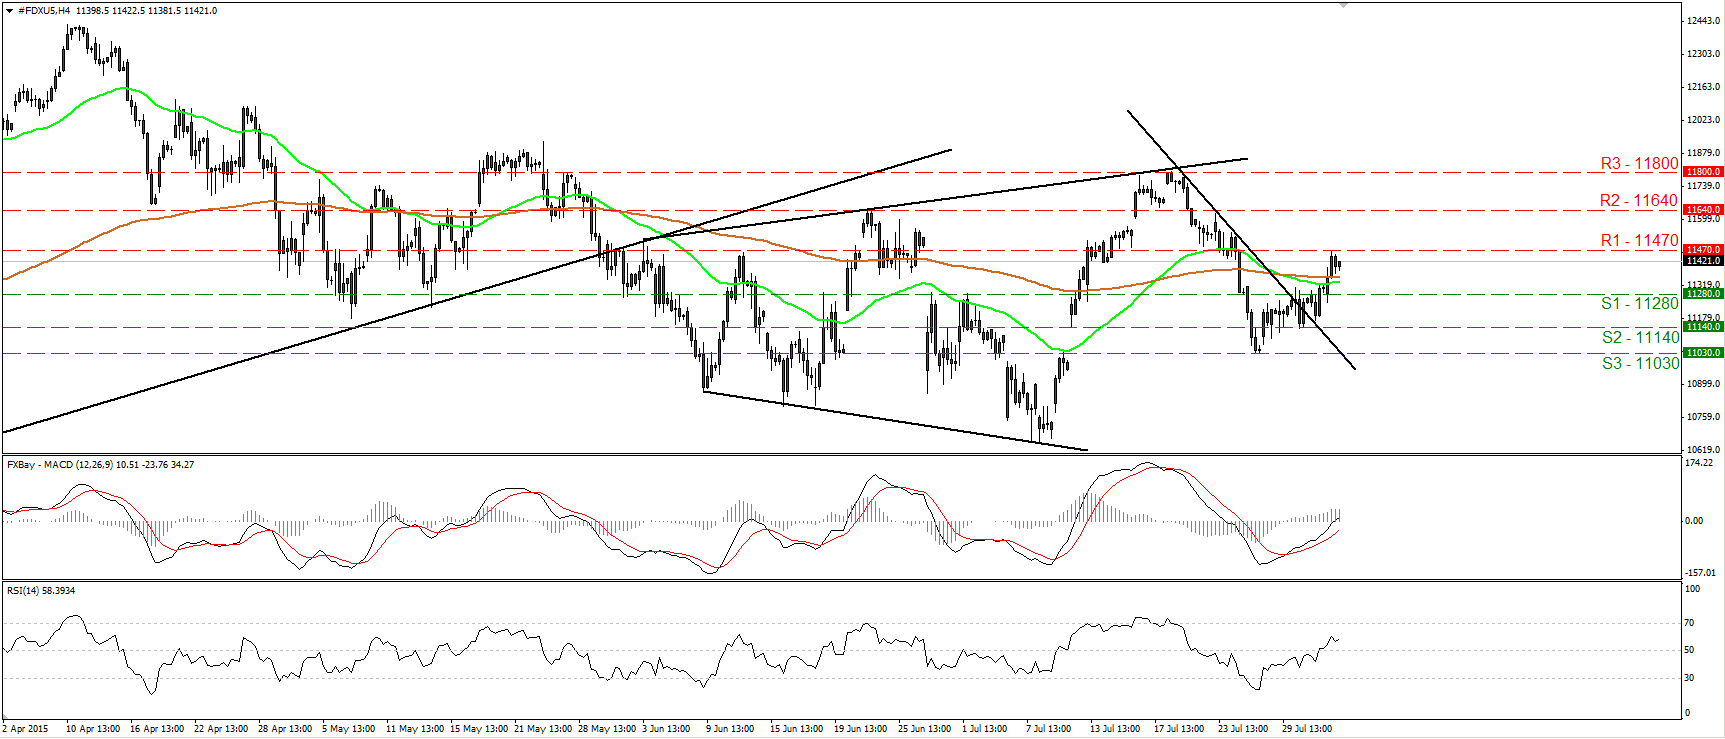
• DAX futures continued trading north on Monday, but the advance was halted at 11470 (R1). Since the index has broken the short-term downtrend line taken from the peak of the 21st of July, I would consider the near-term bias to have turned positive. As a result, I would expect a clear move above 11470 (R1) to open the way for the next resistance at 11640 (R2). Our short-term oscillators detect upside speed and corroborate my view. The RSI emerged above its 50 line, while the MACD, already above its trigger line, has turned positive. As for the broader trend, given the 20th -27th July plunge, I would switch my stance to neutral. I would like to see a clear close above 11800 (R3) before I get confident on the continuation of the major upside path. On the downside, only a daily close below 10670 would confirm a forthcoming lower low on the daily chart and turn the overall bias of DAX to the downside.
• Support: 11280 (S1), 11140 (S2), 11030 (S3)
• Resistance: 11470 (R1) 11640 (R2), 11800 (R3)

