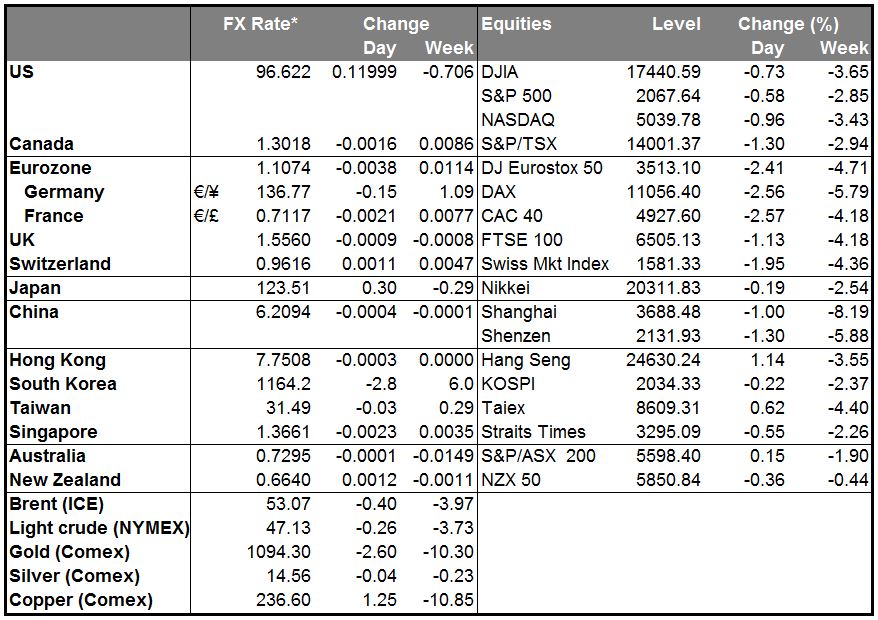
•More of the same: China lower, commodities lower, Fed funds lower, dollar lower It was more or less the same pattern Monday as on Friday. With Chinese stocks collapsing and commodities continuing to fall, Fed funds rate expectations continued to retreat and the dollar lost ground against most of its G10 counterparts. The move was aided by a stronger-than-expected Ifo survey. EM currencies, meanwhile, generally fell against the dollar, with TRY once again leading the way on geopolitical concerns, followed by the currencies of the commodity countries, particularly the oil producers as oil prices lurched lower.
•Some of the eastern European currencies did rather well, however, such as PLN, HUF and CZK. These countries are likely to benefit from stronger European growth, as indicated by yesterday’s Ifo survey, and as oil importers, they will also benefit from lower oil prices. It depends on how the fall in commodities is viewed. So far, it’s being viewed as the equivalent of a tax cut – something that leaves more money in the hands of consumers. The question is if commodity prices continue to fall, will the decline be seen as an indication of weak demand? That may be the implication from the rally in US bonds. Note that European bonds did not gain yesterday, which is intriguing considering that European stocks were down sharply.
•In any case, the dollar’s rate advantage narrowed slightly and the currency weakened as a result. Whether this trend continues depends a lot on what the FOMC says tomorrow. I expect that the turmoil in Chinese stocks will not derail that Committee and that the statement will echo Fed Chair Yellen’s recent comments about being on track to tighten later this year. That should support the dollar.
•Chinese stock rout could set off another round of currency wars As Chinese stocks collapse, the Chinese government has been taking various measures to shore up the market. Some of them involve direct involvement with the market itself, while others try to improve the macroeconomic background for stocks, e.g. cutting the required reserve ratio for banks. On Friday, the State Council published a set of policy initiatives to promote trade. Exports have been falling on a yoy basis recently, a relatively unusual event for China over the last two decades. The Council probably hopes to boost exports and aid manufacturing, which has been contracting recently, according to the latest PMI report.
The Market
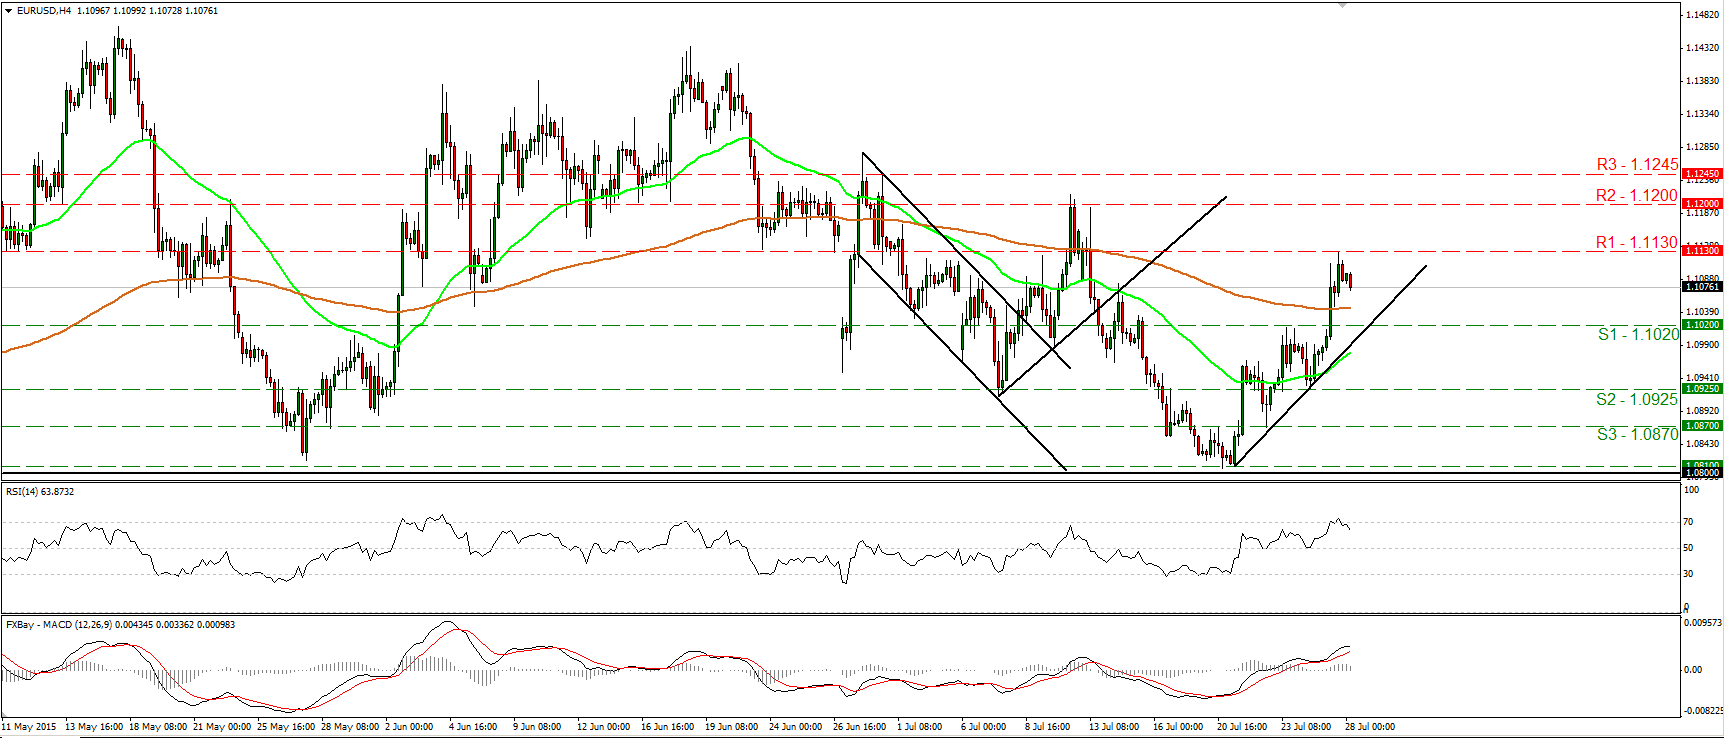
EUR/USD surges and hits 1.1130
• EUR/USD raced higher on Tuesday, breaking above the resistance (now turned into support) of 1.1020 (S1). On the 4-hour chart, the price structure still suggests a short-term uptrend, Therefore, I would expect a clear break above 1.1130 (R1) to set the stage for extensions towards the 1.1200 (R2) hurdle. But before that, I believe that we are likely to experience a corrective move, perhaps to challenge the 1.1020 (S1) barrier as a support this time. Our short-term oscillators support the case for a pullback as well. The RSI exited its above-70 territory and is now pointing down, while the MACD shows signs of topping and could fall below its trigger line soon. As for the bigger picture, as long as the pair is trading between 1.0800 and 1.1500, I would see a neutral longer-term picture. I believe that a move above the psychological zone of 1.1500 is the move that could carry larger bullish implications, while a break below 1.0800 is needed to confirm a forthcoming lower low on the daily chart and perhaps turn the overall bias back to the downside.
• Support: 1.1020 (S1), 1.0925 (S2), 1.0870 (S3)
• Resistance: 1.1130 (R1), 1.1200 (R2), 1.1245 (R3)
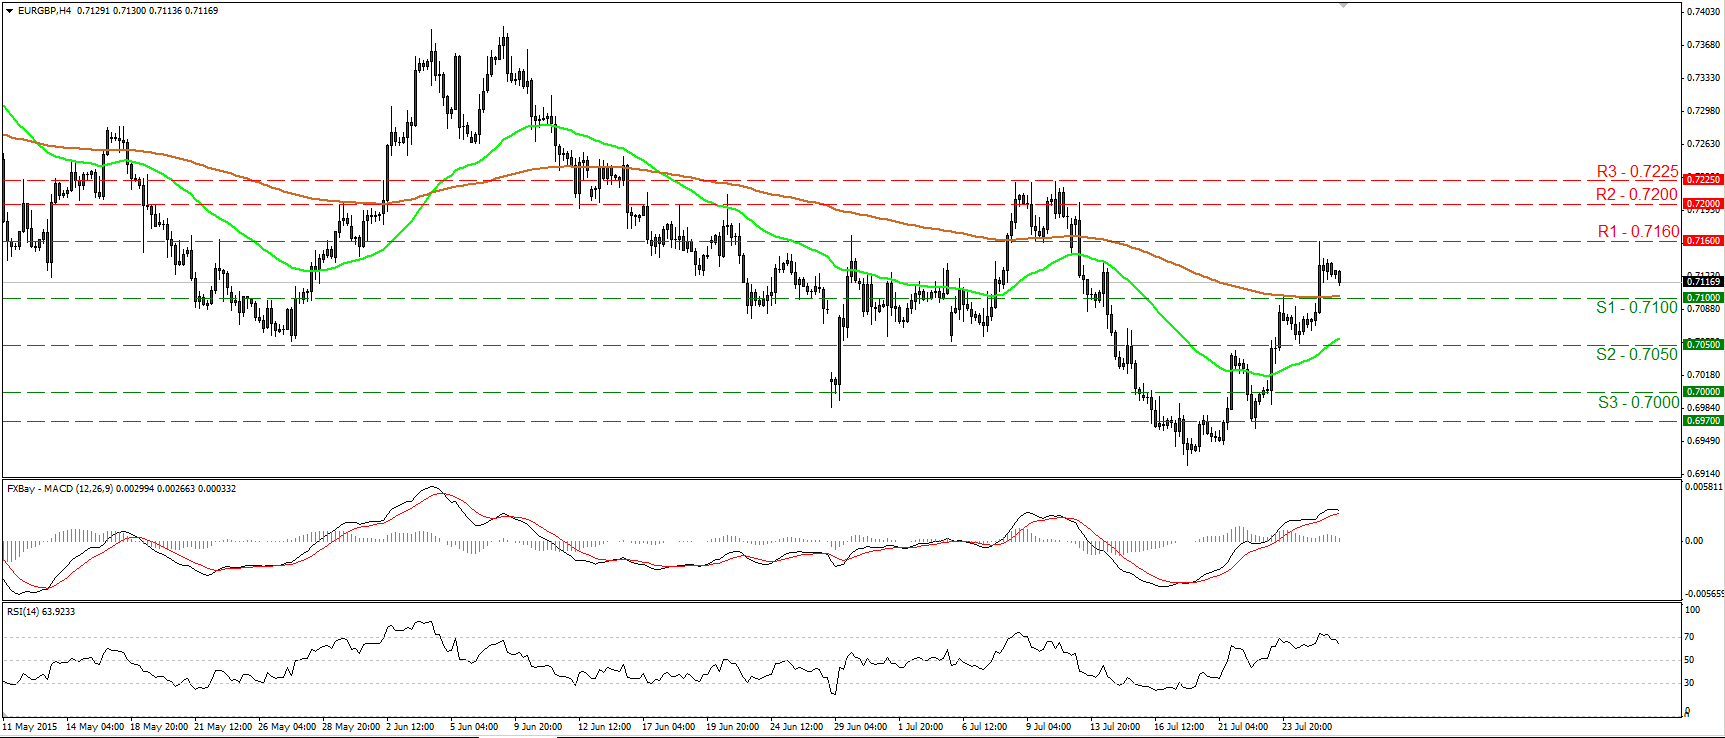
EUR/GBP rallies and hits 0.7160
• EUR/GBP traded higher on Tuesday, breaking above the 0.7100 (S1) barrier and hit resistance at 0.7160 (R1).
• The price structure on the 4-hour chart remains higher peaks and higher troughs, and this prints a positive short-term picture in my opinion. I would expect a clear break above the 0.7160 (R1) obstacle to extend the trend and perhaps challenge the next resistance at 0.7200 (R2), marked by the high of the 13th of July. Nevertheless, I would expect a downside corrective move before the next positive leg, perhaps to challenge the 0.7100 (S1) zone as a support. Our oscillators amplify the case that a downside correction could be on the cards before the bulls shoot again. The RSI exited its above-70 territory and is pointing down, while the MACD has topped and could fall below its trigger soon. On the daily chart, I still see a longer-term downtrend, thus I would consider the short-term uptrend to be a corrective phase of the overall down path.
• Support: 0.7100 (S1), 0.7050 (S2), 0.7000 (S3)
• Resistance: 0.7160 (R1), 0.7200 (R2), 0.7225 (R3)
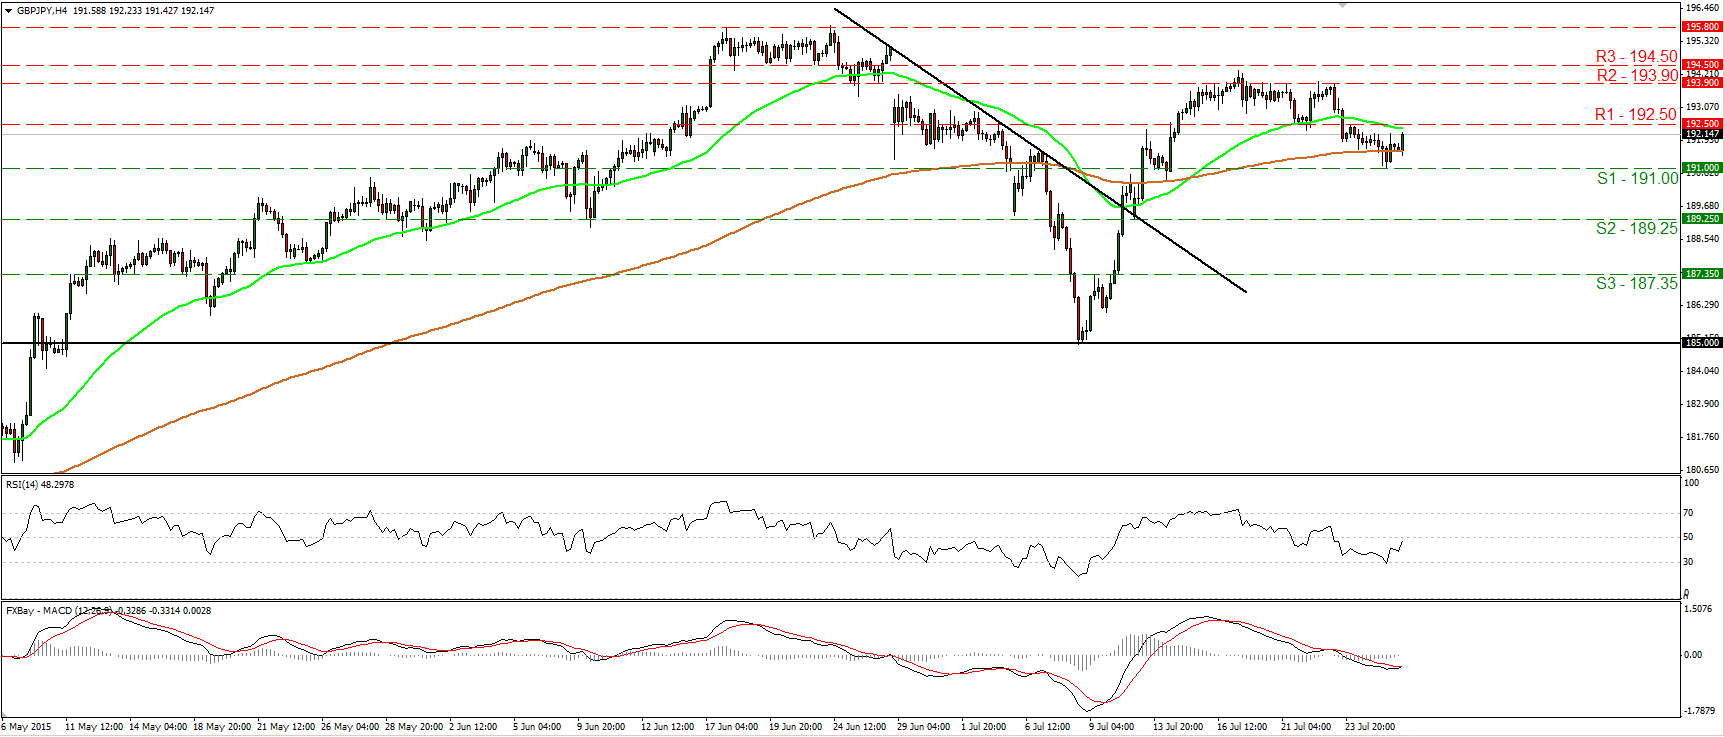
GBP/JPY hits support at 191.00 and rebounds
• GBP/JPY hit support at 191.00 (S1), and rebounded. Although the short-term trend seems to be negative, I would expect the upside move to continue. The rate is now headed towards 192.50 (R1), where an upside break is possible to open the way for the next resistance of 193.90 (R2). Our short-term oscillators support the notion. The RSI hit support at its 30 line and edged higher. It is now headed towards its 50 line, while the MACD, although negative, shows signs of bottoming and could cross above its trigger line soon. On the daily chart, I see that on the 8th of July, the rate rebounded from the 185.00 psychological zone, which stands pretty close to the 50% retracement level of the 14th of April – 24th of June rally. As a result, I would consider the overall path of this pair to still be to the upside.
• Support: 191.00 (S1), 189.25 (S2), 187.35 (S3)
• Resistance: 192.50 (R1), 193.90 (R2), 194.50 (R3)
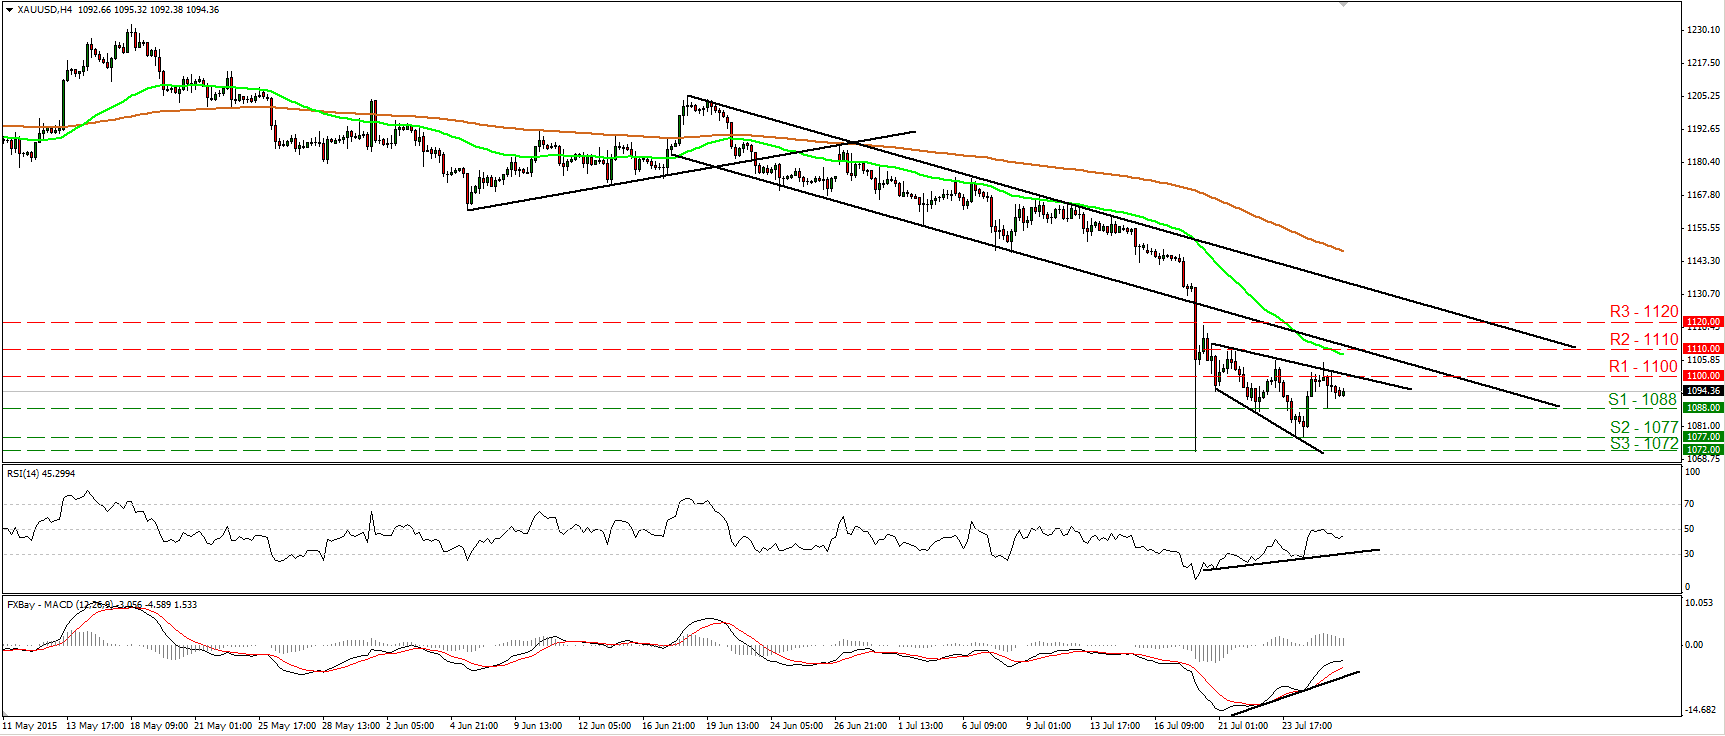
Gold trades somewhat lower
• Gold traded above 1100 (R1) for a while, but failed to reach the next resistance of 1110 (R2), and retreated back below 1100 (R1). As long as the metal is printing lower peaks and lower troughs below the lower line of the short-term downside channel that had been containing the price action from the 18th of June until the 20th of July, I would consider the short-term outlook to remain negative. I would expect the bears to eventually take control again and to aim for another test at the 1077 (S2) hurdle. Taking a look at our short-term oscillators though, I would be careful about a further upside correction before sellers take charge again. The RSI, although below 50, has turned up again, while the MACD stands above its trigger line and is headed towards its zero line. Moreover, there is positive divergence between both these indicators and the price action. In the bigger picture, the plunge on the 20th of July triggered the continuation of the longer-term downtrend and kept the overall bias of the yellow metal to the downside, in my view.
• Support: 1088 (S1), 1077 (S2), 1072 (S3)
• Resistance: 1100 (R1), 1110 (R2), 1120 (R3)
DAX falls off the cliff
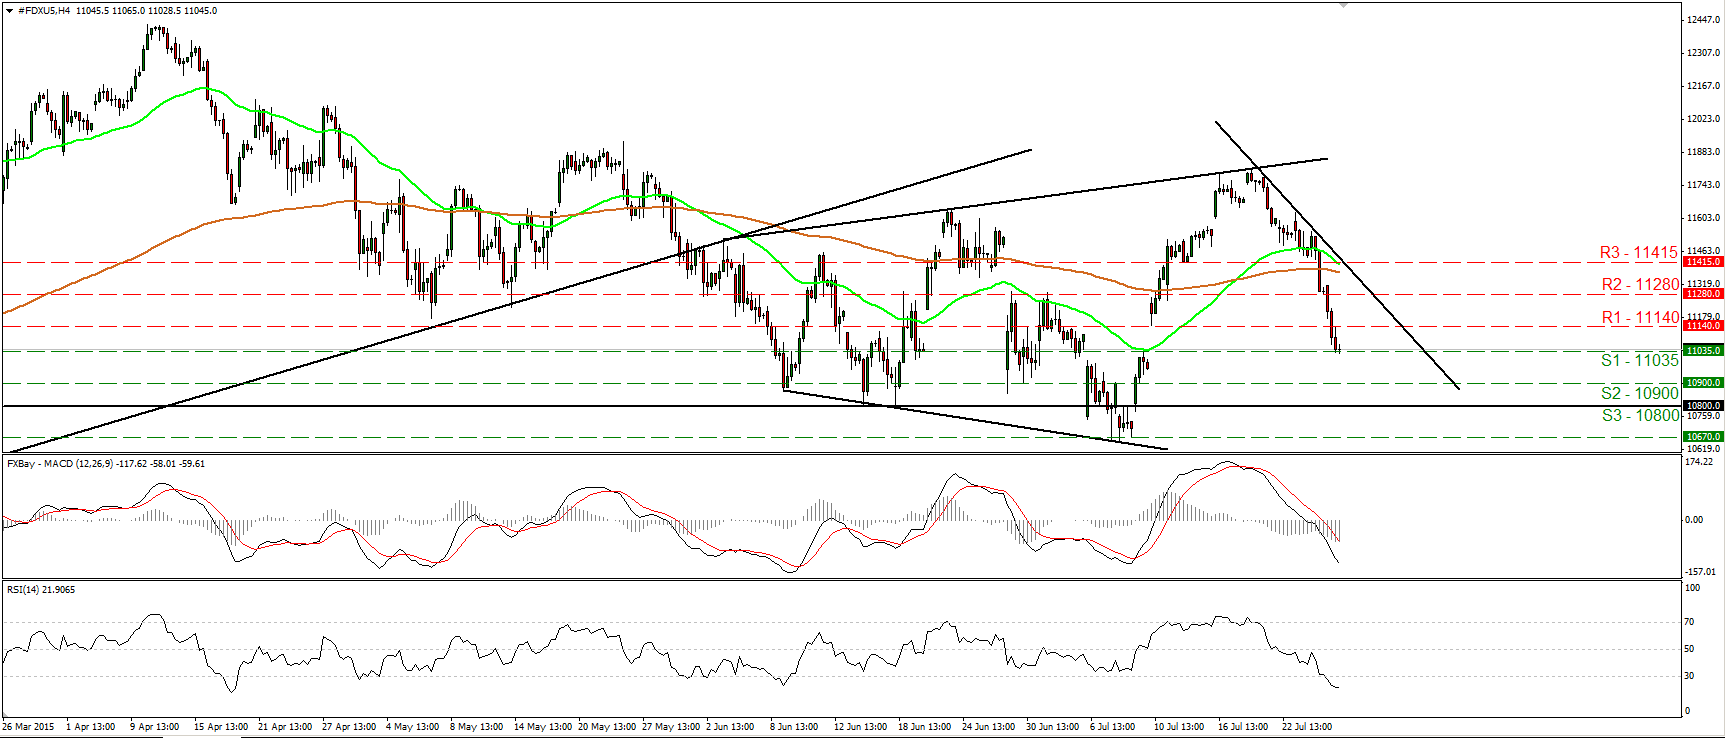
• DAX continued its plunge yesterday, falling below 11280 (R2) and reaching 11035 (S1). The short-term bias remains to the downside in my view, and I would expect a clear move below 11035 (S1) to target our next support of 10900 (S2). Our short-term momentum studies detect strong downside speed and amplify the case for further declines. The MACD stands well below both its zero and trigger lines and points down, while the RSI entered its below-30 territory. Nevertheless, the RSI shows signs that it could start bottoming and as a result I would be careful of a possible corrective bounce before the bears shoot again. As for the broader trend, given the recent plunge, I would switch my stance to neutral. Only a daily close below 10670 would confirm a forthcoming lower low on the daily chart and turn the overall bias of DAX to the downside.
• Support: 11035 (S1), 10900 (S2), 10800 (S3)
• Resistance: 11140 (R1) 11280 (R2), 11415 (R3)

