The MarketEUR/USD breaks below 1.0975 and hits 1.0915
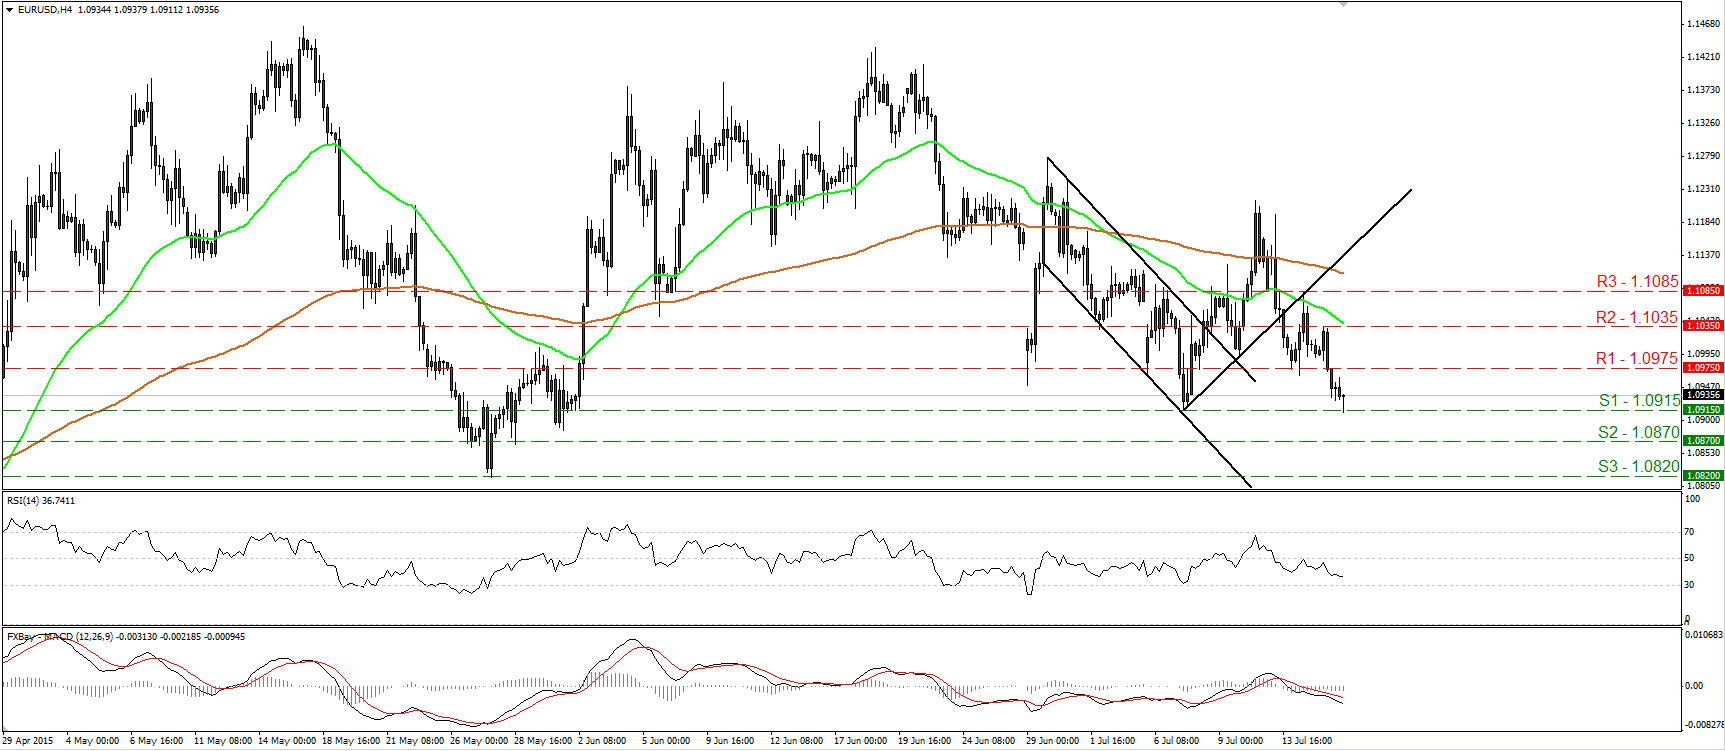
EUR/USD tumbled on Wednesday, fell below the support (now turned into resistance) of 1.0975 (R1), and reached our next hurdle of 1.0915 (S1). This confirmed a forthcoming lower low on the 4-hour chart and kept the short-term picture negative. A decisive move below 1.0915 (S1) is likely to extend the negative wave and perhaps pave the way for our next support at 1.0870 (S2). Our momentum studies detect negative momentum and support the notion. The RSI hit resistance marginally below its 50 line and raced lower, while the MACD stands below both its zero and signal lines, pointing down. However, I believe that much of today’s movement will depend on the press conference following the ECB policy meeting. The market will focus on how the ECB may respond after Greece accepted the reforms needed to get a third bailout package. As for the bigger picture, I maintain my flat stance. I believe that a move above the psychological zone of 1.1500 is the move that could carry larger bullish implications, while a break below 1.0800 is needed to confirm a forthcoming lower low on the daily chart and perhaps turn the overall bias back to the downside.
Support: 1.0915 (S1), 1.0870 (S2), 1.0820 (S3)
Resistance: 1.0975 (R1), 1.1035 (R2), 1.1085 (R3)
GBP/USD hits resistance at 1.5675 and pulls back
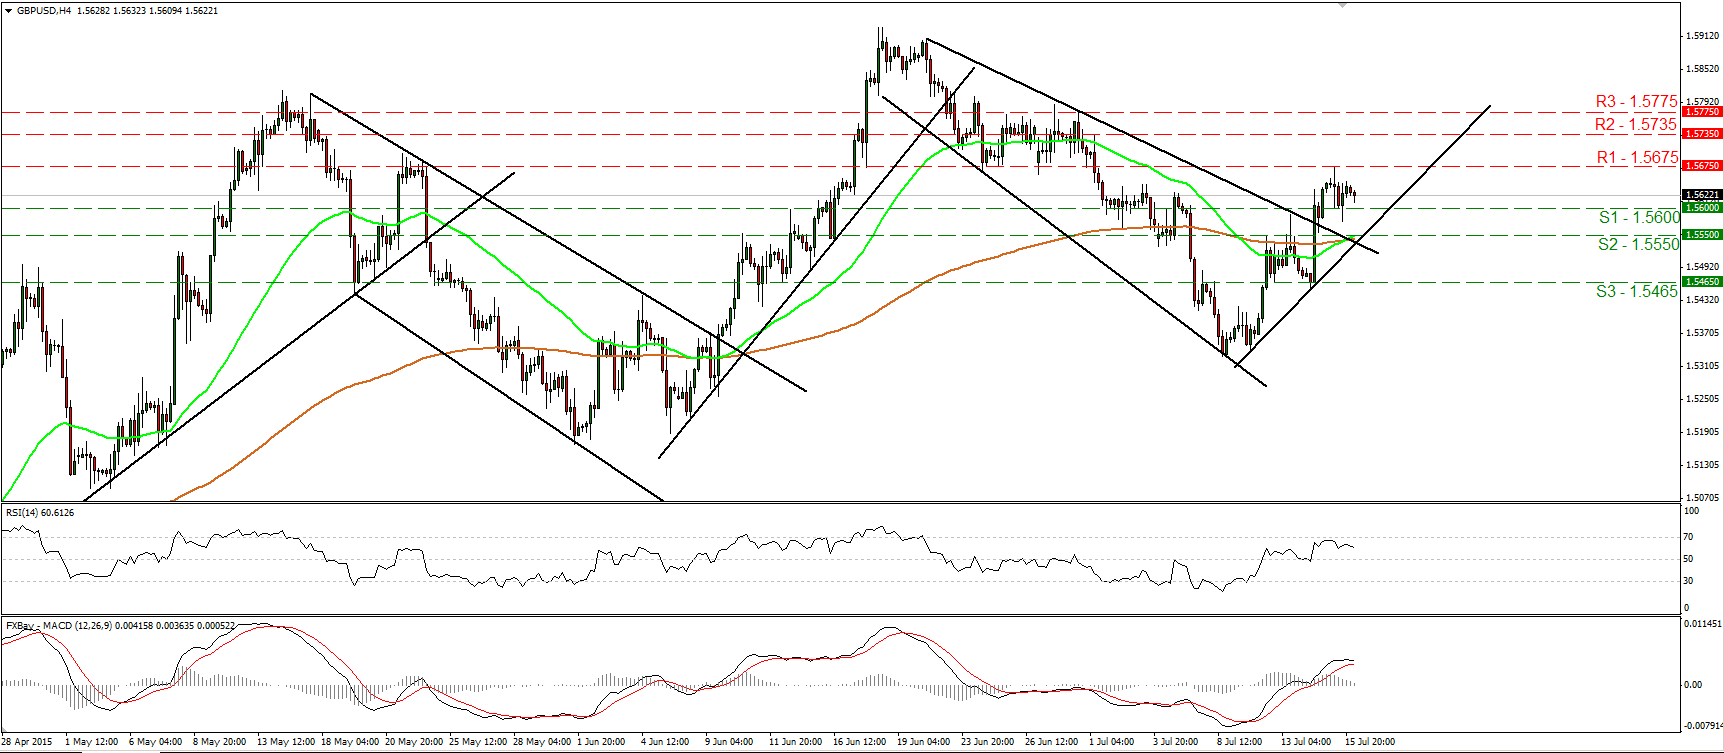
GBP/USD traded lower on Wednesday after the UK unemployment rate rose in May, and after average weekly earnings for the same month accelerated less than expected. The rate hit resistance at 1.5675 (R1) after the releases, and tumbled to find support slightly below the 1.5600 (S1) line. Subsequently, it recovered some of its losses. As long as the cable is trading above the downtrend line taken from the peak of the 22nd of June and above the uptrend line drawn from the 9th of July, I would consider the short-term path to be positive. A clear break above the 1.5675 (R1) barrier could open the way for our next resistance hurdle of 1.5735 (R2). Nevertheless, taking a look at our oscillators, I see signs that another pullback could be in the cards before the bulls decide to pull the trigger again. The RSI has turned down after hitting resistance near its 70 line, while the MACD has topped and could fall below its trigger line soon. Switching to the daily chart, I see that cable printed a higher low at around 1.5330, and that is back above the 80-day exponential moving average. As a result, I would consider the overall picture to stay somewhat positive and I would treat the 18th of June – 8th of July decline as a corrective phase.
Support: 1.5600 (S1), 1.5550 (S2), 1.5465 (S3)
Resistance: 1.5675 (R1), 1.5735 (R2), 1.5775 (R3)
EUR/JPY appears ready to challenge 135.00
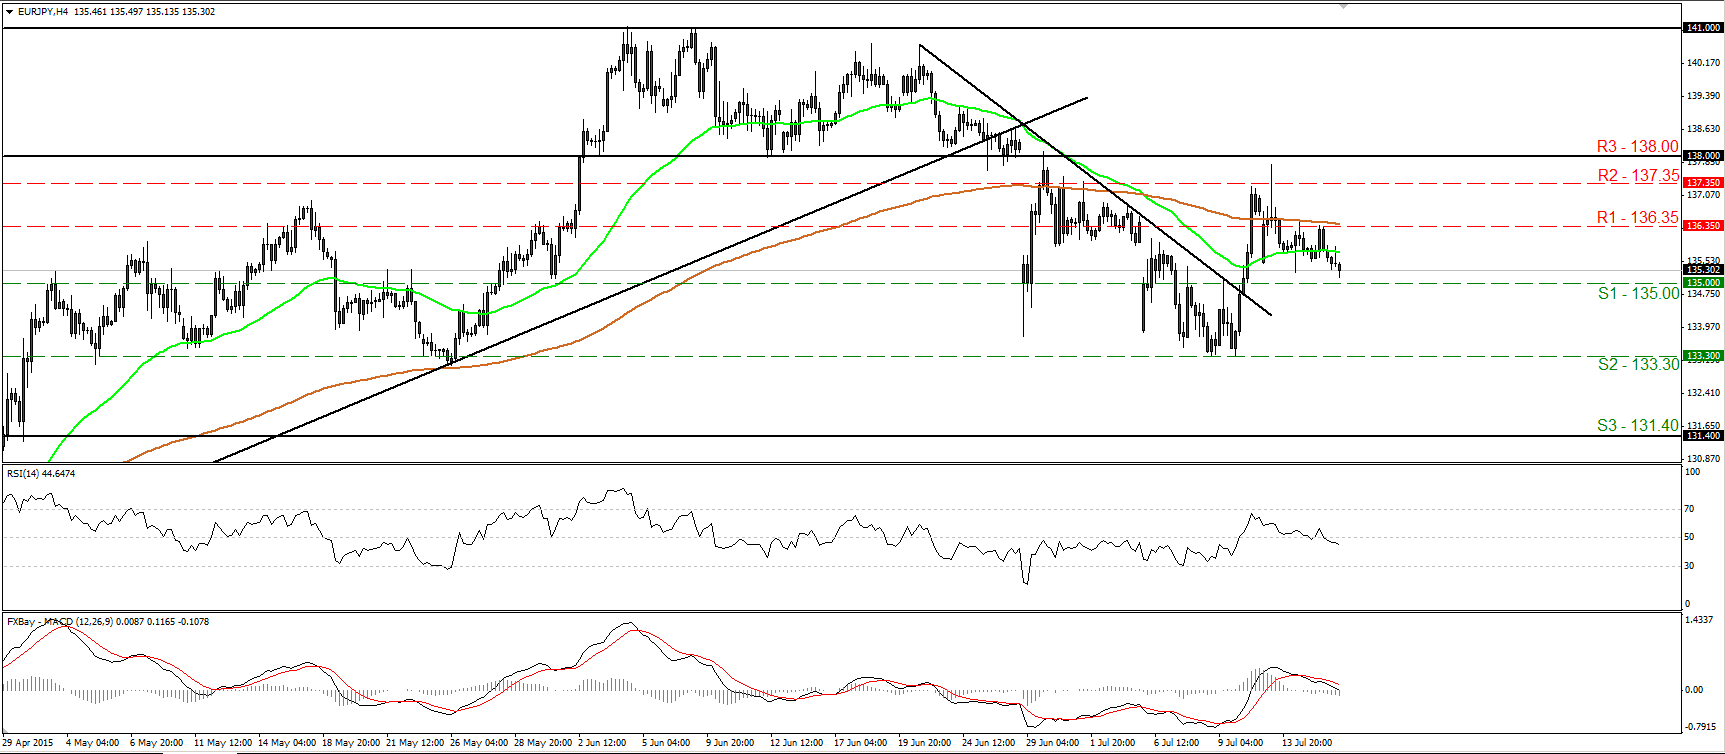
EUR/JPY slid yesterday, after hitting resistance at the 136.35 (R1) barrier. The rate is now headed towards the psychological zone of 135.00 (S1), where a decisive dip is likely to pull the trigger for the well-tested support area of 133.30 (S2). Shifting my attention to our momentum indicators, I see that the RSI fell below its 50 line and points down, while the MACD lies below its trigger line and is headed towards its zero line. These momentum signs corroborate my view and amplify the case for further declines, at least in the short run. On the daily chart, I see that the 133.30 (S2) support area stands marginally below the 50% retracement level of the 14th of April – 4th of June advance. As a result, although I expect some further short-term declines, I would like to see a daily close below that area before I assume that the medium-term picture has turned negative as well.
Support: 135.50 (S1), 133.30 (S2), 131.40 (S3)
Resistance: 137.35 (R1), 138.00 (R2), 139.15 (R3)
DAX futures are headed towards 11600
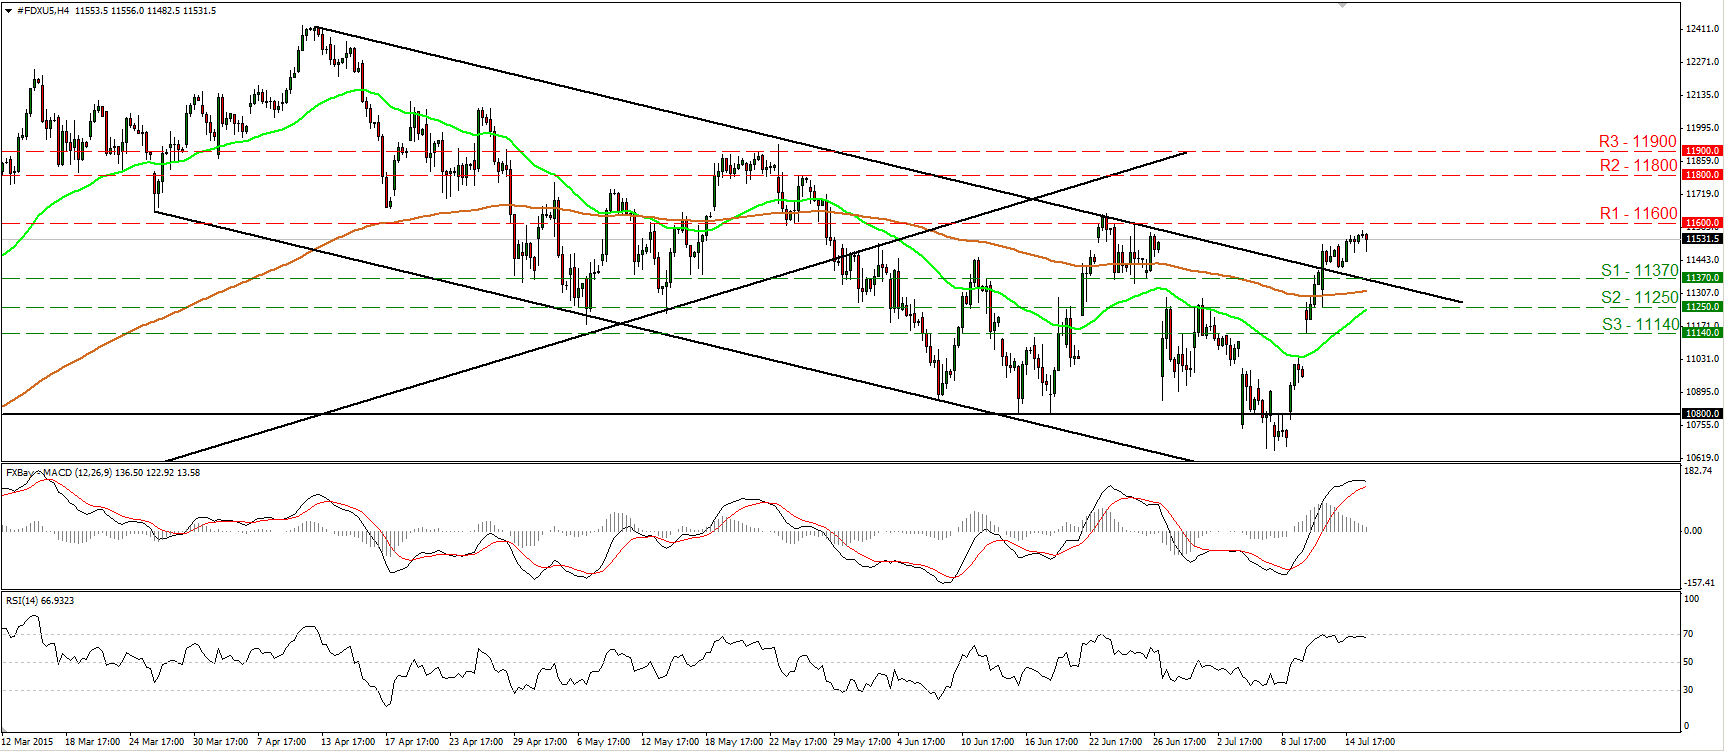
DAX futures traded somewhat higher yesterday, getting closer to our resistance zone of 11600 (R1). As long as the index is trading above the upper bound of the downside channel that had been containing the price action from the last days of March until the 10th of July, I would consider the outlook to stay somewhat positive. If the bears are strong enough to overcome the 11600 (R1) zone, I believe that we are likely to experience extensions towards 11800 (R2). Nevertheless, looking at our near-term momentum studies, I see signs that a corrective pullback could be looming before buyers take in change again. The RSI hit resistance near its 70 line and turned down, while the MACD has topped and could fall below its trigger line soon. Plotting the daily chart, I see that the move out of the channel on Monday is a first sign that the 10th of April – 8th of July decline was just a corrective phase of the prior uptrend. What is more, the recent rally also confirmed the positive divergence between our daily oscillators and the price action.
Support: 11370 (S1), 11250 (S2), 11140 (S3)
Resistance: 11600 (R1) 11800 (R2), 11900 (R3)
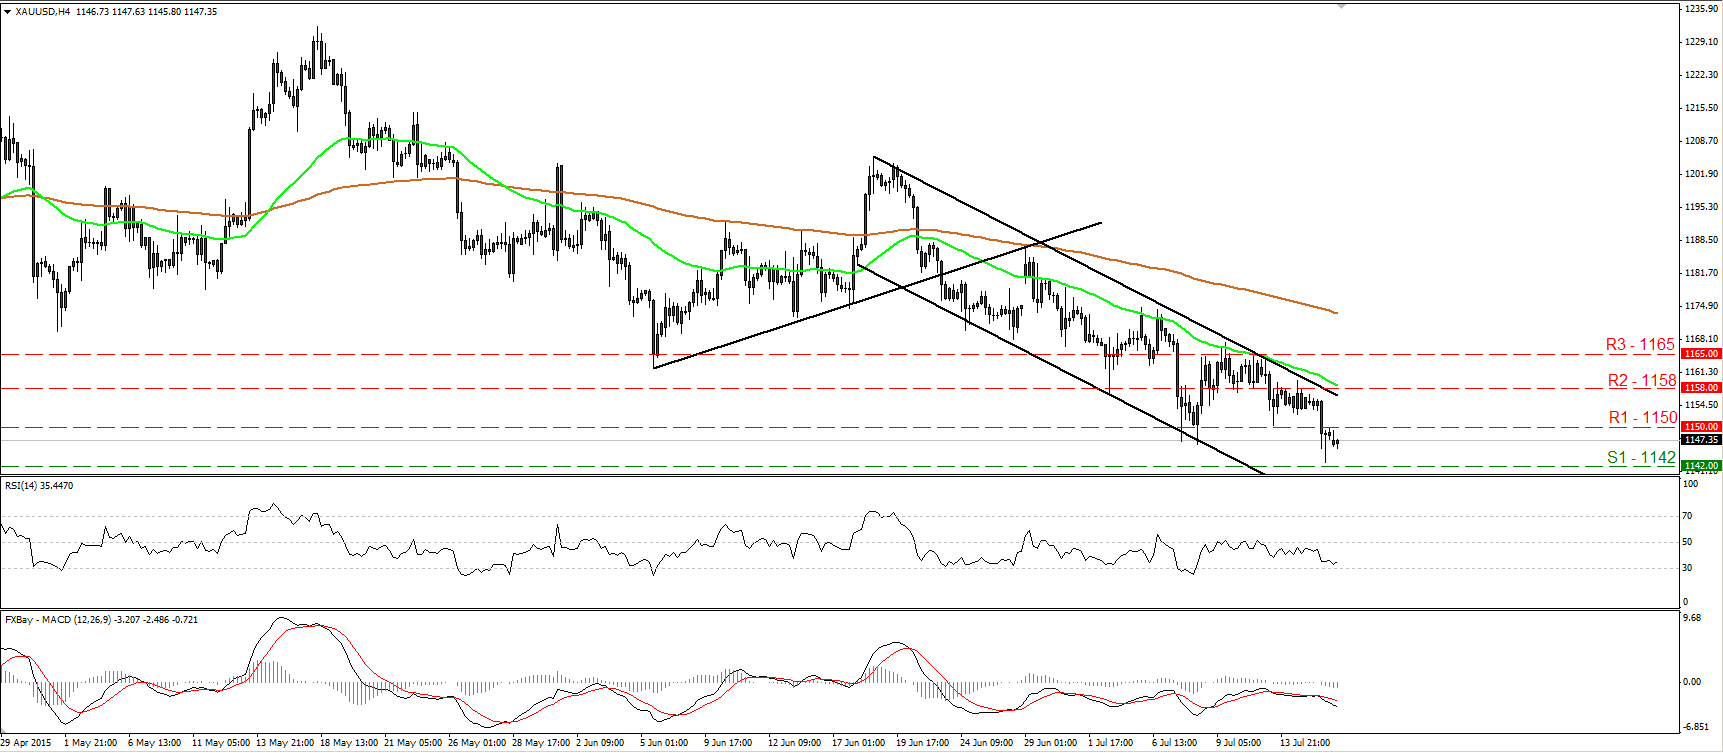
Gold breaks below 1150
Gold slid on Wednesday, falling below the 1150 (R1) barrier and hitting support fractionally above our support line of 1142 (S1). As long as the metal is trading within the short-term downside channel that had been containing the price action since the 18th of June, I would consider the short-term outlook to remain negative. I would expect a break below the 1142 (S1) barrier to pull the trigger for our next support area of 1132 (S2), defined by the low of the 7th of November 2014. The RSI, already within its bearish territory, continued lower and now lies near its 30 line, while the MACD, already negative, has topped and fallen below its signal line. On the daily chart, the tumble towards 1142 (S1) confirmed another forthcoming lower low and kept the overall picture of the yellow metal somewhat negative.
Support: 1142 (S1), 1132 (S2), 1120 (S3)
Resistance: 1150 (R1), 1158 (R2), 1165 (R3)

