• Expectations of a Fed rate hike are back in focus The dollar was strong on Monday after Greek debt crisis talks finally ended with an agreement and allowed the market to shift its attention back on Fed rate hike expectations. With Grexit seemingly averted, investors will focus on the semi-annual testimony by Fed Chair Yellen and whether she will give any hints regarding the timing of a rate lift-of. However, the Greek drama has still to enter its final act, as the Greek PM must pass a series of unpopular legislation. In addition, he must set EUR 50bn of “valuable” public sector assets aside to be sold off under the supervision of foreign lenders and get the whole package through parliament by Wednesday before talks on a new bailout program begin. But to pass the proposals through the parliament, the Greek PM will have to rely on support from pro-European opposition parties, as its coalition partner said they will not support the bills. In a sign of how hard it may be to convince his own party to accept the deal, Labor Minister Panos Skourletis said the terms were unviable and would lead to new elections this year.
• Overnight, we had a pretty quiet session in the FX market, with AUD the only exception. The Australian dollar strengthened after the country’s NAB business conditions and business confidence indices both increased in June from the previous month. Nevertheless, given the slowdown in the Chinese economy, Australia’s biggest trading partner, and the lower iron ore prices, I would expect any advances in AUD/USD to be short-lived, and the rate could resume its broader downtrend anytime soon.
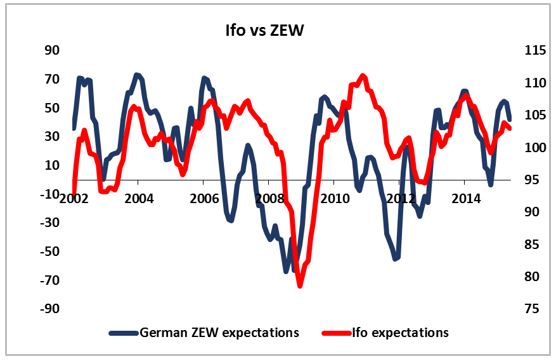
• Today’s highlights: During the European day, we get the German ZEW survey for July. The survey for June added to the weak data coming out from the country, with both indices falling below market expectations. The market consensus is for another decline in the indices, which could add to the evidence that the German economy is losing momentum. However, the impact on the currency was minimal the last few times, as the market focus was on the political developments around Greece rather on the economic data. Assuming that the Greek uncertainty has diminished somewhat, I would expect the market to start paying attention to the economic data again.
• In the UK, the House of Commons Treasury Committee questions BoE Governor Mark Carney, Deputy Governor Jon Cunliffe and MPC members David Miles and Ian McCafferty on the Bank's May Inflation Report. The Bank cut its growth forecast for this year and the next one, but reiterated that the CPI will return to target in 2 years, thus the testimony is unlikely to reveal anything new for the markets other than the next move in rates is more likely than not to be an increase.
• As for the indicators, the UK CPI for June is coming out. In May, the country just barely exited deflation as the headline CPI rate rose to +0.1% yoy. It had been -0.1% yoy in April, the country’s one month in deflation. The figure was in line with market consensus and in line with BoE expectations of a short-lived dip into deflation. Nevertheless, the core rate missed expectations, which suggests that the low inflation is not merely a matter of low oil prices, and prices may not rise, even when the effects of low oil prices fade from the data. Therefore, the focus will be again on the core figure and on any signs of positive upside momentum in prices.
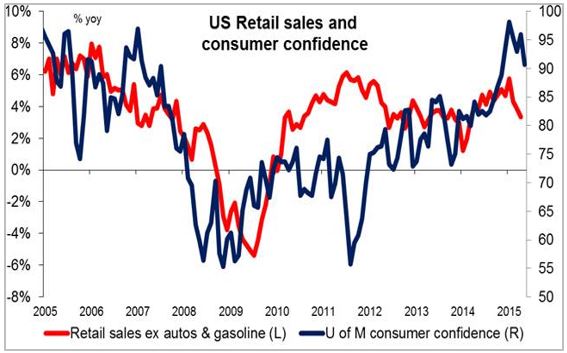
• In the US, retail sales for June are expected to decelerate. May’s figure was strong, while April’s reading, even though revised up a touch, was disappointing. This frustrated investors, who have been looking for signs that the soft Q1 patch is coming to an end. Overall, the data for Q2 show a moderate improvement from the previous quarter, which could support growth somewhat. A positive surprise in June’s figure is needed to keep confidence up and USD supported. The NFIB small business optimism for June is expected to have increased a bit. While this indicator is not particularly market-affecting, it’s well worth watching because of the Fed’s emphasis on employment.
The Market
EUR/USD hits resistance slightly below 1.1200 and then plunges
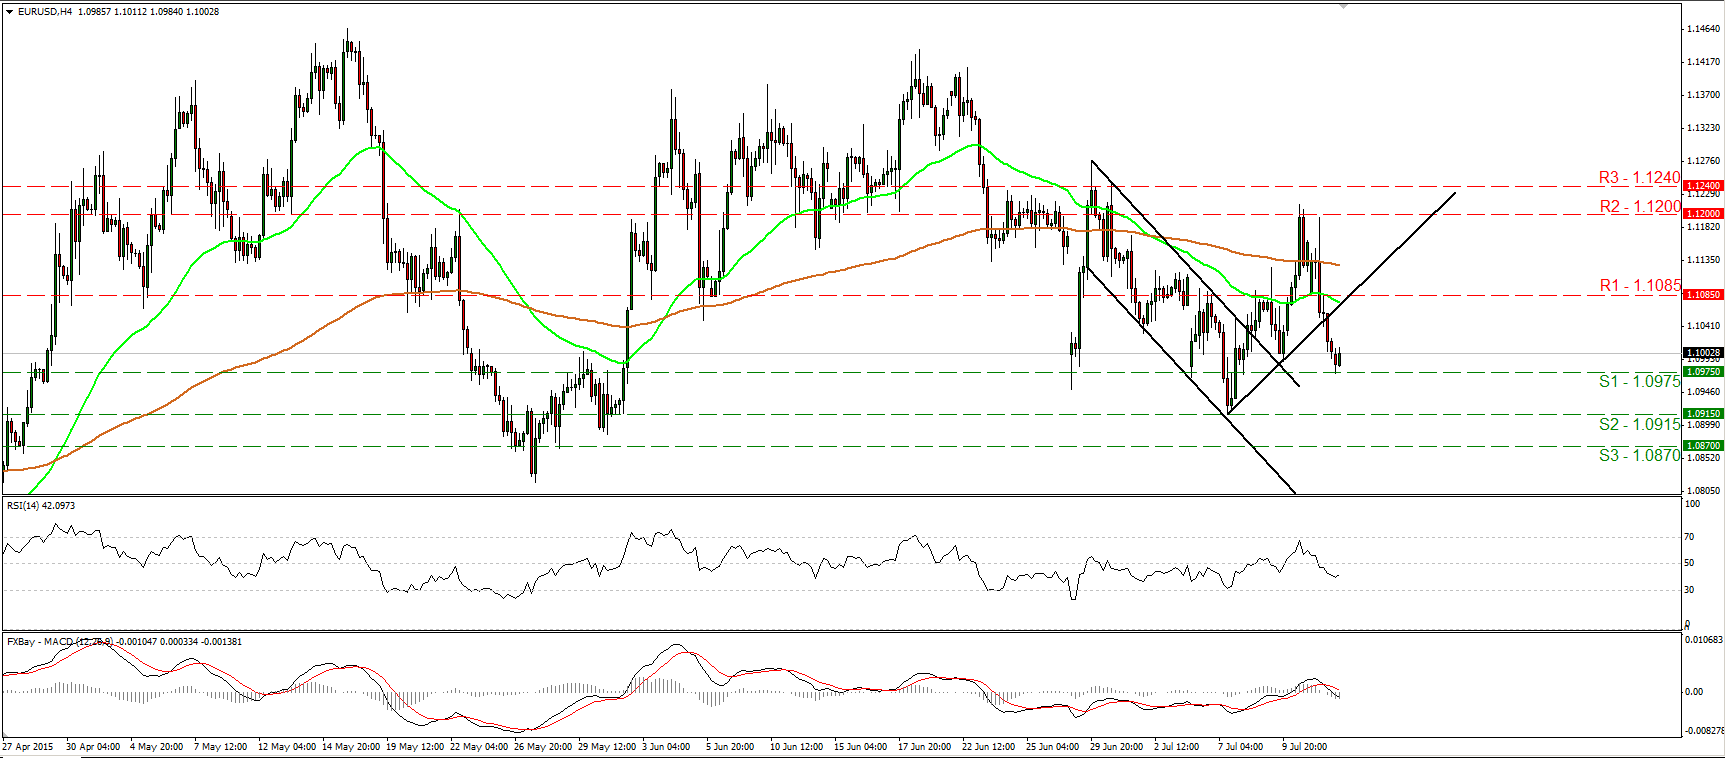
• EUR/USD raced higher on Monday, but hit resistance fractionally below the 1.1200 (R2) resistance hurdle. Subsequently, the rate plunged, fell below the short-term uptrend line taken from the low of the 7th of July, and found support at 1.0975 (S1). The intraday bias has now turned negative, and therefore, I would expect a move below 1.0975 (S1) to set the stage for extensions towards our next support hurdle of 1.0915 (S3). Our oscillators detect negative momentum and corroborate my stance that further declines could be in the cards. The MACD, already below its trigger line, has just obtained a negative sign, while the RSI has fallen below its 50 line. Nevertheless, the RSI has now turned somewhat up, giving evidence that a minor bounce could be looming before the bears take in charge again. As for the bigger picture, I maintain my flat stance. I believe that a move above the psychological zone of 1.1500 is the move that could carry larger bullish implications, while a break below 1.0800 is needed to confirm a forthcoming lower low on the daily chart and perhaps turn the overall bias back to the downside.
• Support: 1.0975 (S1), 1.0915 (S2), 1.0870 (S3)
• Resistance: 1.1085 (R1), 1.1200 (R2), 1.1240 (R3)
EUR/GBP falls after a short-term double top
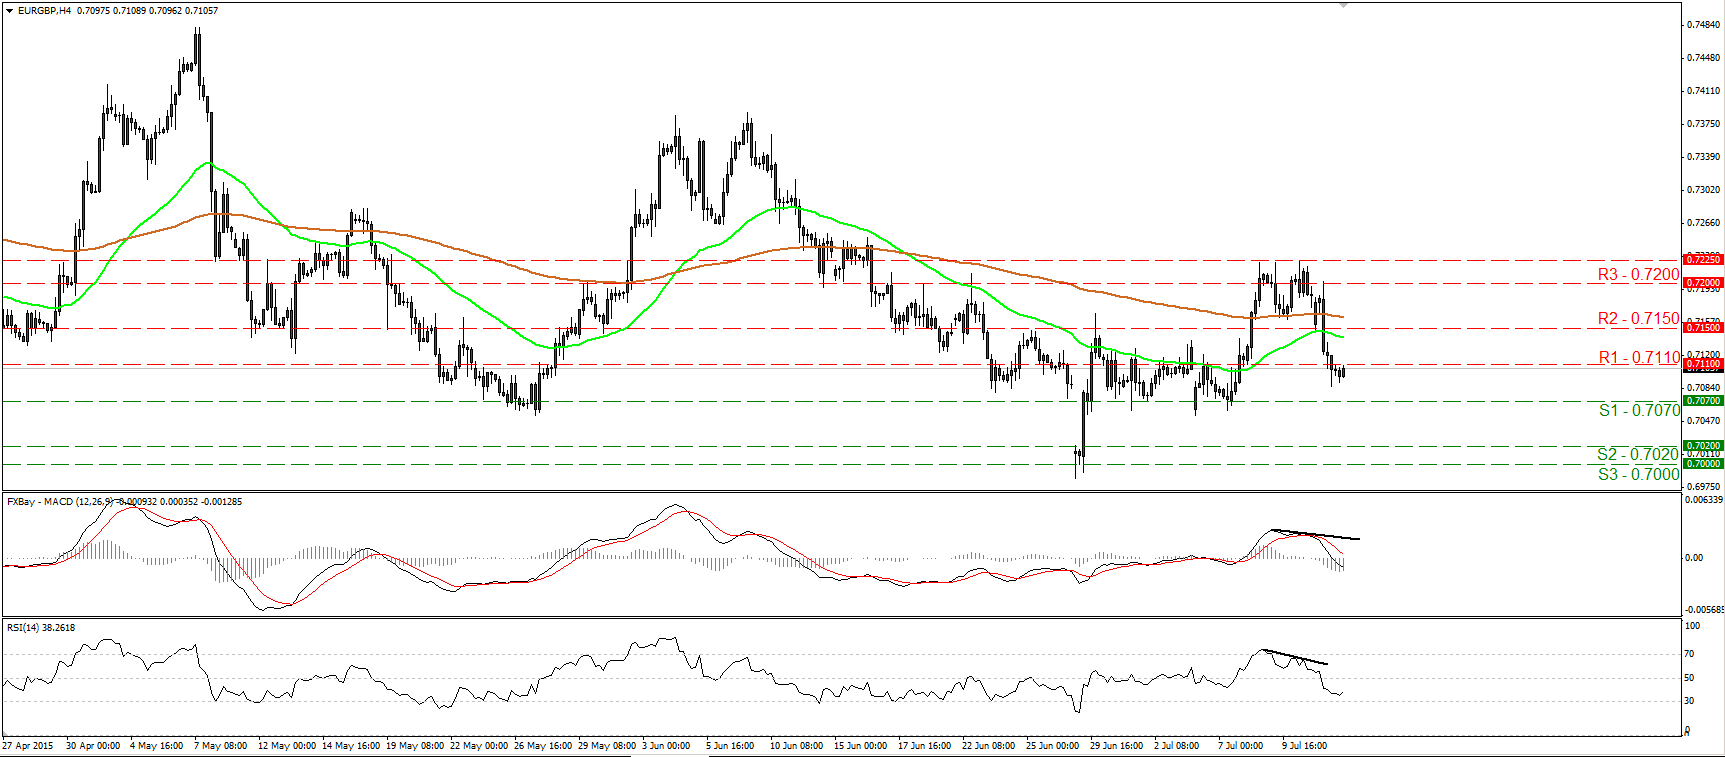
• EUR/GBP tumbled on Monday, completing a minor-term double top formation. Currently, the rate is trading slightly below the support barrier of 0.7110 (R1), and thus I would expect further bearish extensions, perhaps towards the 0.7070 (S1) zone. Looking at our short-term oscillators, I see that the MACD stands below both its zero and signal lines, pointing south, but the RSI, although below 50, has turned somewhat up. This reveals that a minor bounce back above 0.7110 (R1) is possible before sellers seize control again. As for the bigger picture, although the rate printed a lower low on the 29th of June, I see positive divergence between both the daily momentum studies and the price action. As a result, I prefer to stay flat as far as the broader trend is concerned. I would like to see a clear close below the psychological zone of 0.7000 (S3) before I get confident that the prevailing long-term downtrend is back in force.
• Support: 0.7070 (S1), 0.7020 (S2), 0.7000 (S3)
• Resistance: 0.7110 (R1), 0.7150 (R2), 0.7200 (R3)
USD/JPY breaks a downtrend line and hits the resistance of 123.75
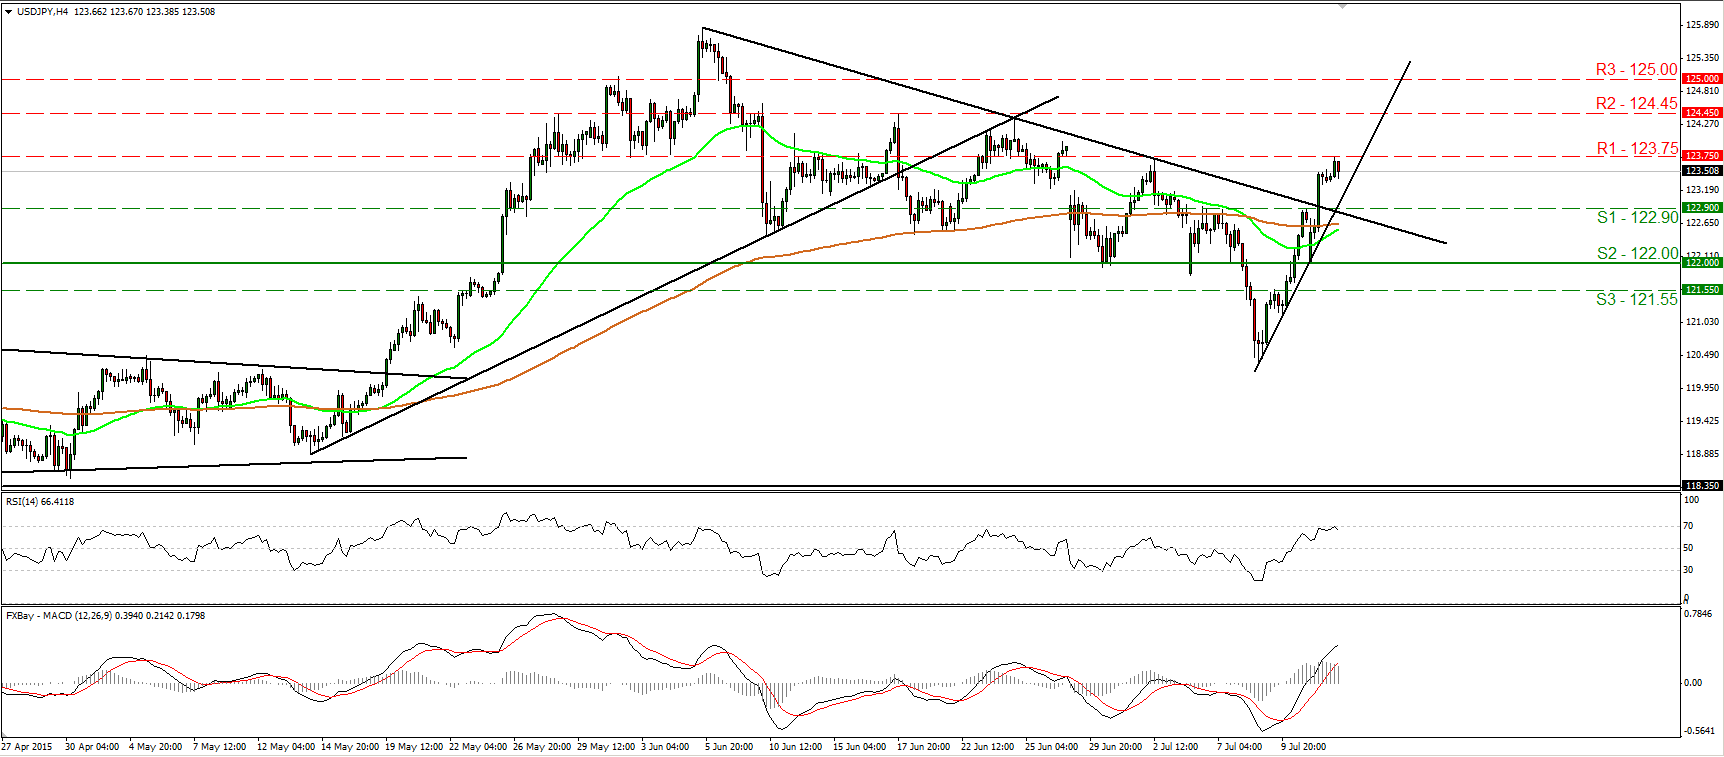
• USD/JPY traded higher yesterday, breaking above the downtrend line taken from the peak of the 5th of June. Nevertheless, the advance was halted by the 123.75 (R1) barrier, marked by the high of the 2nd of July. As long as USD/JPY is trading above the aforementioned downtrend line, and above the short-term uptrend line taken from the low of the 8th of July, I would see a positive near-term picture. I would expect a decisive break above 123.75 (R1) to open the way for the next resistance at 124.45 (R2). Nonetheless, taking a look at our oscillators, I see the likelihood of a pullback before the bulls shoot again. The MACD stands well above both its zero and trigger lines, indicating positive momentum, but the RSI hit resistance near its 70 line and turned down. Switching to the daily chart, I believe that the recent rally is a first sign that the 5th of June – 8th of July decline was just a corrective phase and that the longer-term uptrend is gearing up again.
• Support: 122.90 (S1), 122.00 (S2), 121.55 (S3)
• Resistance: 123.75 (R1), 124.45 (R2), 125.00 (R3)
Gold trades lower after hitting the upper bound of a channel
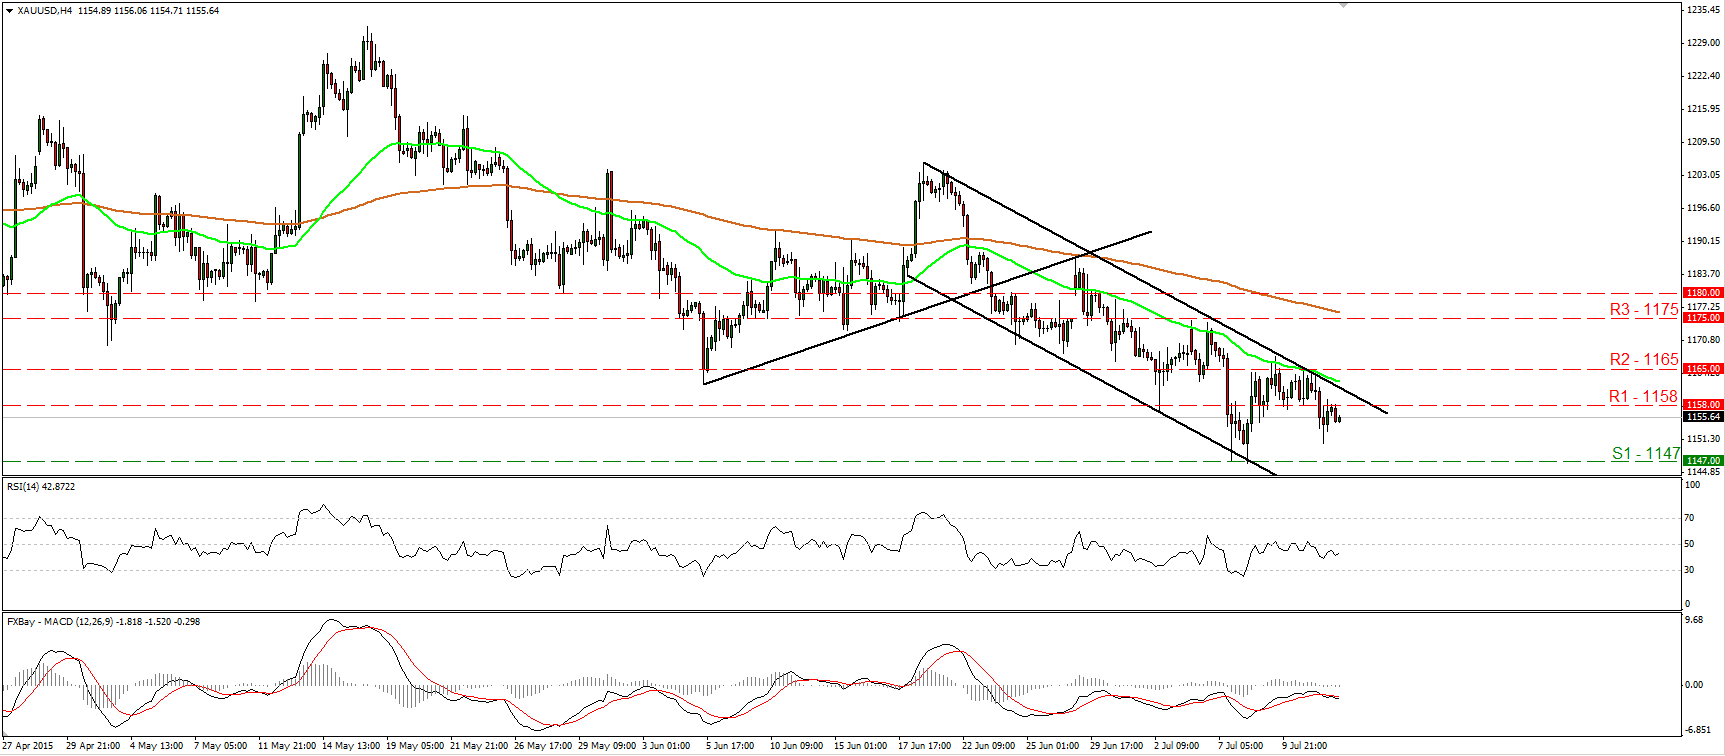
• Gold traded lower on Monday after hitting resistance at the upper bound of the short-term downside channel, and slightly below the resistance barrier of 1165 (R2). As long as the metal is trading within the short-term downside channel, the near-term outlook remains somewhat negative. I would now expect the negative leg to continue, perhaps for another test at the support barrier of 1147 (S1). A break below that hurdle would confirm a forthcoming lower low and is likely to challenge the 1142 (S2) line, defined by the lows of the 1st of December and 17th of March. Our short-term momentum studies have now turned bearish, supporting the notion. The RSI moved below its 50 line, while the MACD, already negative, has topped and fallen below its trigger line.
• Support: 1147 (S1), 1142 (S2), 1132 (S3)
• Resistance: 1158 (R1), 1165 (R2), 1175 (R3)
DAX futures escape from a downside channel
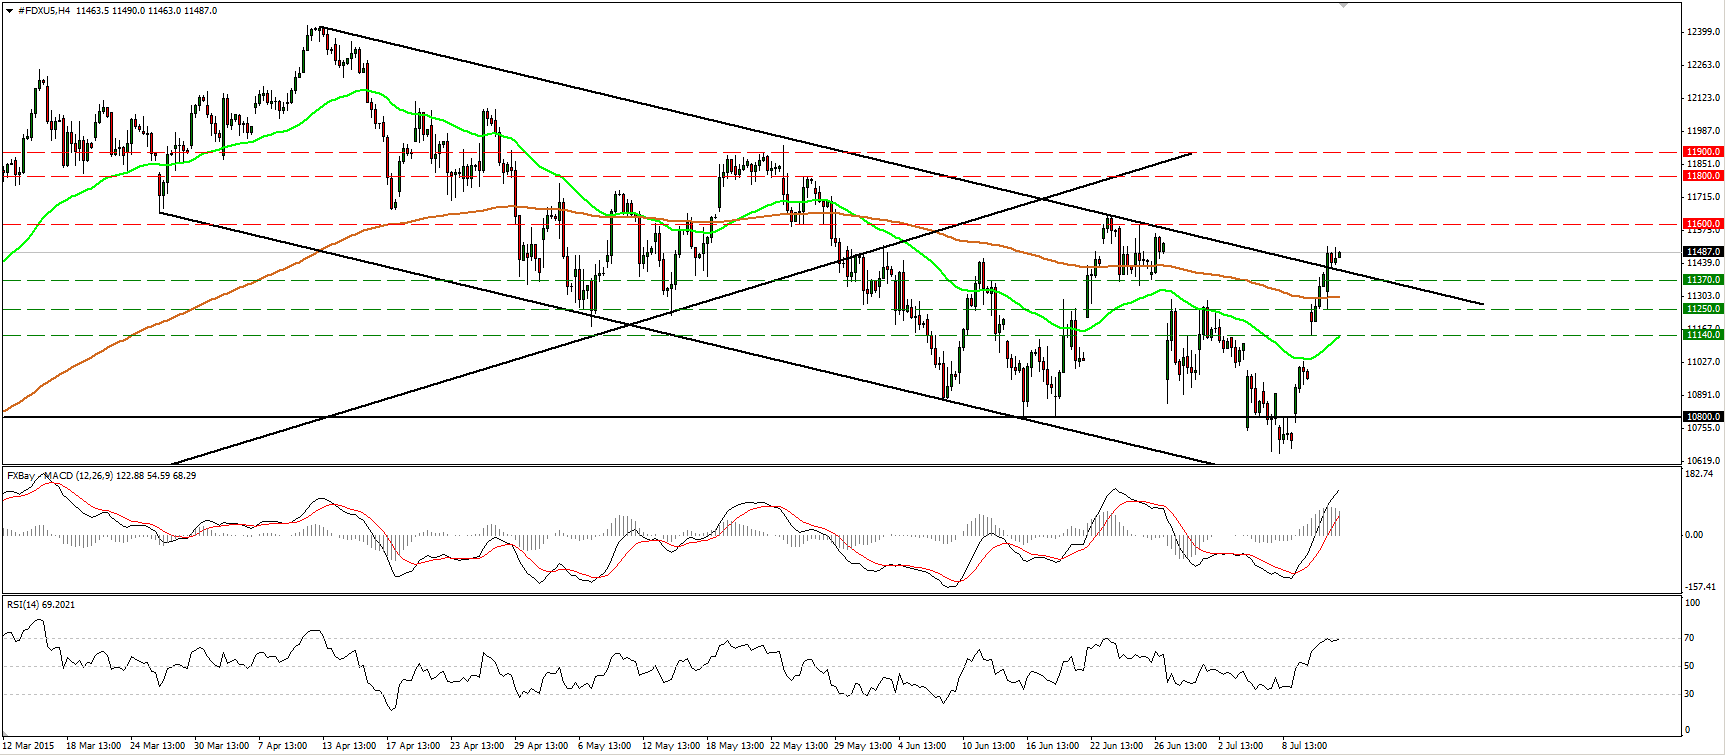
• DAX futures continued climbing higher on Monday, and managed to break above the upper bound of the downside channel that had been containing the price action since the last days of March. I would now expect a test at the 11600 (R1) zone, and if the bears are strong enough to overcome it, I believe that we are likely to experience extensions towards 11800 (R2). Our near-term momentum indicators detect strong upside speed and support the case. The RSI raced higher and now looks able to move above its 70 line, while the MACD stands well above both its zero and signal lines, pointing north. Plotting the daily chart, I see that the move out of the channel is a first sign that the 10th of April – 8th of July decline was just a corrective phase of the prior uptrend. What is more, the recent rally also confirmed the positive divergence between our daily oscillators and the price action.
• Support: 11370 (S1), 11250 (S2), 11140 (S3)
• Resistance: 11600 (R1) 11800 (R2), 11900 (R3)

