• Like as the waves make towards the pebbled shore… The news from Greece keeps coming, but there’s no real change. There was talk yesterday that PM Tsipras had agreed to most of the Troika’s – oh, pardon me, the institutions’ – conditions, but then they reminded him that a) “most of” is not the same as “all of,” and b) the offer is no longer on the table anyway. In any event, he insisted that the referendum would go ahead regardless, which only confused matters more.
• To make matters worse (if possible), the Council of Europe, Europe’s top human rights institution, said the referendum would fall short of international standards if held as planned on Sunday, as the time period was too short and “the questions... not very clear.” This is absolutely true: Tsipras stressed in his TV appearance that a “no” vote would “not mean a rupture with Europe.” Contrast that with what French President Hollande said: “It’s about knowing if the Greek people want to stay in the eurozone.” Sigmar Gabriel, Germany’s vice-chancellor, agreed, saying that if the Greeks voted “no,” they were voting “against remaining in the euro.” Clearly the Greek government and the other EU governments don’t agree. I would think that if the poll rejects the compromise, the two sides will probably not be able to reach a new agreement by the time the country’s payment to the ECB comes due on 20 July, and so the ECB’s aid to the Greek banking system is likely to be withdrawn. That would make it nearly impossible for the country to stay in the euro.
• Meanwhile, the polls suggest that as people see that being closed off from the EU means no euros coming out of the ATMs, they are starting to lose their enthusiasm for the idea. The polls show the vote has gone from 57% no/30% yes/13% I don’t know before the bank holiday to 47%/37%/17%. Nonetheless, the “no”s are still the largest group = plenty of room for volatility next Monday! That is, of course, assuming the referendum does take place. The opposition parties have filed suit to have it cancelled on the grounds that it’s unconstitutional.
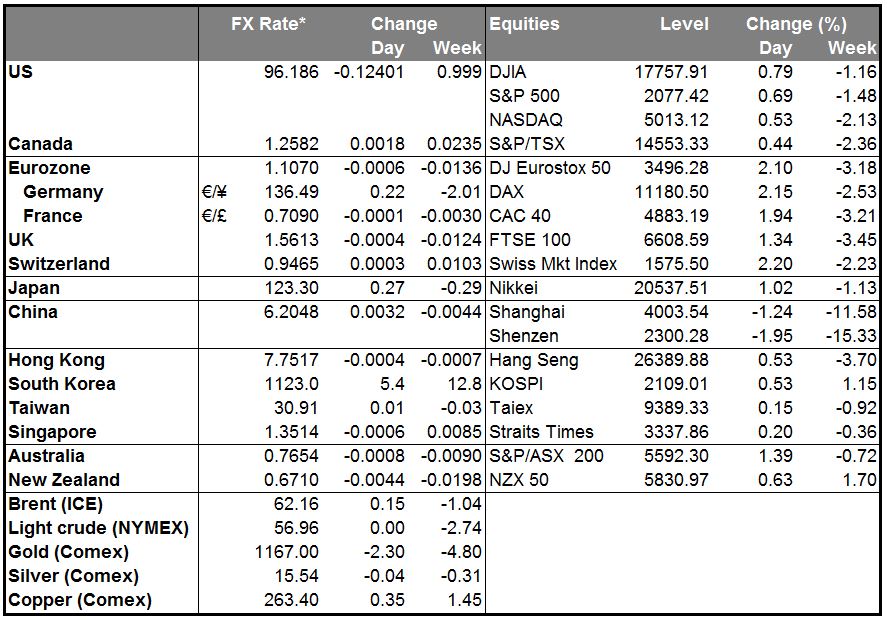
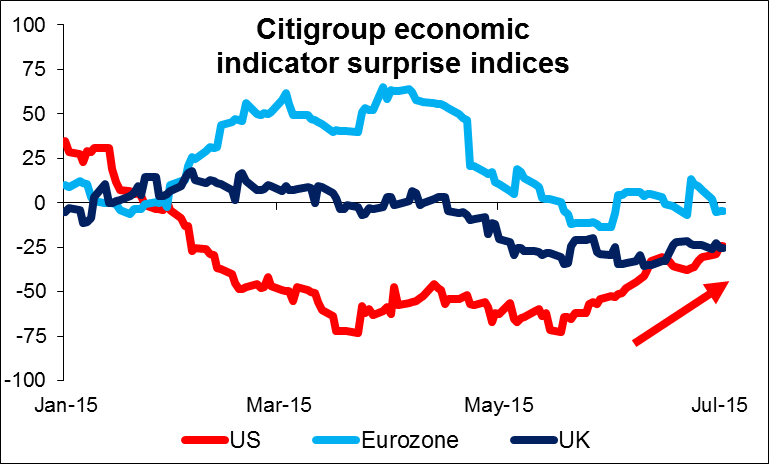
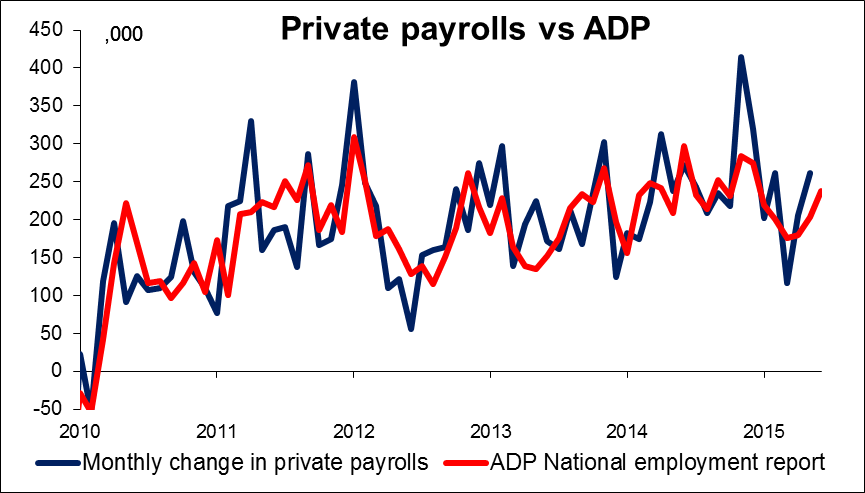
• US data surprising on the upside While the focus is on Greece recently, that doesn’t mean the rest of the world has stopped. The US economic news has been surprising on the upside recently, adding to the dollar’s strength. The ADP report yesterday was better than expected, with the only disappointment being jobs in the energy sector – hardly a surprise. The news has heightened expectations surrounding today’s US nonfarm payrolls (see below) and added 5 bps to the end-2016 Fed funds rate expectations. That helped the dollar gain against all the G10 currencies and almost all the 15 EM currencies that we track (except the INR).
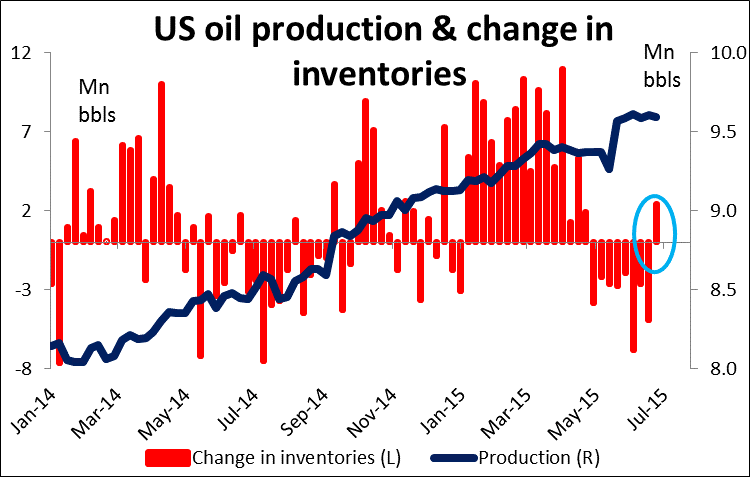
• The commodity currencies were particularly hard hit as oil prices fell sharply on news that US inventories rose unexpectedly in the latest reporting week. The market was expecting a 2.5mn barrel drop in inventories, but instead there was a 2.4mn barrel increase! Market participants had expected US oil production to fall in the face of weaker prices, but instead, it has remained relatively steady at record high levels. The four-week moving average at the beginning of the year was 9.129mn b/d and in the latest week it was 5% higher at 9.600mn b/d, showing that the sharp fall in the rig count has not caused a concomitant fall in output. That suggests further weakness for the commodity currencies, particularly CAD.
• NZD weakens as dairy prices keep falling The weakest G10 currency over the last 24 hours was the NZD, which fell as dairy prices dropped once again at the auction on Tuesday. The continued fall in dairy prices has made the market think that the Reserve Bank of New Zealand (RBNZ) is likely to cut rates at its next meeting on 23 July. That suggests further weakness is in store for NZD.
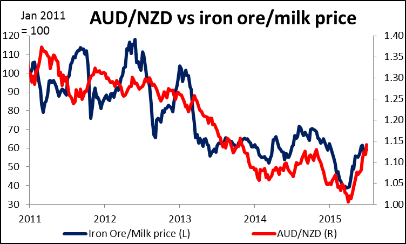
Meanwhile, CHF was the second weakest currency. Perhaps the Swiss National Bank (SNB)’s newest board member, Andrea Maechler, decided to make a splash on her first day in charge of the SNB department that intervenes in the FX market? History suggests that she can slow the CHF’s appreciation but not stop it
• Today’s highlights: During the European day, Sweden’s central bank holds its monetary policy meeting. At their last meeting, the Bank surprised the market and left its official cash rate unchanged at -0.25%, but expanded its QE program by SEK 10bn
• In the UK, we get the construction PMI for June. Following the weak manufacturing PMI on Tuesday, another soft reading could weaken GBP.
• The highlight of the day will be the US nonfarm payrolls. Usually it’s released on Friday, but this week it’s being released a day early, as the US markets will be closed Friday due to the US Independence Day holiday on Saturday. The market forecast for June is for an increase in payrolls of 230k, below the 280k in May. Nevertheless, given the strong ADP report on Wednesday, there could be an upside surprise. The “market whisper” among traders in New York is reportedly around 260k. At the same time, the unemployment rate is forecast to decline to 5.4% from 5.5%, while average hourly earnings are expected to rise at the same pace as in May. Another figure above 200k would suggest that the US labor market is gaining momentum and would leave the September rate hike scenario alive. That’s likely to boost the dollar across the board.
• From Canada, we get the RBC manufacturing PMI for June.
• As for the speakers, Riksbank First Deputy Governor Kerstin af Jochnick speaks
The Market
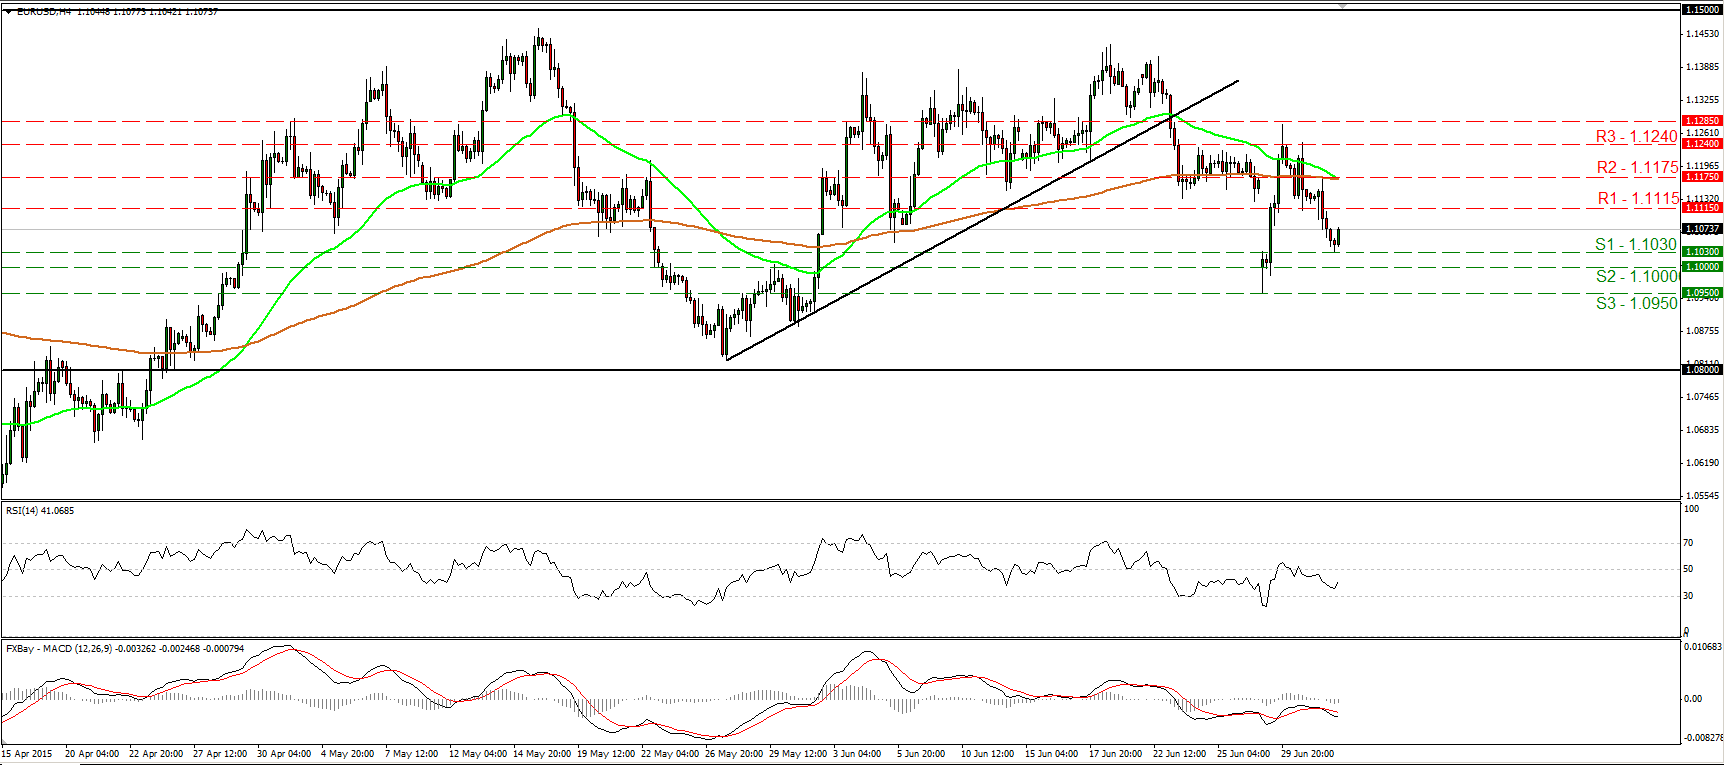
EUR/USD falls and hits support at 1.1030
• EUR/USD tumbled yesterday, falling below the support (now turned into resistance) barrier of 1.1115 (R1). The decline was stopped at 1.1030 (S1) and subsequently the rate rebounded somewhat. The short-term outlook remains somewhat negative, but I would prefer to see a clear dip below the psychological zone of 1.1000 (S2) before I get confident again on the downside. A strong US employment report today could be the trigger for a move below 1.1000 (S2). Such a break is likely to initially target our next support at 1.0950 (S3). Taking a look at our short-term oscillators, I would be careful of a further rebound ahead of the US employment data. The RSI, although below 50, it has turned up, while the MACD shows signs of bottoming and could move above its trigger line soon. In the bigger picture, I would maintain my neutral stance. I believe that a move above the psychological zone of 1.1500 is the move that could carry larger bullish implications, while a break below 1.0800 is needed to confirm a forthcoming lower low on the daily chart and perhaps turn the overall bias back to the downside. • Support: 1.1030 (S1), 1.1000 (S2), 1.0950 (S3) • Resistance: 1.1115 (R1), 1.1175 (R2), 1.1240 (R3)
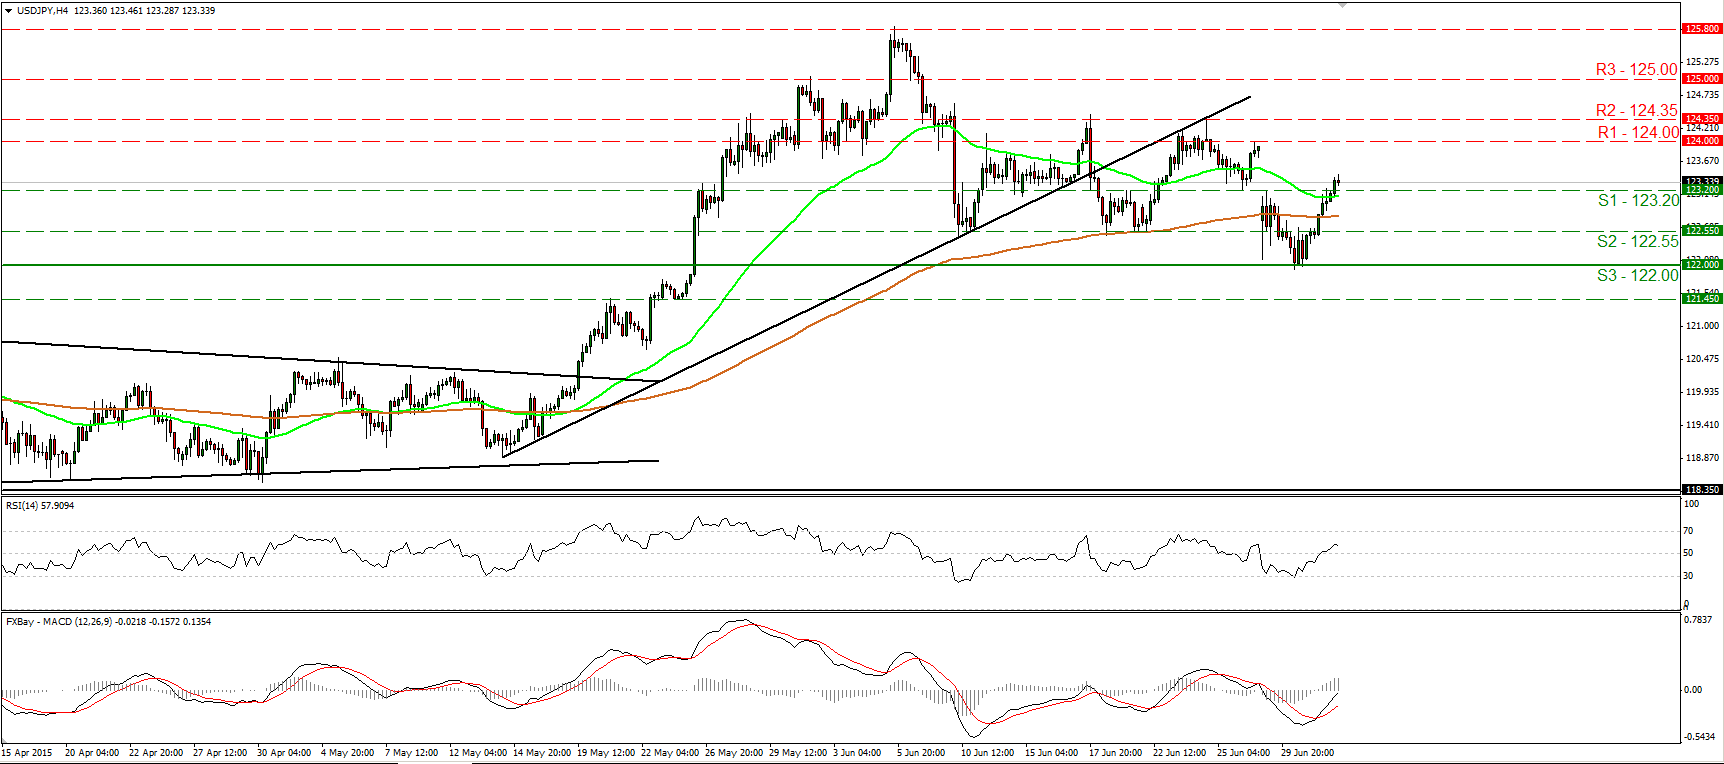
USD/JPY races higher after finding support at 122.00
• USD/JPY raced higher after it hit support at the key zone of 122.00 (S3) on Tuesday. During the early European morning today, the pair is trading slightly above the 123.20 (S1) hurdle and I would expect it to continue to move higher towards the resistance line of 124.00 (R1). Our short-term oscillators corroborate my view that the rate could trade north. The RSI moved above its 50 line, while the MACD, already above its trigger line, is headed towards its zero line. On the daily chart, the rebound from the 122.00 (S3) key hurdle zone is a first sign that the downside corrective move is probably over and that the overall uptrend is gaining back is upside momentum.
• Support: 123.20 (S1), 122.55 (S2), 122.00 (S3)
• Resistance: 124.00 (R1), 124.35 (R2), 125.00 (R3)
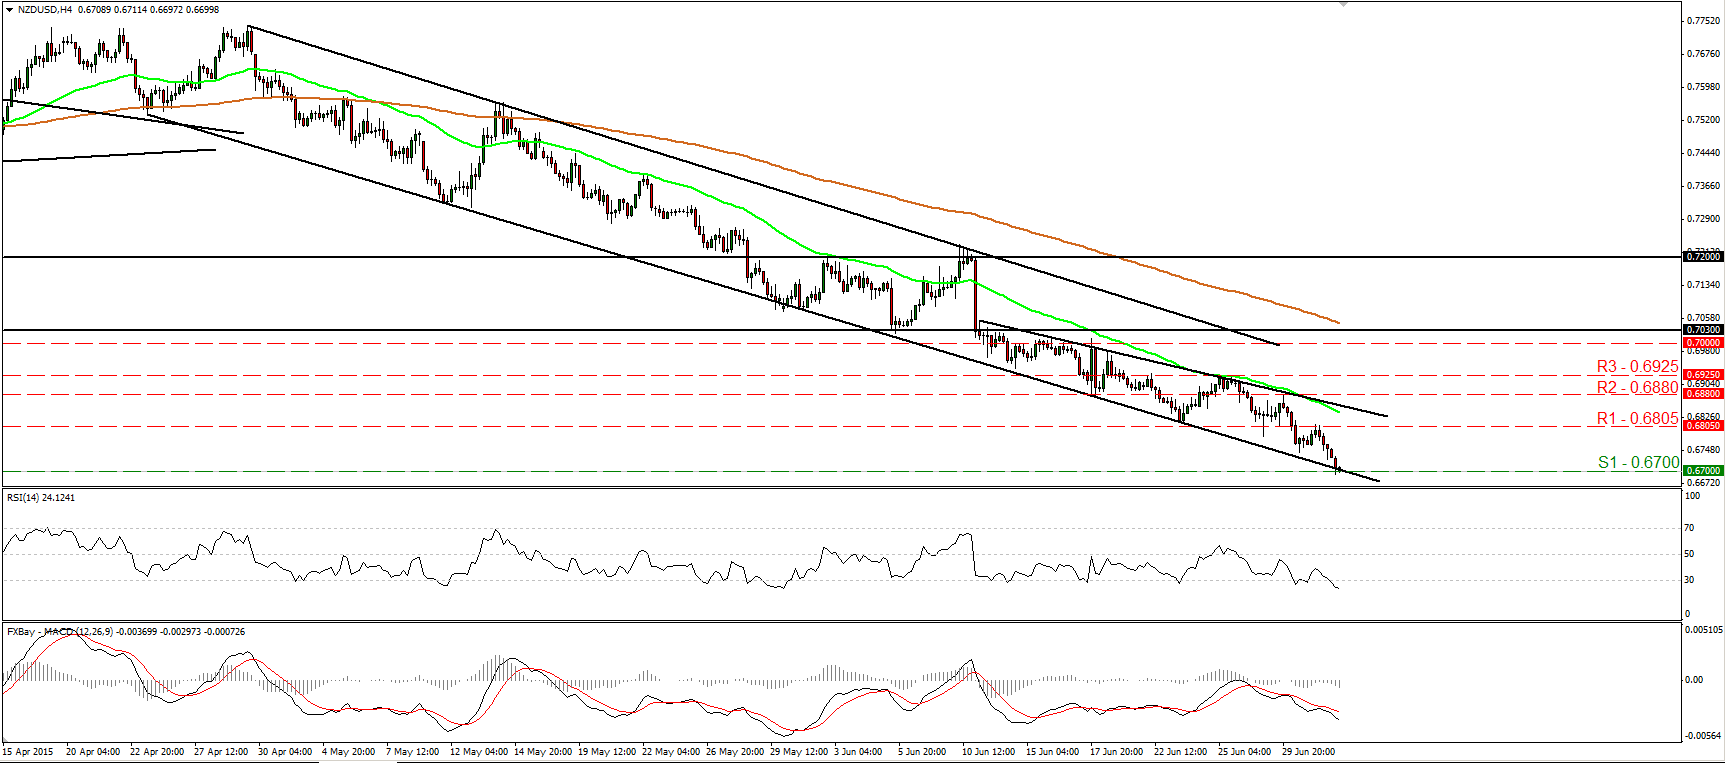
NZD/USD hits the 0.6700 hurdle
• NZD/USD traded lower on Wednesday, hitting the crossroad between the support line of 0.6700 (S1) and the lower boundary of the downside channel that has been containing the price action since the last days of April. As long as the rate is trading within that channel, I would consider the short-term outlook to be negative. A clear and decisive break below 0.6700 (S1) is likely to set the stage for further bearish extensions and perhaps pave the way for the next hurdle of 0.6580 (S2), marked by the lows of the 7th and 8th of June 2010. Our short-term oscillators detect accelerating downside speed and support the notion. The RSI fell below 30 and is now pointing down, while the MACD continued lower, below both its zero and signal lines. As for the bigger picture, the break below 0.7200 on the 28th of May signaled the continuation of the long-term downtrend started back in July 2014.
• Support: 0.6700 (S1), 0.6580 (S2), 0.6475 (S3)
• Resistance: 0.6805 (R1), 0.6880 (R2), 0.6925 (R3)
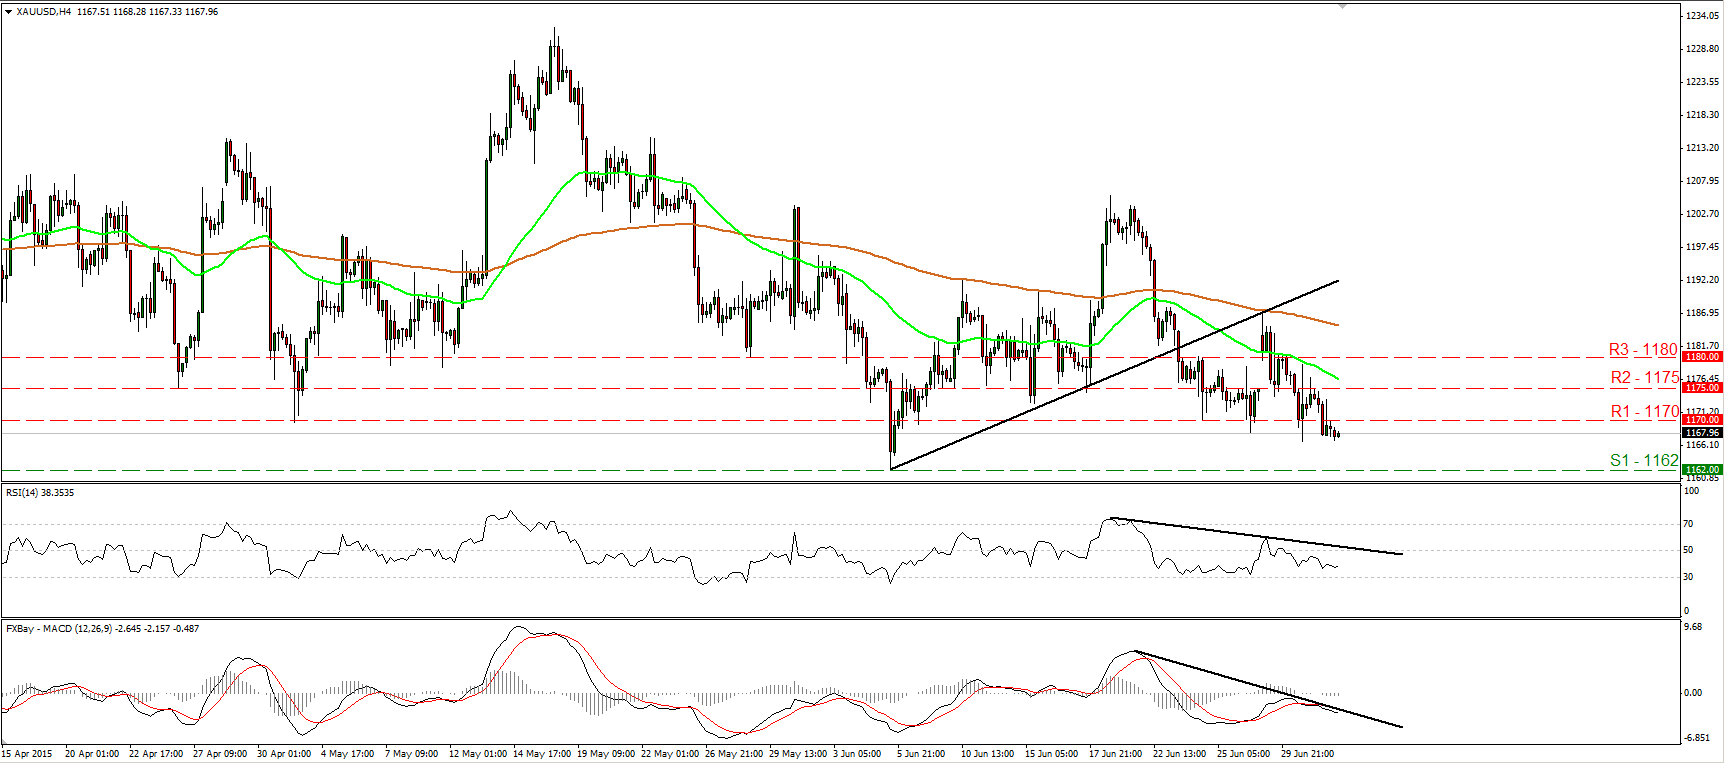
Gold falls below 1170 again
• Gold traded lower on Wednesday to trade once again below the 1170 (R1) barrier. This time, the bears managed to close the day below 1170 (R1) and therefore, I would expect them to pull the trigger for the support hurdle of 1162 (S1), defined by the low of the 5th of June. As long as the metal is trading below the short-term uptrend line drawn from the low of the 5th of June, I would consider the short-term picture to be somewhat negative. Our momentum studies support the bearish outlook. The RSI kept falling after crossing below 50, while the MACD lies below both its signal and zero lines, detecting negative momentum. As for the bigger picture, the overall outlook remains somewhat negative. However, I prefer to see a decisive close below the previous low at 1162 (S2), before I get more confident on the downside.
• Support: 1162 (S1), 1153 (S2), 1146 (S3)
• Resistance: 1170 (R1), 1175 (R2), 1180 (R3)
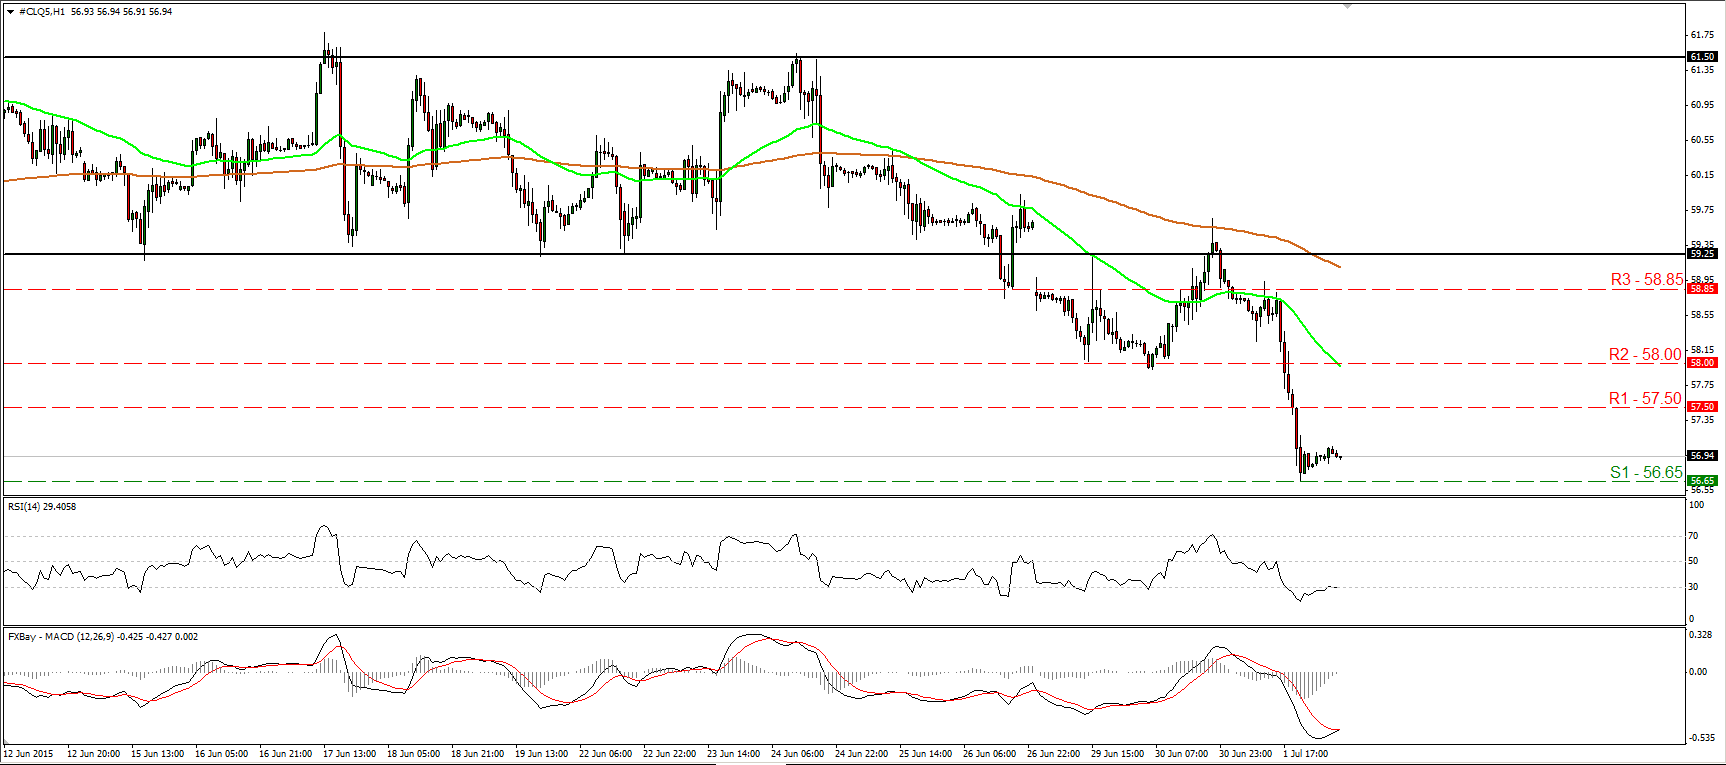
WTI collapses and hits support at 56.65
• WTI collapsed on Wednesday after the surprising build in US stockpiles last week. The fall was halted at 56.65 (S1) and subsequently the price rebounded somewhat. After the downside exit of a trading range on the 29th of June, the bias has turned negative in my opinion. A clear break below 56.65 (S1) is likely to extend the short-term downtrend and perhaps challenge our next support at 56.10 (S2), defined by the low of the 28th of April. However, looking at our hourly oscillators, I would be careful that the current rebound may continue for a while before the bears shoot again. The RSI appears ready to exit its below-30 territory, while the MACD has bottomed and could move above its trigger line soon. As for the broader trend, the break above 55.00 on the 14th of April signaled the completion of a double bottom formation, something that could carry larger bullish implications in the not-too-distant future. As a result, I would treat any further declines that stay limited above 55.00 as a corrective phase.
• Support: 56.65 (S1), 56.10 (S2), 55.75 (S3)
• Resistance: 57.50 (R1) 58.00 (R2), 58.85 (R3)

