Optimism over EUR to fade, currency to fall back again.
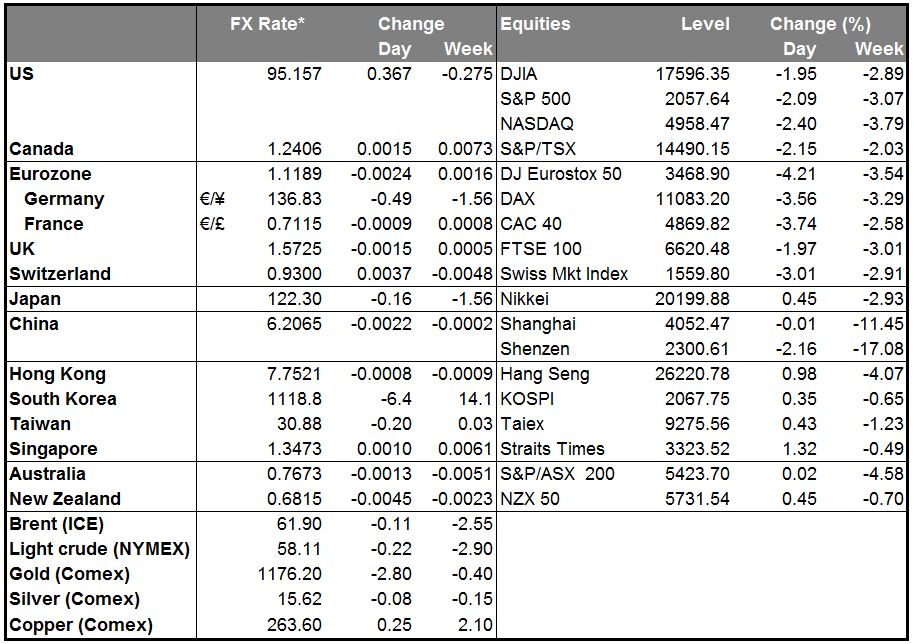
• Why did the euro rally? The big question in the market has to be, why did the euro rally yesterday? The low for the day turned out to be around three hours after the start of trading. After that, it gradually recovered and indeed in late New York trading, was actually higher than its highest level on Friday. Although it has since come back down somewhat, it is still the best-performing G10 currency when compared with early European levels yesterday. There are several reasons I can think of:
1. Retreat in Fed rate expectation We noted last week that the euro actually weakened as it appeared that the Greek crisis was nearing a resolution. This counterintuitive movement occurred because people reasoned that stability in the global financial system would make it easier for the Fed to hike rates in September. Well, the reverse happened yesterday: Fed funds expectations for end-2016 opened 12 bps lower and ended off 8 bps. That took some of the steam out of the dollar.
2. Expectations of a successful “yes” vote Although the Tsipras administration is urging people to vote “no” in the referendum, the first polls indicate that people are leaning towards a “yes” vote. This raises the prospects that not only might the referendum resolve the issue with the Eurozone, but also PM Tsipras and his SYRIZA colleagues might resign afterwards, a “two birds with one stone” result that would make a lot of people in the financial community happy. Although the government insists that a “no” vote would merely strengthen its hands in negotiations with the country’s creditors, several European leaders warned that Greeks face a choice between the euro and the drachma when they go to vote on Sunday. Although I have to admit, on the betting site oddschecker.com, the odds for Greece leaving the euro this year are now 5:2, while not leaving the Eurozone is 4:11.
3. Narrowing US/Germany spread One of the main drivers of EUR/USD nowadays is the spread of US bonds over German bonds. But with German yields so low, it’s hard for them to fall much further, especially at the short end where they’re already negative. So as the “flight to safety” sent investors out of equities and streaming into bonds yesterday, US 2-year yields declined by 8 bps, while the equivalent German yields fell only 2 bps, narrowing the spread in favor of Germany. The change was less pronounced in the long end, but still, the spread came in by 2 bps. That too supported the euro.
4. Optimism about the Eurozone without Greece? There may be some people who believe, as I mentioned yesterday, that the Eurozone would be better off and the euro stronger without Greece. I think this idea is a mistake. Proof of this can be seen in the large decline in European bank stocks yesterday (down 4.2% vs -2.5% for US banks). Bank stocks across the continent fell on fears of what would happen if there is no resolution to the crisis. I think this is one question we don’t want to find the answer to.
• I expect the optimism about EUR to fade and for the currency to fall back again. I think people are overestimating the good that will come of a “yes” vote. They are perhaps assuming that the intervening week between when PM Tsipras rejected the last offer and the referendum takes place will be as if it didn’t happen. That’s not true. First off, the Greeks are voting on whether to accept the creditor proposal as submitted to the Eurogroup last Thursday, but I’m not sure whether that proposal is still on the table. Secondly, the Greeks may think that if they vote “yes,” then they can still get their bailout program extended, but that program no longer exists; it expires today without an extension, and so the undisbursed amounts available to Greece disappear. Third, if (as is almost certain) Greece fails to pay the IMF today, the European Financial Stability Facility (EFSF), Greece’s main creditor with EUR 142bn in loans outstanding, could decide to ask for accelerated repayment, which would put additional pressure on Greece (although political considerations may persuade it to hold off until after the referendum).
• Finally, the Eurozone finance ministers have highlighted the credibility issues that would arise if the Tsipras government were to try to implement an agreement that it had campaigned against. In fact, Tsipras himself hinted that he would step down if the country voted “yes,” as mentioned above. It’s likely that the government would change in the event of a “yes” vote, which would take time. During that time, capital controls would remain in place, the banks might remain closed, and Greece would fall further and further into depression. The government could be forced to issue a scrip in place of euros while all this went on. It would be a disaster. From my point of view, even the best outcome looks pretty bad at this point.
• CAD and NZD ease vs USD The CAD and the NZD were the only G10 currencies that fell against the USD. CAD was weaker as oil prices fell sharply. That was in response to indications that diplomats are making some progress in talks with Iran that might result in a nuclear accord.
•Today’s highlights: The focus will remain squarely on Greece again today, as the bailout extension program expires and the payment to the IMF comes due. The Greek finance minister was asked recently whether Greece will pay on Tuesday, and replied that the ECB should pay the money to the IMF out of the profits it made on Greek bonds in 2014, clearly implying that they will not pay. We await the IMF’s response and then the ECB’s response to the IMF. So far, it looks like the ECB is willing to continue the Emergency Liquidity Assistance (ELA) funds to Greece at least until the referendum.
• As for the indicators, Eurozone’s flash CPI for June is coming out. The fall in the German inflation rate announced on Monday increased the likelihood that Eurozone CPI is likely to fall as well. Even though the market is likely to ignore this data due to the Greek crisis, it raises concerns over the bloc’s recent recovery path. Eurozone’s unemployment rate for June is also coming out. From Germany, we get retail sales for May and the unemployment rate for June. Neither is a major market mover, thus the impact on EUR should be limited.
The Market
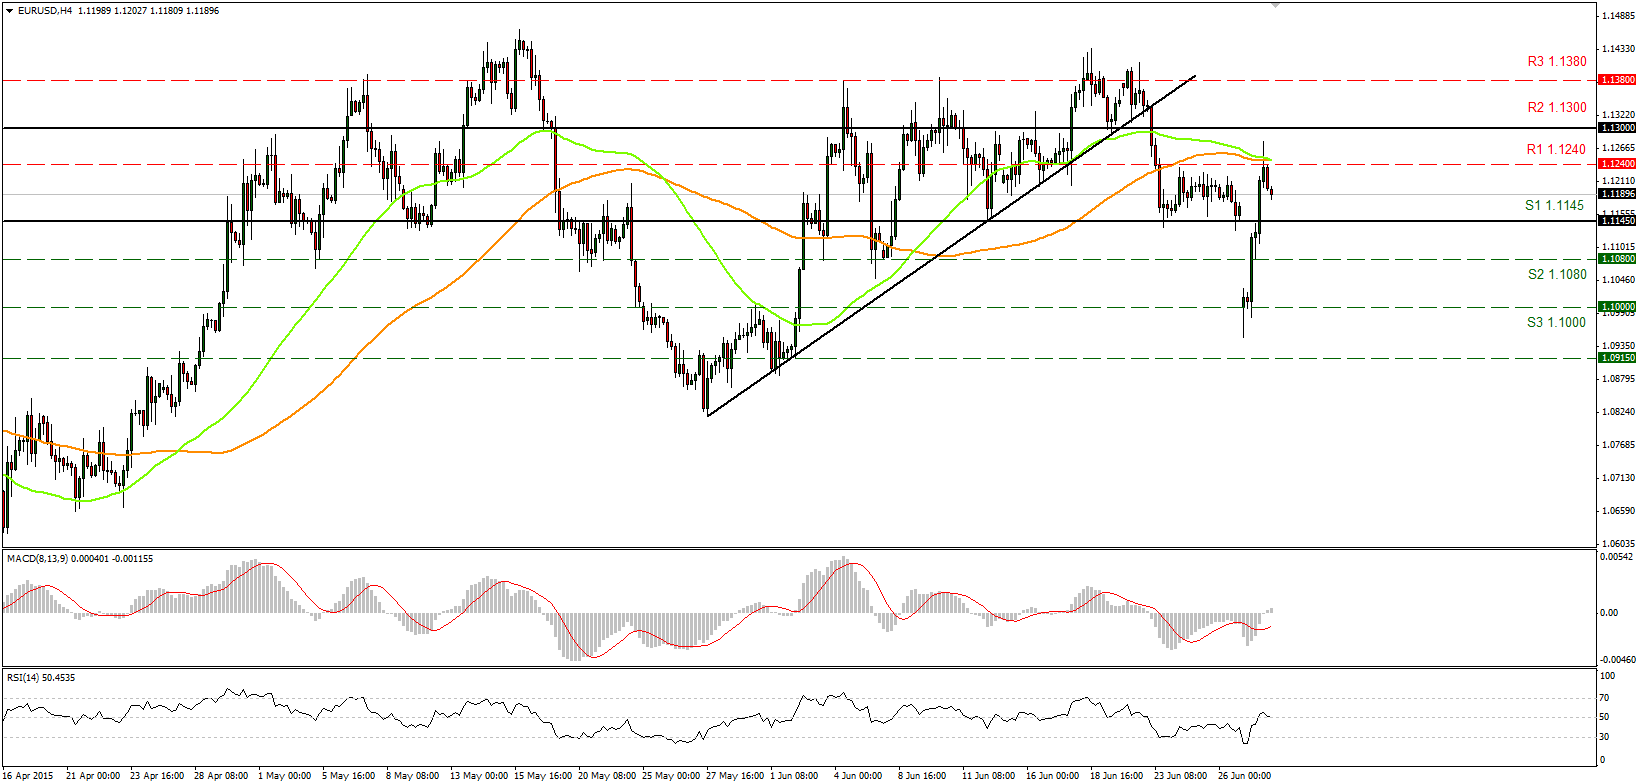
EUR/USD covered the gap and moved higher
• EUR/USD rose on Monday, covered the gap, and moved a bit higher to find resistance at 1.1240 (R1) and the cross of the 50- and 100-period moving averages. A break above that level is needed to carry larger bullish implications and drive the pair towards the round number of 1.1300 (R2). The advance on Monday pushed the pair back into the sideways channel it had been trading since early June; therefore, I would like to remain neutral as far as the short-term picture is concerned. Our short-term momentum indicators add to my view. The RSI lies just above the 50 line relatively neutral, while the MACD, just above the zero line points sideways. On the daily chart, the rally on Monday pushed the rate above the 50- and 100-day moving averages, which keeps the bigger picture somewhat positive.
• Support: 1.1145 (S1), 1.1080 (S2), 1.1000 (S3)
• Resistance: 1.1240 (R1), 1.1300 (R2), 1.1380 (R3)
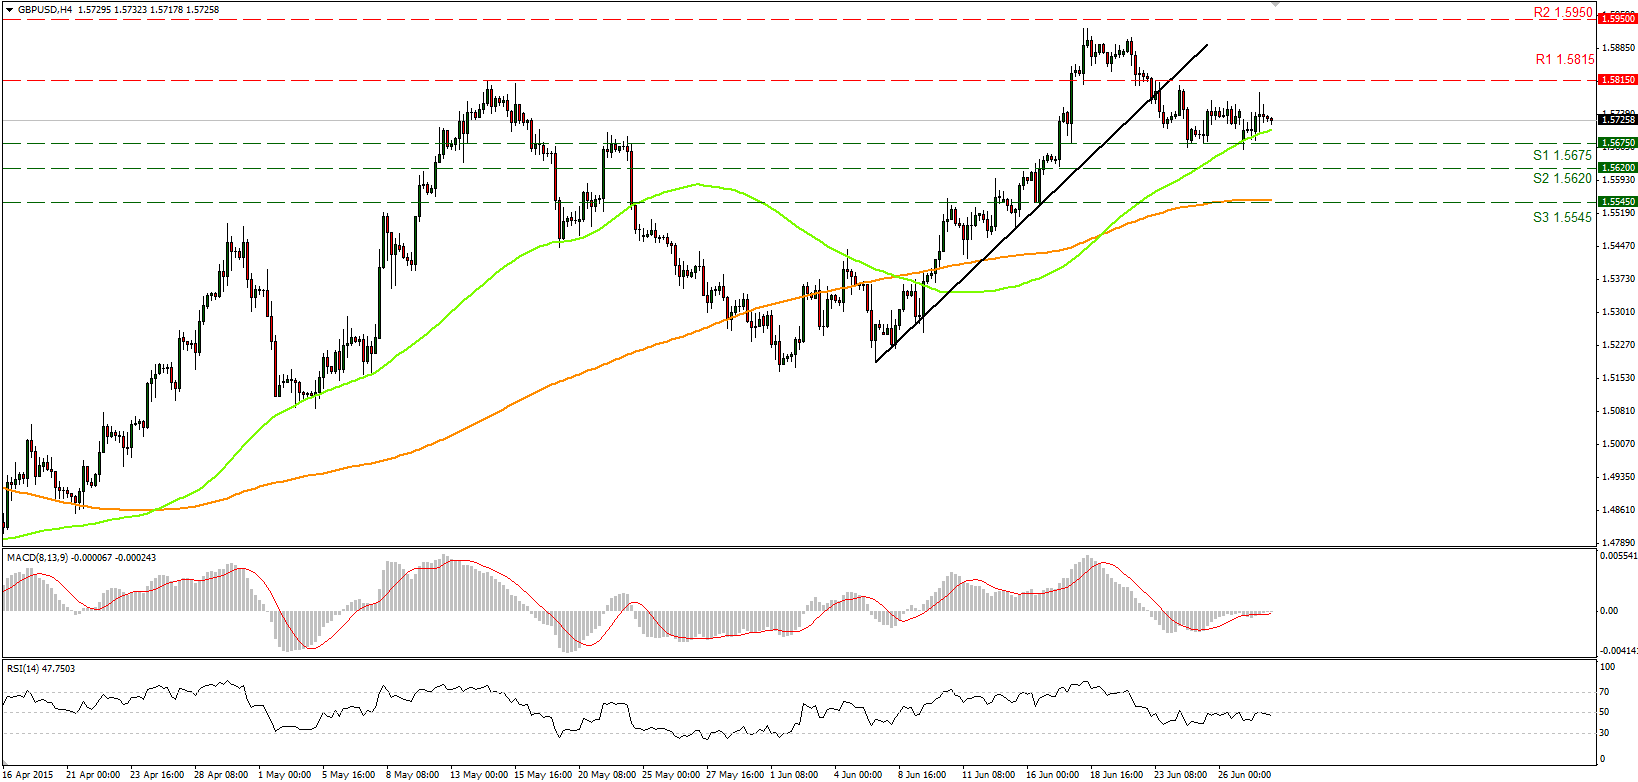
GBP/USD still in a consolidative mode
• GBP/USD remained in a consolidative mode on Monday, trapped in a range between the 1.5675 (S1) support line and the 1.5815 (R1) resistance hurdle. A break in either direction is needed to determine the forthcoming near-term bias. Today, we get the UK 3rd estimate of Q1 GDP, which if revised up, could trigger a challenge of the 1.5815 (R1) resistance zone. Looking at our momentum indicators, they both trade along their neutral levels. The RSI is a touch below the 50 line and moves along it, while the MACD stands very close to its zero and trigger lines. These momentum signs suggest a neutral bias; thus, I would prefer to adopt a neutral stance and wait for a break in either direction to determine the near-term bias. On the daily chart, I see that after rebounding from the 50% retracement level of the 14th of April - 15th of May up leg, GBP/USD moved back above the 80-day exponential moving average. In my view, the move above 1.5800 on the 17th of June confirmed that the overall picture has turned positive.
• Support: 1.5675 (S1), 1.5620 (S2), 1.5545 (S3)
• Resistance: 1.5815 (R1) 1.5950 (R2), 1.6000 (R3)
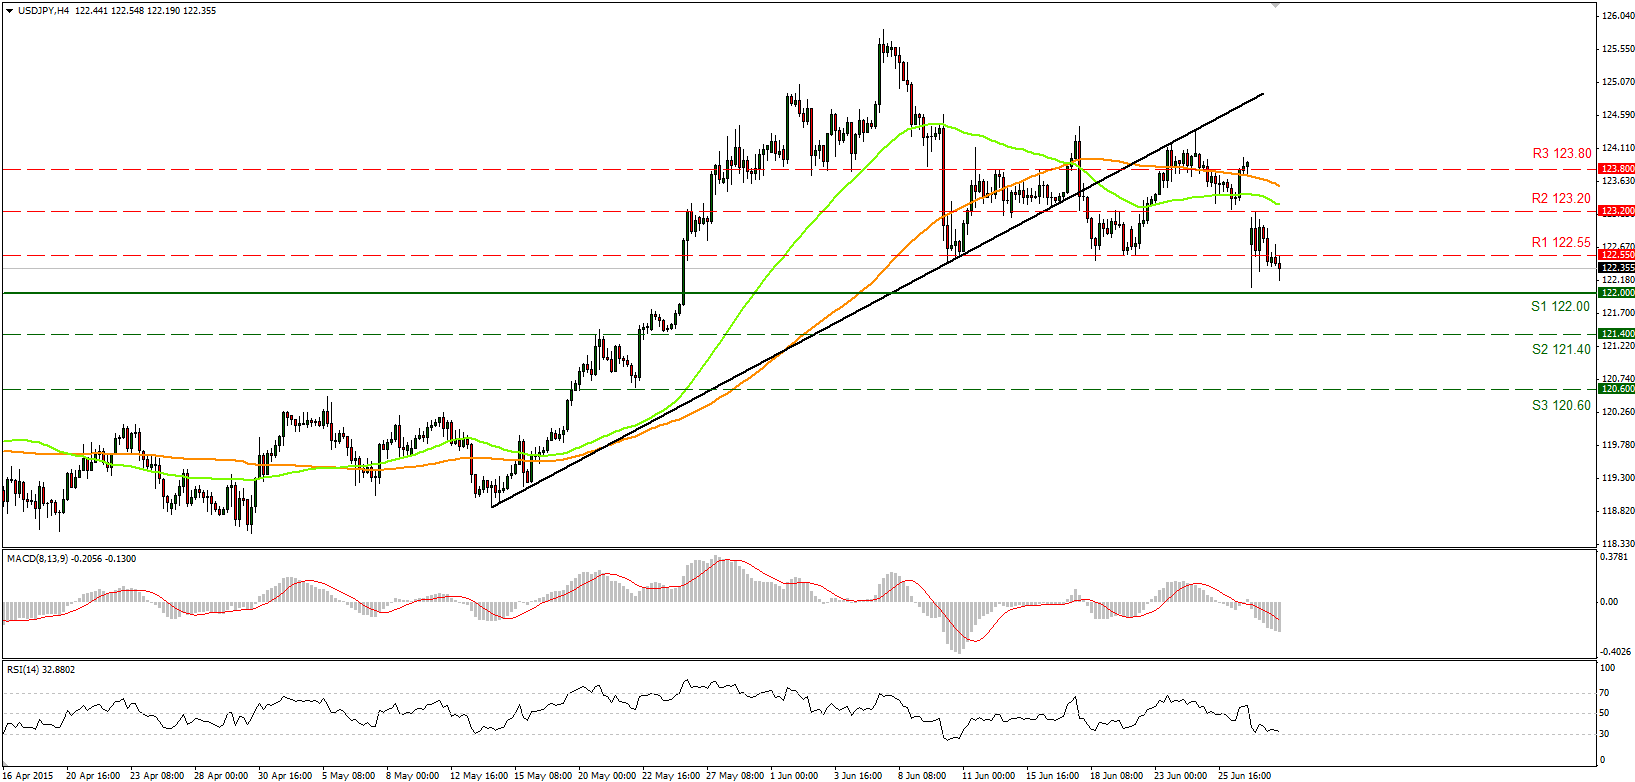
USD/JPY heads towards the key level of 122.00
• USD/JPY declined on Monday, breaking below our support-turned-into-resistance line of 122.55 (R1). During the early European morning, the rate heads towards the key level of 122.00 (S1). A break of that support level is needed to see scope for further declines. Looking at our momentum indicators, however, further declines may not be immediate. The RSI found support at its 30 line and is pointing sideways, while the MACD, although below its zero and trigger lines, show signs of bottoming. Another interesting point is that any dips of the RSI below 30 were short-lived, which amplifies the case to wait for a break of the 122.00 (S1) support zone to trust further declines. On the daily chart, the pair lies above both the 50- and 100-day moving averages, which keeps the longer-term upside path intact.
•Support: 122.00 (S1), 121.40 (S2), 120.60 (S3)
• Resistance: 122.55 (R1), 123.20 (R2), 123.80 (R3)
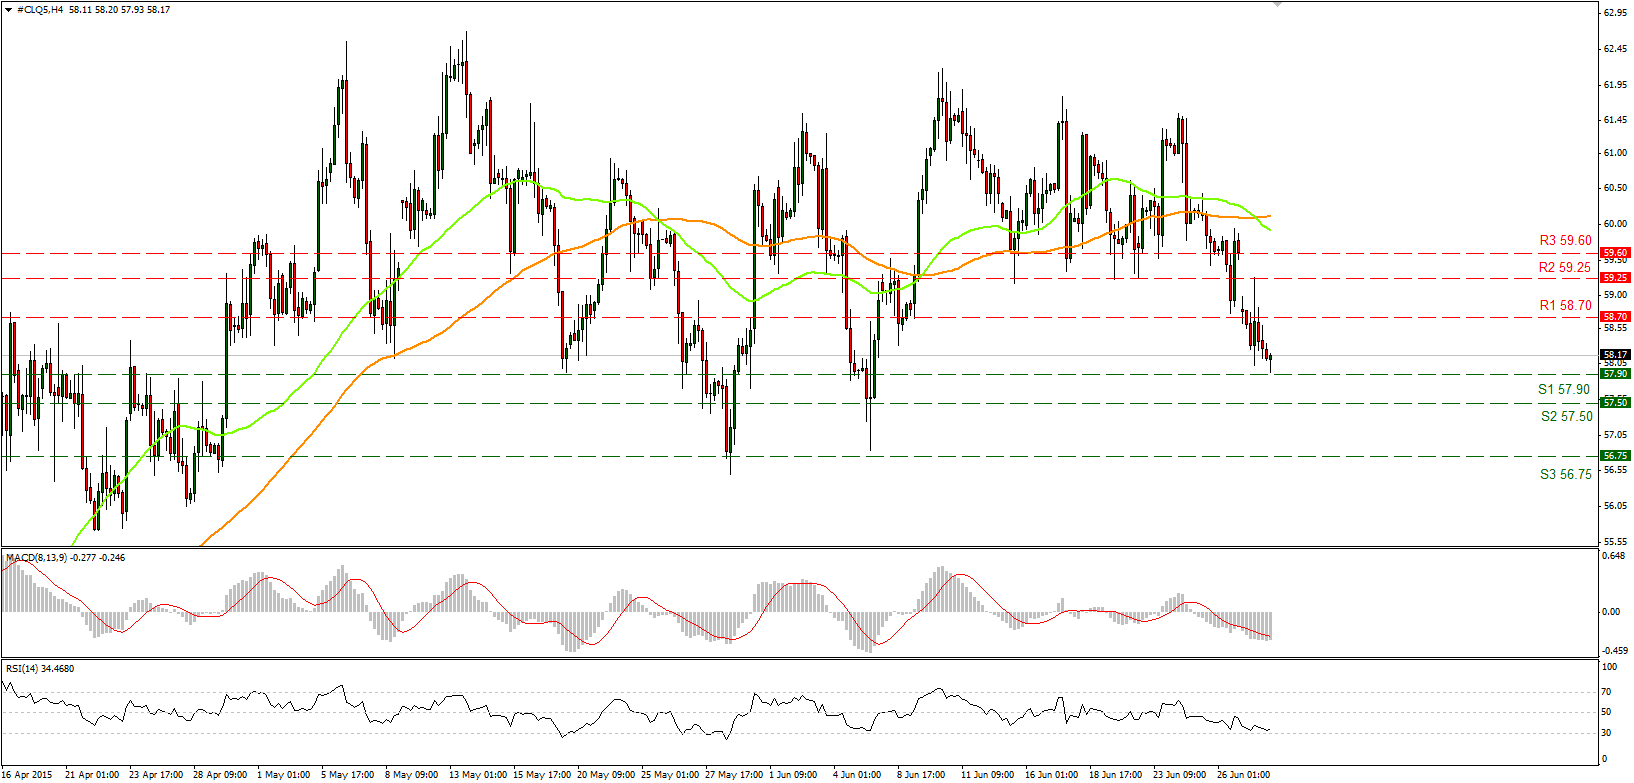
WTI test the 57.90 support level
• WTI plunged on Monday, falling below the support-turned-into-resistance line of 58.70 (R1). The break below the well-tested 59.25 (R2) resistance zone carried larger bearish implications and shifted the near-term picture to the downside. However, a break of the 57.90 (S1) support zone is needed to trigger further declines. As a result, I would see a negative short-term picture given that the rate has fallen below the R1 and R2 support hurdles. As for the broader trend, the gap on Monday pushed the price below the 50-day moving average, which turned the medium-term bias negative in my view. This is supported by our daily oscillators, which have moved lower from their equilibrium levels.
• Support: 57.90 (S1), 57.50 (S2), 56.75 (S3)
• Resistance: 58.70 (R1), 59.25 (R2) 59.60 (R3)
Gold below 1180 again
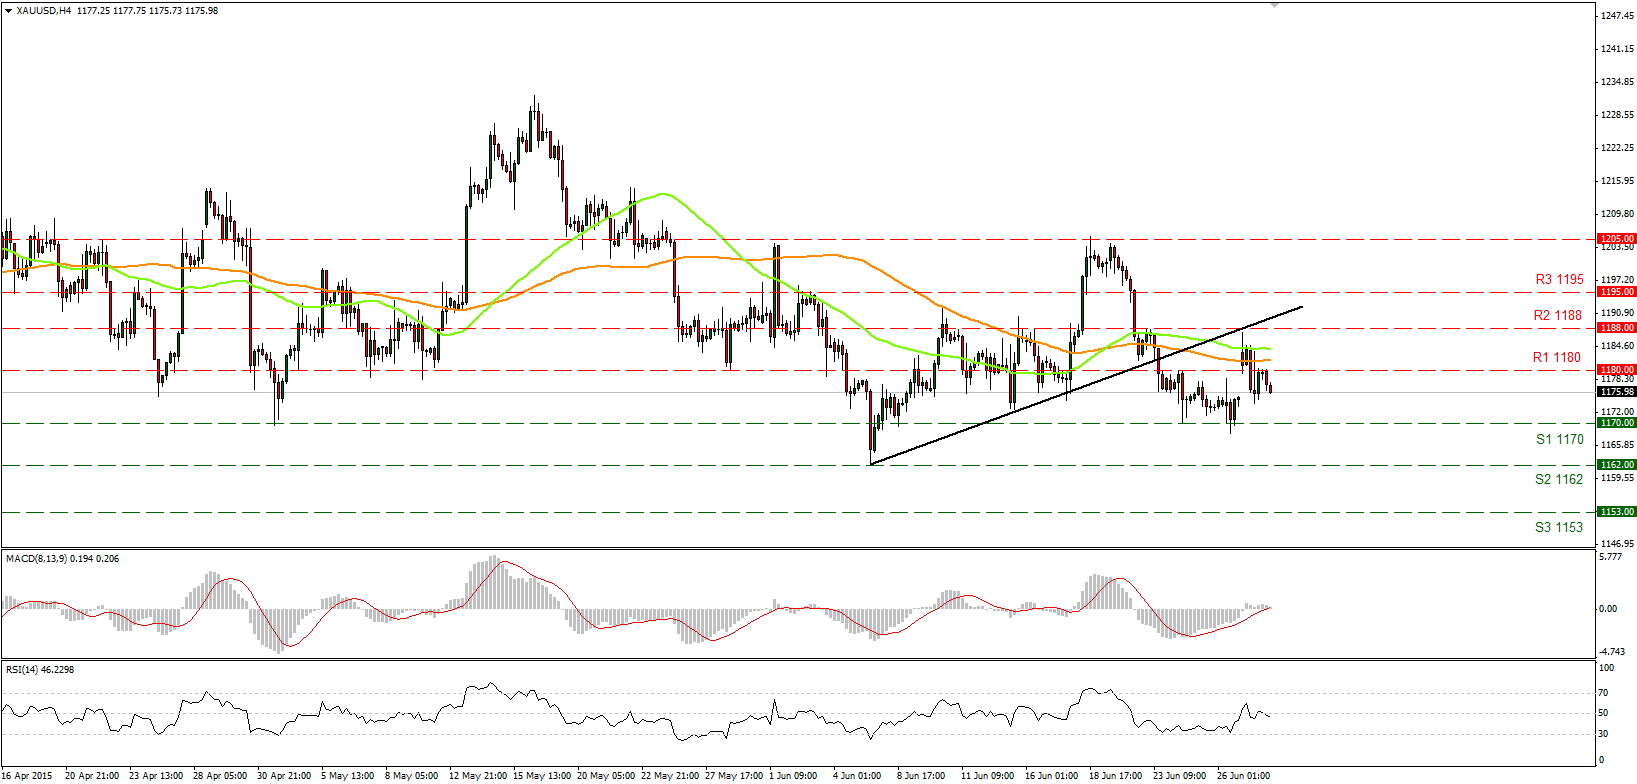
• Gold moved lower on Monday, completely covering the gap it opened the week with and falling below the support-turned-into-resistance line of 1180 (R1). I believe that the failure to break above the 1188 (R2) resistance zone and the black uptrend line drawn from the low of the 5th of June have shifted the bias back to the downside. Our short-term momentum signs stand near their equilibrium levels, pointing somewhat lower. However, I would need a break below the 1170 (S1) territory to get confident for further declines. On the other hand, any advances that stay limited below the short-term uptrend line keep the picture somewhat negative. As for the bigger picture, the overall outlook remains negative as well, with the precious metal trading below it 50- and 100-day moving averages.
• Support: 1170 (S1), 1162 (S2), 1153 (S3)
• Resistance: 1180 (R1), 1188 (R2), 1195 (R3)

