• Greek talks stumble I mentioned yesterday that Greece’s creditors didn’t like the country’s proposals, which emphasized tax increases that could further dampen growth and largely ignored spending cuts and structural reforms that would boost the country’s potential. In fact, the creditors rejected the proposals and made counterproposals that Greek PM Tsipras rejected (available at http://online.wsj.com/public/resources/documents/062415Greek.pdf). These are the “prior actions” that the government must implement and the calendar for implementation. They show that the pension system remains a major sticking point.
• To give you a feel for how far apart the two sides still are at this late date, Market News International quoted an unnamed Greek government official as describing the creditors’ proposals as “barbaric” and “Armageddon,” while a German government spokesman called them “exceptionally generous.” Given that many of the members of the ruling SYRIZA coalition thought that the original Greek proposals were too harsh, it’s hard to see how Greek PM Tsipras can come up with new proposals that the creditors will approve of and still manage to get them through the country’s parliament in time for next Tuesday’s deadline.
• The technical teams reconvened this morning at 0600 CET, while Tsipras and his counterparts from the three creditor institutions – the ECB, the IMF and the European Commission – will meet again at 0900 CET. It’s hard to imagine though what they can come up with that will win the approval of the Greek parliament. If the two sides cannot agree on measures and pass them through the Greek parliament by Sunday night, the country might have to impose capital controls, and the Greek banks might not be able to open as usual on Monday morning. That could prove to be a traumatic event for the FX markets. On the other hand, if the Greek government can agree in time, then the Eurogroup might be able to wire them the profits from the Securities Market Program (SMP) directly, which would allow them to make the payment to the IMF on Tuesday. (The ECB bought Greek government bonds as part of the SMP, which was active from 2010 to 2012. It has said it would give Greece the profits from those trades if an agreement is reached.)
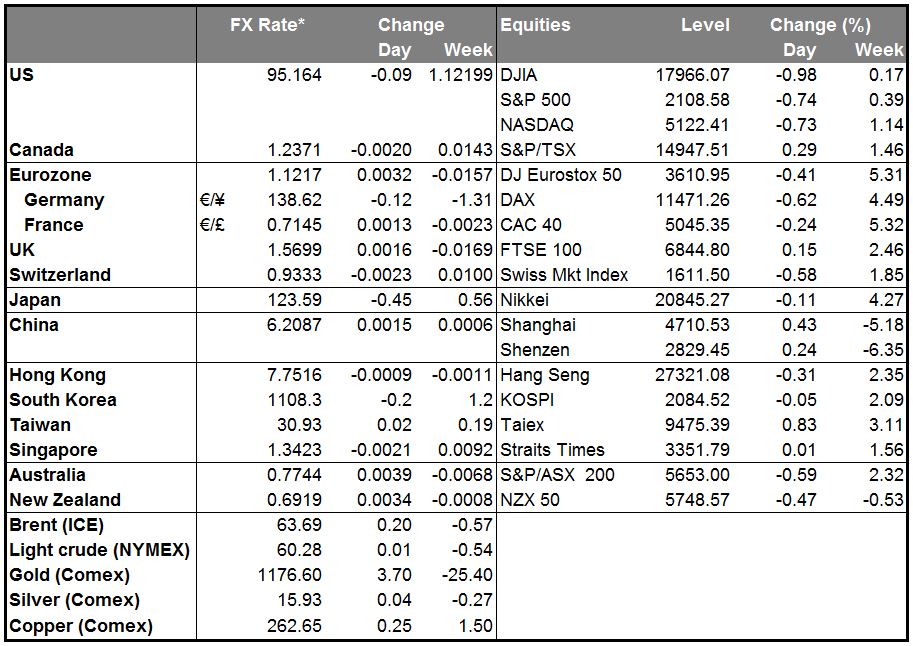
• EUR slightly higher nonetheless Has this proven to be a catastrophe for the euro? Not at all. In fact, the euro was 0.3% stronger vs USD this morning than it was 24 hours ago, while the Deutsche Bank (XETRA:DBKGn) EUR TWI was up 0.37% this morning compared with its Tuesday close. The range in EUR/USD was 0.74% yesterday, well below this year’s average of 1.23% (although this is the European trading day, which ended before the talks officially blew up). It looks to me like market participants are simply getting bored by the whole Greek issue and are thinking about other things, such as their plans for this summer. The main impact was on the stock markets, not the FX market. FX is being more influenced by monetary policy, and USD was mixed, as Fed funds rate expectations slipped somewhat and UST yields declined. That may be the channel through which Greece is affecting the FX market: increased Greek tensions reduce the likelihood of Fed tightening and thereby paradoxically weaken the dollar, not the euro.
• Nonetheless, I still believe that the failure of the talks would be negative for the euro. Investors are starting to worry about the possible contagion effects, notably on Portugal. After falling to record lows in recent months, Portugal’s borrowing costs last week hit their highest point this year as the Greek tensions increased. During the previous Greek crisis in 2012, Portuguese 10-year bond yields soared to 18%, forcing the-then government to seek a rescue from the EU and the IMF. UBS has forecast that Portugal’s borrowing costs could double if Greece leaves the euro. Even before that, if Greece imposes capital controls, depositors in Portugal could worry that they may be next and start to move money abroad. That could impose serious strains on the European monetary system, weakening the euro.
Today’s highlights: During the European day, EU leaders begin their two-day summit. Greece is likely to dominate the discussion; however, the fast-approaching UK referendum on EU membership will also be among the key points of the summit. This will be the first time that the UK PM will officially present his demands as part of plans to renegotiate UK’s membership with the EU. He will seek to get support from the EU leaders for reforms meaningful enough to persuade the British people to vote to remain in the EU. Anything that could undermine the UK’s membership in the bloc could have negative impact on GBP.
• As for indicators, only data of secondary importance are coming out: Germany’s GfK consumer confidence for July and Sweden’s PPI for April. Neither is a major market mover.
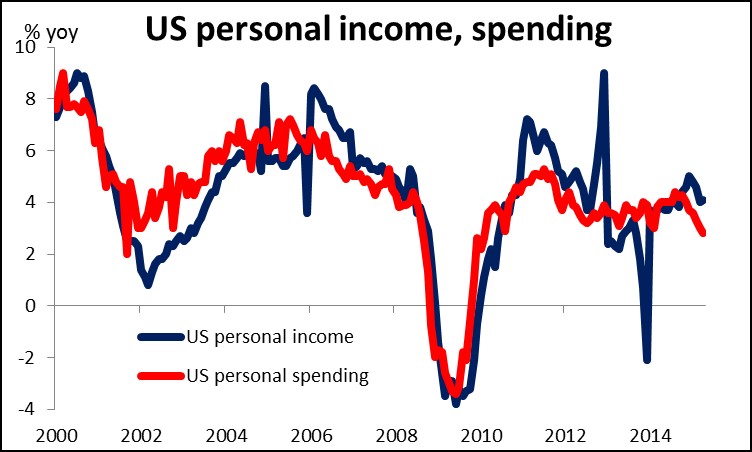
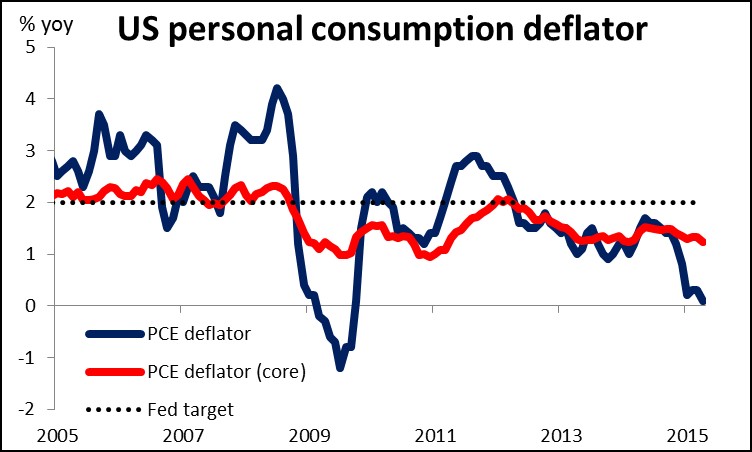
• In the US, we get personal income and personal spending for May. Both are forecast to accelerate, but the market will most likely focus on personal spending, which is forecast to rise sharply after a flat reading in April. A big pickup in spending will support a rebound in growth in Q2, and add to the likelihood of a rate hike in September. The yoy rate of the PCE deflator and core PCE for May are also coming out. The PCE deflator is expected to accelerate, while the core PCE is forecast to remain unchanged in pace from April. The former could add to dollar’s strength. The preliminary Markit (NASDAQ:MRKT) service-sector PMI for June and initial jobless claims are also due out.
• As for the speakers, Swiss National Bank President Thomas Jordan and Fed Governor Jerome Powell speak. Powell spoke Tuesday on monetary policy, while Thursday, he speaks on payment systems, so his comments are not likely to add much to our understanding of Fed thinking.
The Market
EUR/USD trades somewhat higher
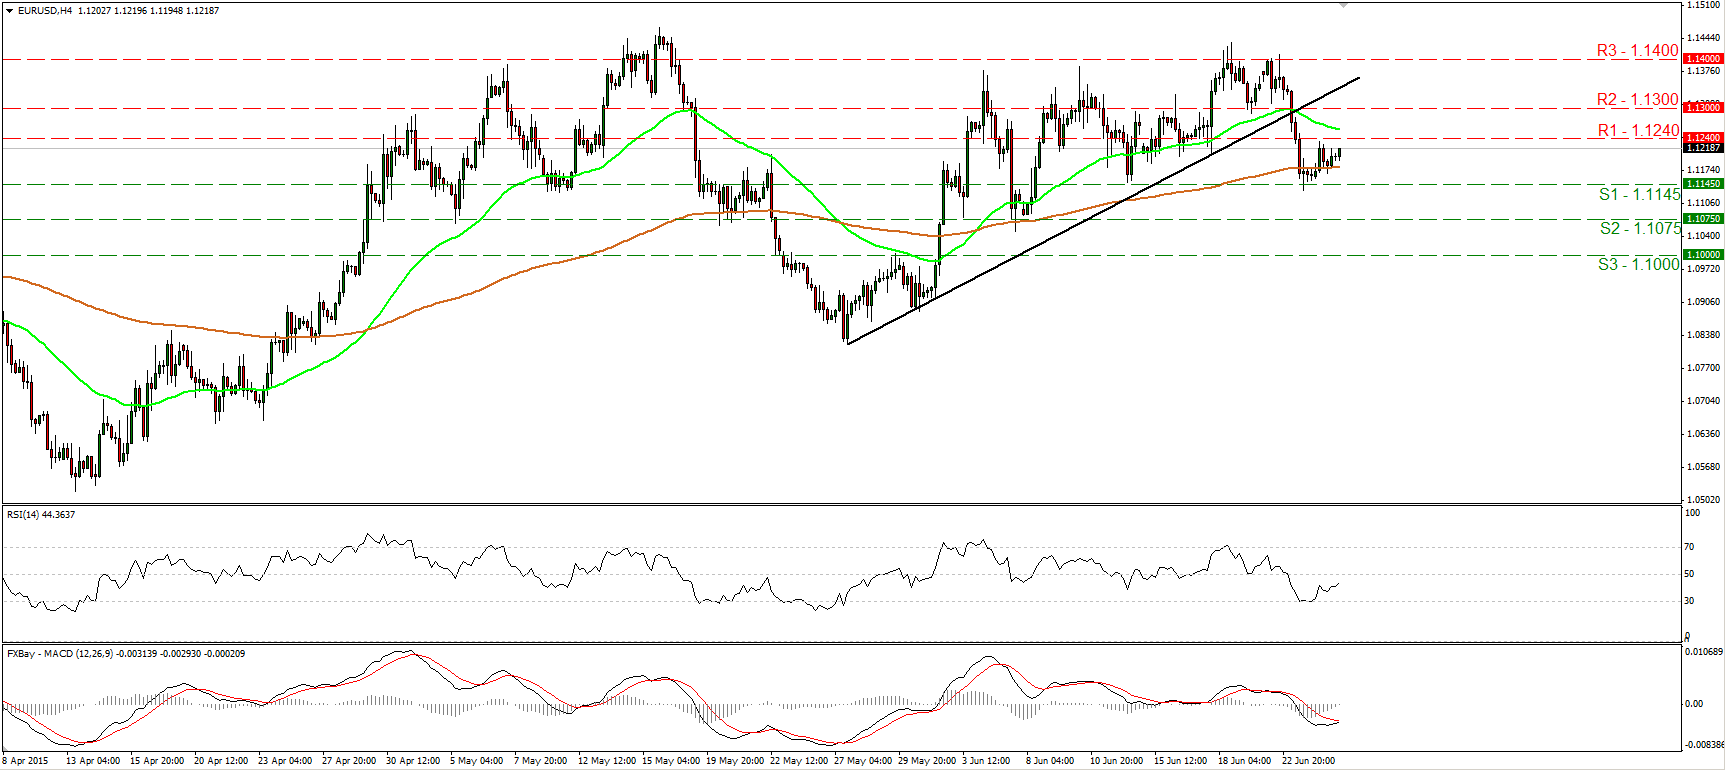
• EUR/USD traded somewhat higher on Wednesday, after it hit support around 1.1145 (S1) on Tuesday. Today, during the European morning, the rate is headed towards the resistance hurdle of 1.1240 (R1), where an upside break could extend the rebound towards the 1.1300 (R2) area. Our momentum studies corroborate the view that the rebound is likely to continue. The RSI rebounded from its 30 line and is now headed towards its 50 barrier, while the MACD has bottomed and could move above its trigger line soon. However, although we may experience further advances for a while, the rate is trading below the short-term uptrend line taken from the low of the 27th of May, and the possibility for a lower high below that line still exists. Therefore, I would consider the short-term bias to have turned somewhat negative, and I would treat the recovery from near 1.1145 (S1) as a corrective move for now. In the bigger picture, I would maintain my neutral stance. I believe that a move above the psychological zone of 1.1500 is the move that could carry larger bullish implications, while a break below 1.0800 is needed to confirm a forthcoming lower low on the daily chart and perhaps turn the overall bias back to the downside.
• Support: 1.1145 (S1), 1.1075 (S2), 1.1000 (S3)
• Resistance: 1.1240 (R1), 1.1300 (R2), 1.1400 (R3)
GBP/USD finds support at 1.5675
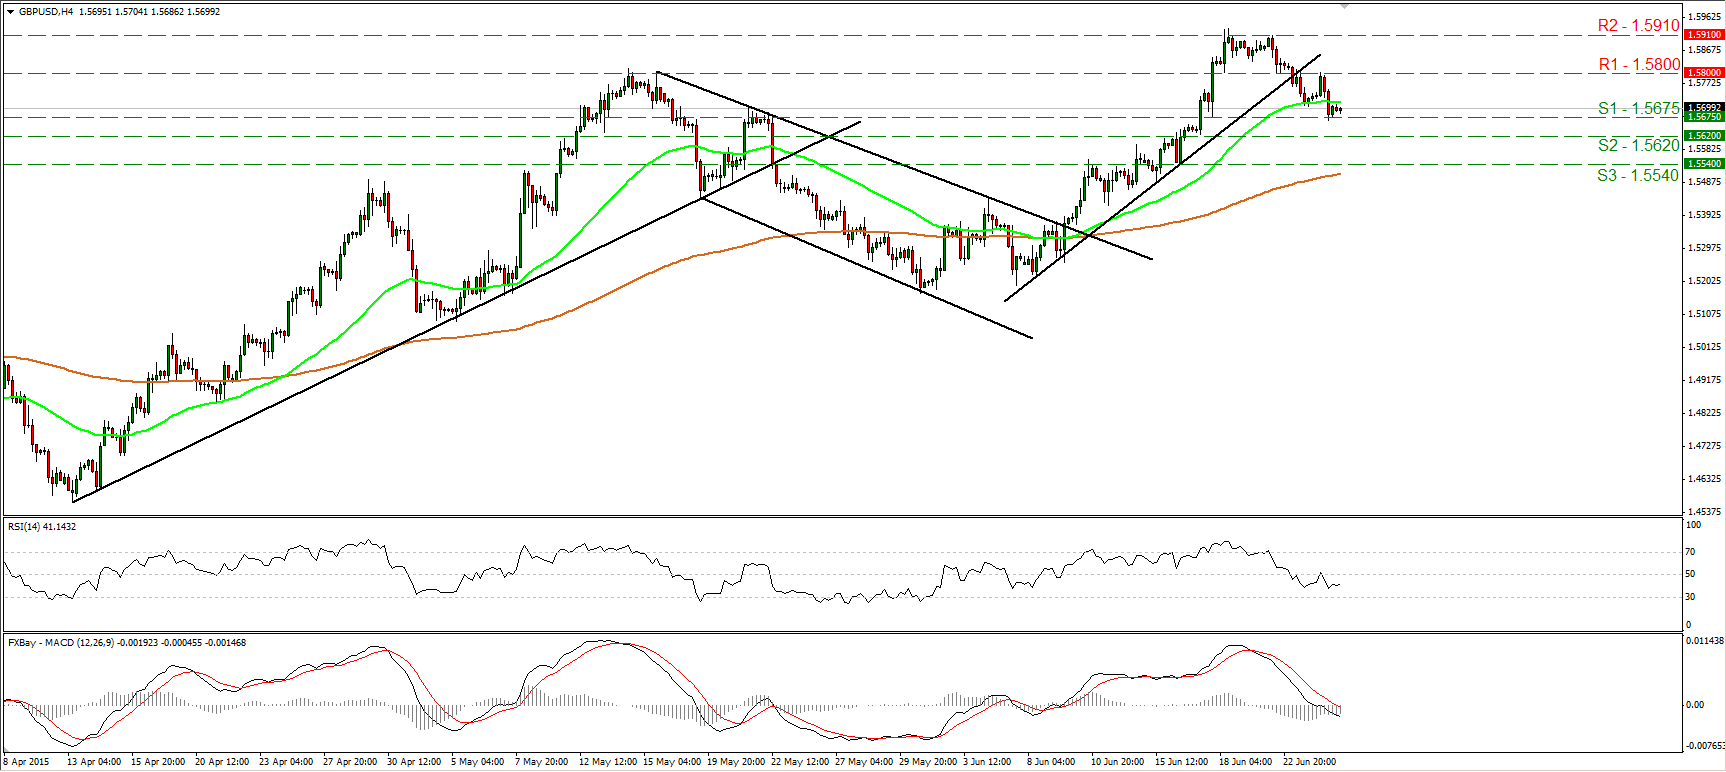
• GBP/USD slid on Wednesday, but the decline was halted at around 1.5675 (S1). Bearing in mind that cable is trading below the prior short-term uptrend line, I would consider the near-term outlook as staying negative. A move below 1.5675 (S1) is likely to initially target the next support obstacle at 1.5620 (S2). Our short-term oscillators detect negative momentum and support the case for further declines. The RSI hit resistance fractionally above its 50 line and moved lower, while the MACD lies below both its signal and zero lines, pointing down. Switching to the daily chart, I see that after rebounding from the 50% retracement level of the 14th of April - 15th of May up leg, GBP/USD moved back above the 80-day exponential moving average. In my view, the break above 1.5800 on the 17th of June confirmed that the overall picture has turned positive. As a result, I would consider any further short-term declines as a corrective move, at least for now.
• Support: 1.5675 (S1), 1.5620 (S2), 1.5540 (S3)
• Resistance: 1.5800 (R1), 1.5910 (R2), 1.6000 (R3)
EUR/JPY finds resistance near 139.10
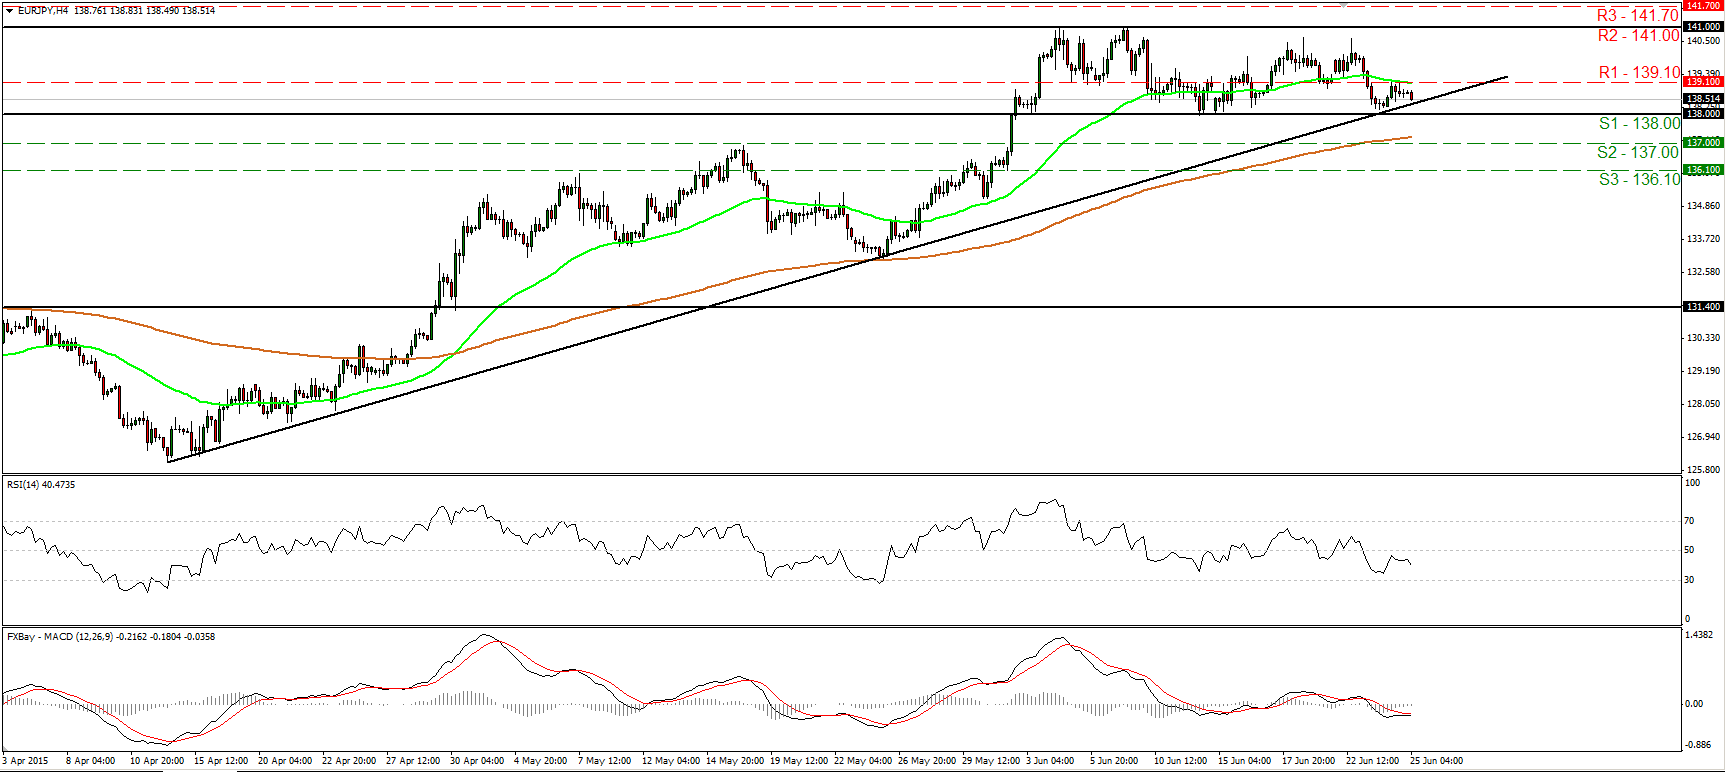
• EUR/JPY traded lower after it hit resistance at around 139.10 (R1). The rate is now approaching the uptrend line taken from the low of the 14th of April. In my view, a break below the support zone of 138.00 (S1) is needed to confirm a forthcoming lower low on the 4-hour chart and perhaps turn the near-term picture to the downside. Such a break is likely to open the way for our next support of 137.00 (S2). Taking a look at our momentum studies, I see that the RSI turned down after finding resistance slightly below 50, while the MACD stands below both its zero and signal lines. On the daily chart, the break above 131.40 on the 29th of April signaled a possible trend reversal in my view. As a result, I would consider the medium-term trend of EUR/JPY to be positive and any near-term declines as just a corrective phase of that uptrend.
• Support: 138.00 (S1), 137.00 (S2), 136.10 (S3)
• Resistance: 139.10 (R1), 141.00 (R2), 141.70 (R3)
DAX hits resistance at 11645 and tumbles
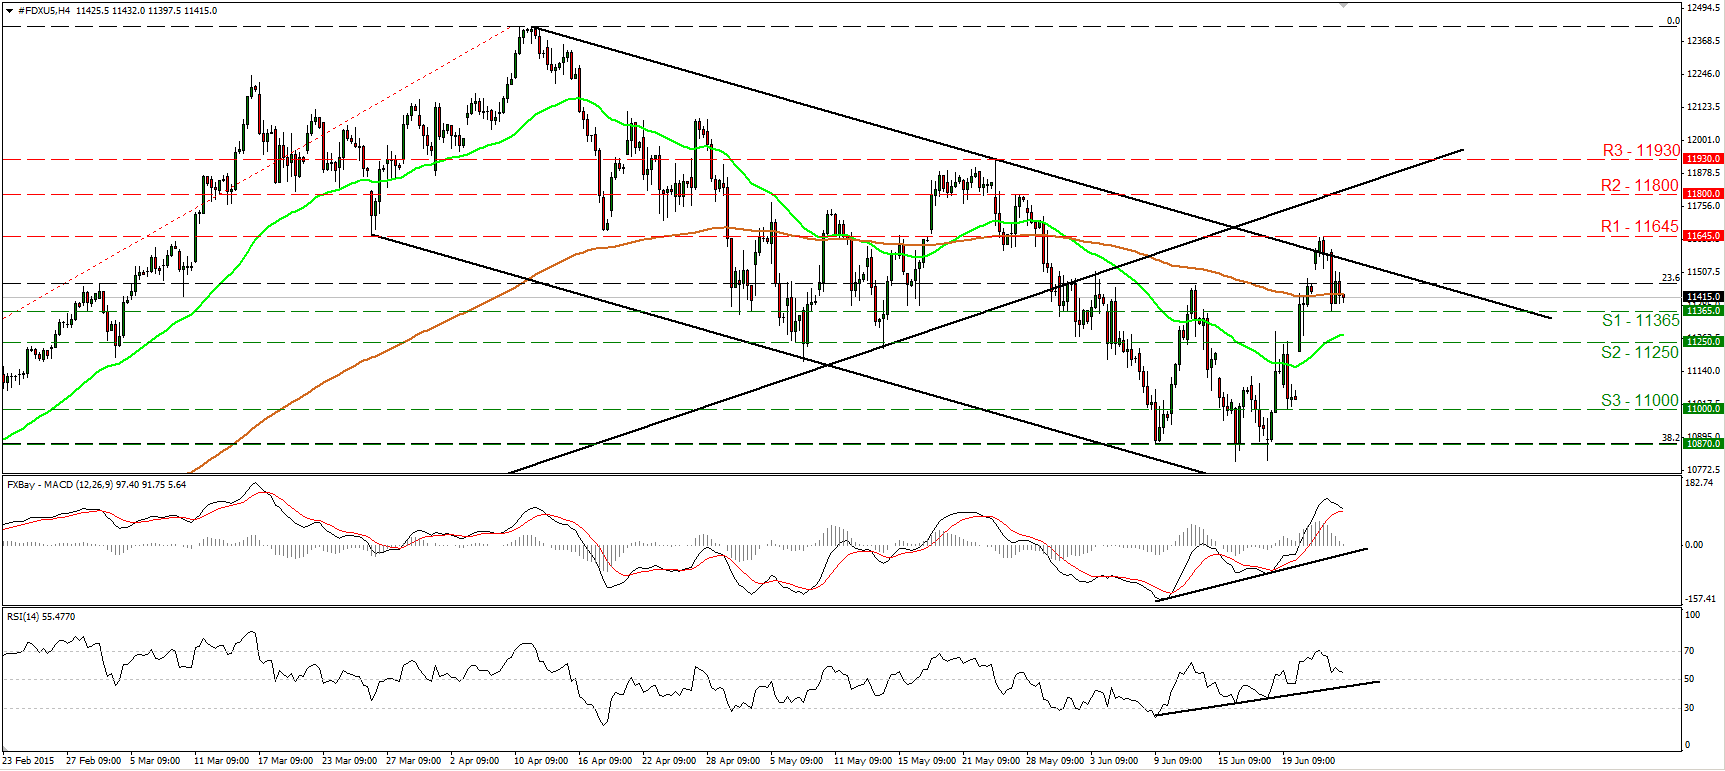
• DAX futures traded lower on Wednesday, after finding resistance at 11645 (R1), slightly above the upper bound of the downside channel that had been containing the price action since the last days of March. Having that in mind, and that the index is still trading below the longer-term uptrend line taken from back at the low of the 16th of October, I would expect the forthcoming wave to be negative. This is also supported by our short-term oscillators. The RSI tumbled after it hit resistance at its 70 line, while the MACD has topped and could fall below its signal line soon. If the bears manage to drive the battle below the 11365 (S1) support line, I would expect them to initially target the 11250 (S2) area. Another break through that support could have larger bearish implications and perhaps target the 11000 (S3) zone. In the bigger picture, although the index remains below the uptrend line taken from the low of the 16th of October and is now trading back within the downside channel, I would hold my flat stance. Only a clear close below the 10800 zone could make me confident on the medium-term downside path.
• Support: 11365 (S1), 11250 (S2), 11000 (S3)
• Resistance: 11645 (R1) 11800 (R2), 11930 (R3)
Gold rebounds from 1170
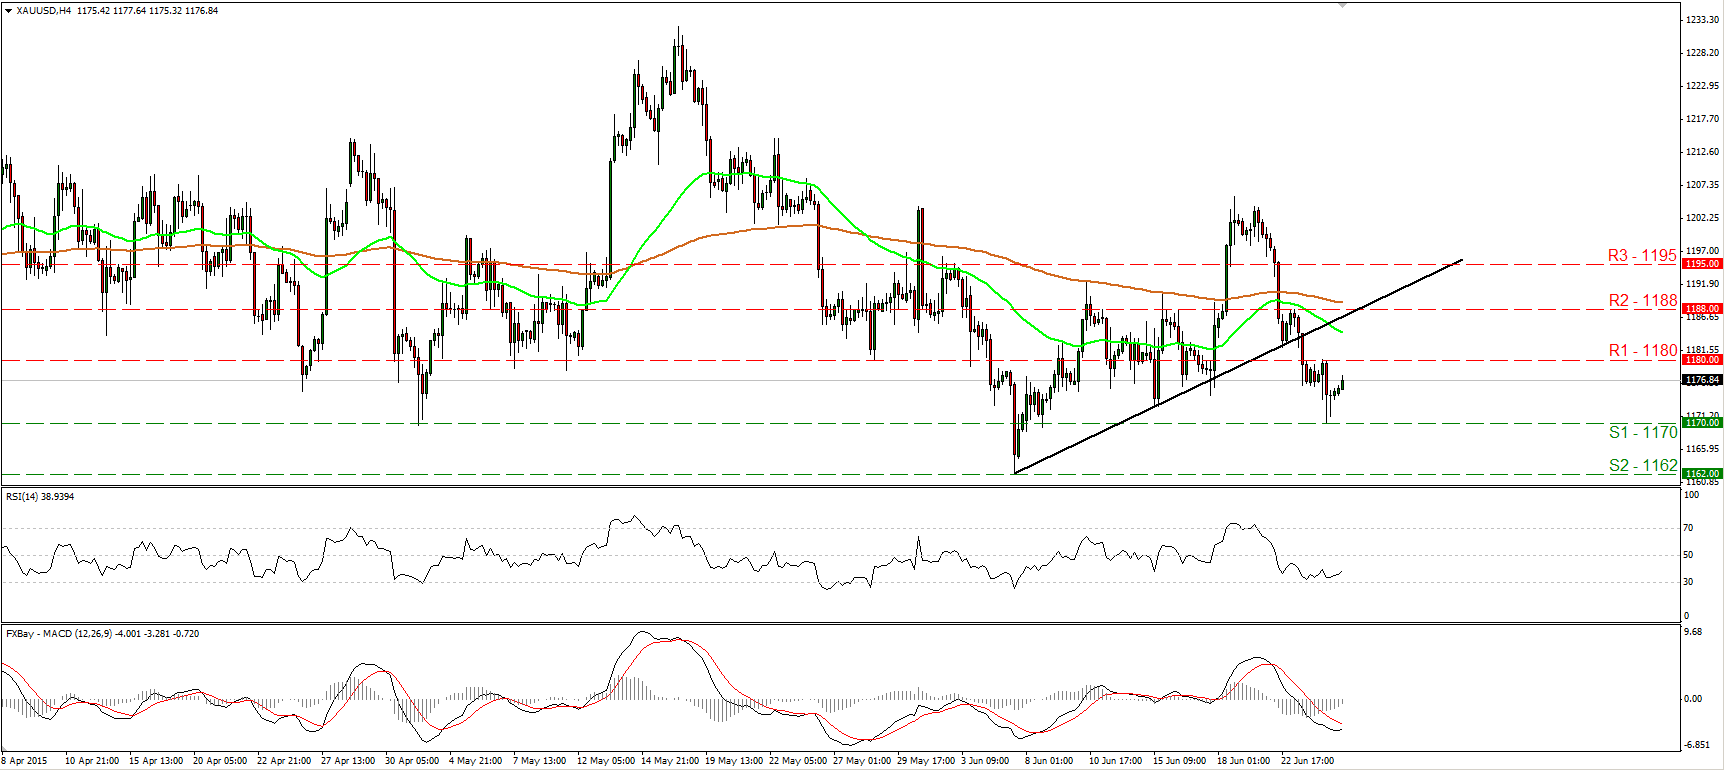
• Gold edged higher after it hit support at 1170 (S1). As long as the metal is trading below the short-term uptrend line drawn from the low of the 5th of June, I would consider the short-term picture to be somewhat negative. However, I see signs that the current upside corrective move may continue a bit more. The RSI has turned up after finding support marginally above its 30 line, while the MACD has bottomed and could move above its trigger line any time soon. A clear move above 1180 (R1) would confirm further upside correction and perhaps open the way for the next resistance at 1188 (R2). As for the bigger picture, the overall outlook remains somewhat negative. However, I would prefer to see a decisive close below the previous low at 1162 (S2), before I get more confident on the downside.
• Support: 1170 (S1), 1162 (S2), 1153 (S3)
• Resistance: 1180 (R1), 1188 (R2), 1195 (R3)

