Fed officials are still on track for a rate hike Fed Chair Yellen gave no hint on the timing of the first rate hike, and disappointed those who were expecting a signal for a hike as early as in September. Yellen also repeated that the path of rate increases to follow is more important than the timing of the lift-off, and that the timing will be data depended. She also said that the increases are likely to be gradual.
The most important result, however, was the distribution of the “dot plot.” Fed officials lowered their interest rate forecasts, which turned out to be more dovish than expected. The Committee seems to be fairly split between one and two hikes. This is definitely less clear than the previous FOMC forecast, where the Committee was projecting two rate hikes this year. As for the economic outlook, the economic growth projections were lowered, with the range now being from 1.8% to 2% compared to 2.3% to 2.7% in the last round of forecasts in March. The unemployment rate by year-end was now expected to range from 5.2% to 5.3% compared with 5% to 5.2% previously, while consumer prices were unchanged from the range projected in March. We believe that despite the lowered interest rates forecasts and the downward revision of the economic outlook, September remains the most likely lift-off month, though the likelihood may have declined a bit. If the economic outlook continues to improve in the next months and the momentum picks up, the first rate hike could occur in September and the USD could regain its strength.
Kiwi plunged after the country’s GDP growth slowed in Q1, missing estimates of a moderate decline in the pace of expansion. This added to the recent soft data and increased the likelihood for another rate cut by RBNZ this year. NZD is expected to remain under selling pressure, especially if data going forward continue to disappoint.
Today’s highlights: The Swiss National Bank (SNB) and Norway’s central bank hold their policy meeting. The forecast is for the SNB to remain on hold. Since the last meeting in March, conditions in Switzerland have deteriorated, with CPI dipping further into deflation and 1Q GDP contracting. Nevertheless, unless the SNB believes that the stronger CHF could have a negative impact on the economy, we would expect the bank’s stance to remain unchanged.
In Norway, the Norges Bank meets to decide on its interest rates. The market expects the Bank to deliver a 25bp rate cut. Although Norway’s CPI is still close to the Bank’s 2.5% target, negative developments since the last meeting, including much worse-than-expected industrial production and manufacturing PMI, and a weak Q1 GDP growth rate could be the reasoning behind such a move. Despite the stabilization in oil prices, the drop in oil investments is still affecting the oil-related sectors. Cost cuts and layoffs from the sector could put upward pressure in Norway’s unemployment rate, although the rate stands at the low level of 2.7%. Therefore, the Bank’s decision could bring NOK under increasing selling pressure.
As for the indicators, we get the UK retail sales and the US CPI, both for May. UK retail sales are expected to fall a bit, a turnaround from the previous month. This could weigh a bit on GBP and take some of its recent gains. As for the US CPI, coming a day after the FOMC meeting and the new projections, a strong surprise is needed for investors to alter their view on the inflation outlook. US initial jobless claims are also coming out.
On Thursday, there is a Eurogroup meeting as well. Greek Finance Minister said recently that Greece is not planning to present new reform proposals at this meeting; therefore, this meeting could also be a short one. Meanwhile, deposit outflows from Greek banks are accelerating, as implied by the large increase in ELA financing to Greek banks by the ECB last week. Failure to reach an agreement would likely lead to capital controls and a meaningful impact on peripheral bonds and the common currency. This could also cause an emergency EU leaders summit over the weekend to find a solution for the Greek crisis.
As for the speakers, SNB President Jordan and Norges Bank Governor Olsen hold press conferences following the two Banks’ rate decisions.
The Market
EUR/USD surges after Yellen’s remarks
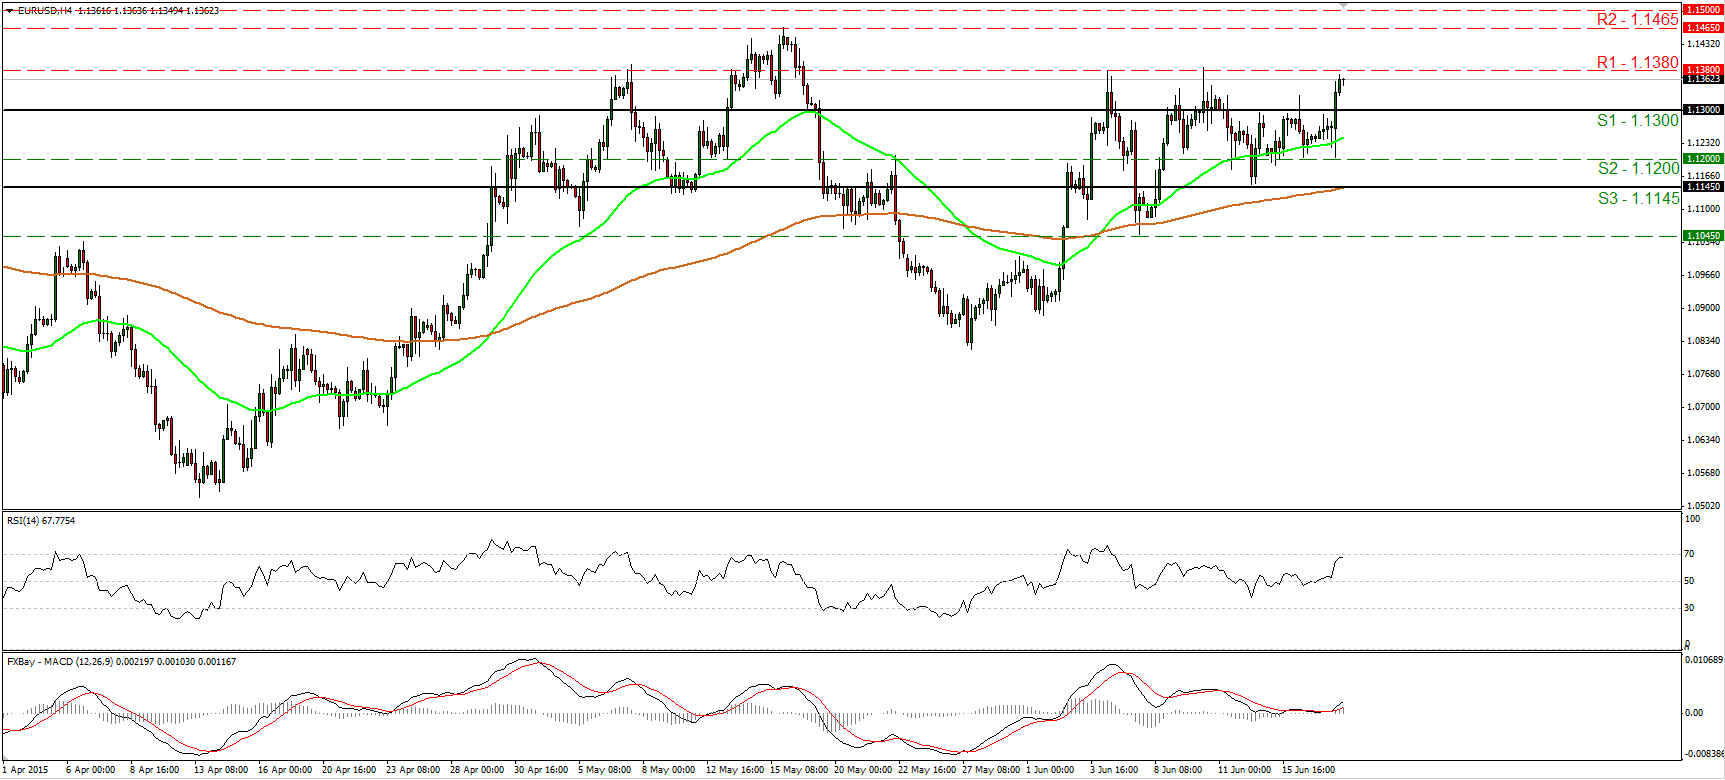
• EUR/USD surged on Wednesday after Fed Chair Yellen disappointed those who had hoped for a clear sign on when the Committee will raise interest rates. The pair emerged above the resistance (now turned into support) hurdle of 1.1300 (S1) and now seems ready to challenge the key obstacle of 1.1380 (R1). A clear and decisive move above that line is likely to extend the bullish wave and perhaps set the stage for extensions towards our next resistance of 1.1465 (R2), marked by the peak of the 15th of May. Our short-term oscillators detect positive momentum. The RSI edged up towards its 70 line, while the MACD rebounded from near its zero line and crossed above its signal line. Nevertheless, the RSI has turned somewhat down after hitting resistance fractionally below 70, thus I would be careful of a possible pullback before the bulls seize control again. As for the broader trend, I believe that a move above the psychological zone of 1.1500 (R3) is the move that could carry larger bullish implications.
• Support: 1.1300 (S1), 1.1200 (S2), 1.1145 (S3)
• Resistance: 1.1380 (R1), 1.1465 (R2), 1.1500 (R3)
GBP/USD races higher after strong UK employment report
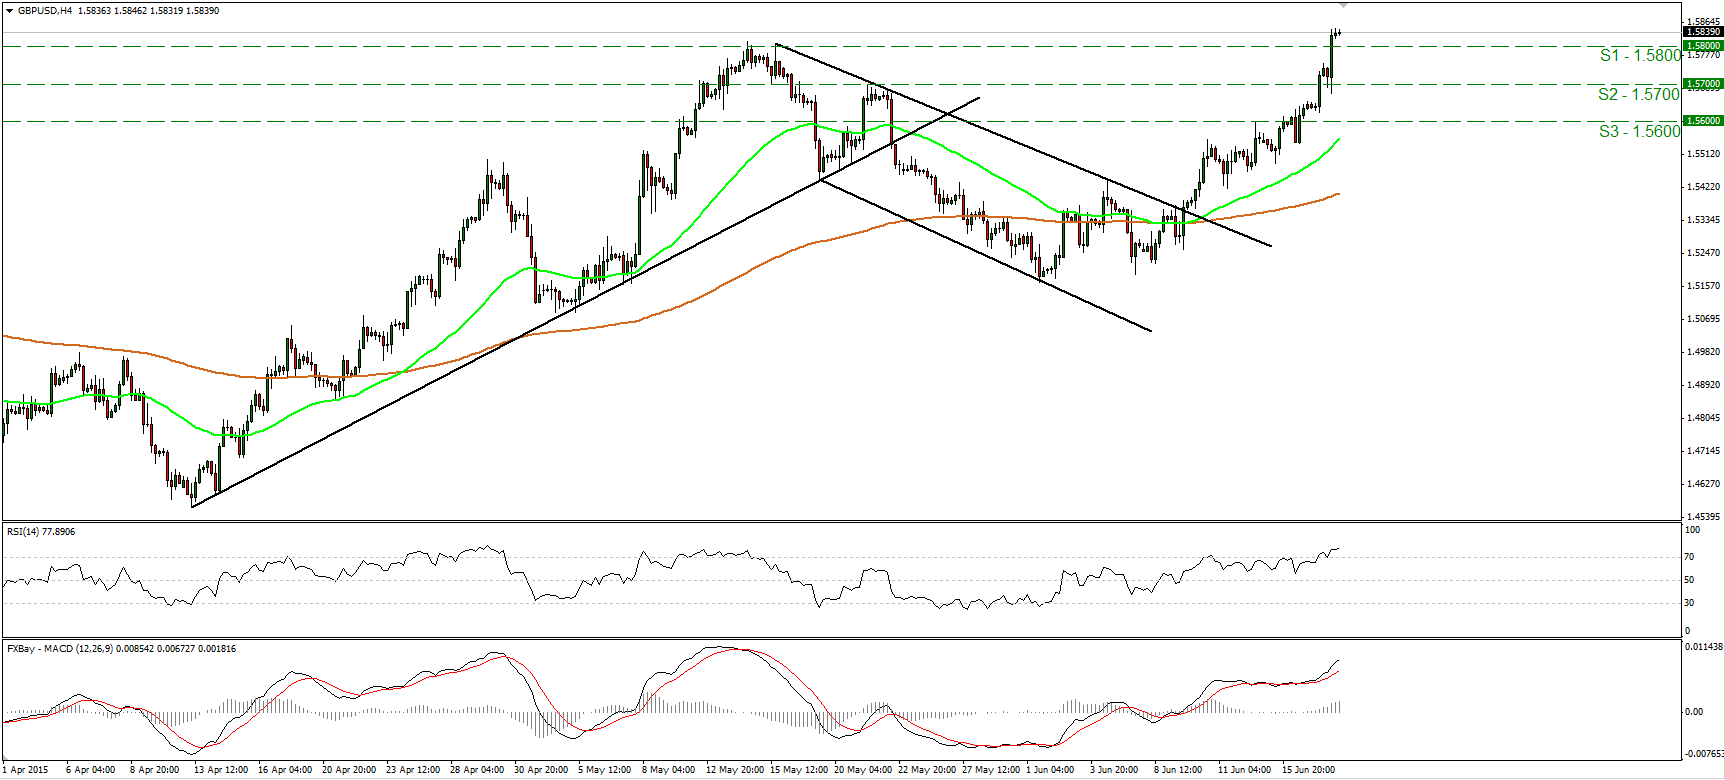
• GBP/USD accelerated higher yesterday after data showed that wages in the UK rose by more than expected. Cable soared and managed to overcome the 1.5800 (S1) resistance (now turned into support), defined by the highs of the 14th and 15th of May. The short-term picture remains positive in my view, and therefore I would expect the pair to continue trading higher and challenge the 1.5950 (R1) line in the near future, marked by the high of the 11th of November. Our oscillators detect strong upside speed and corroborate the view that we are likely to see the pair trading higher. The RSI entered its above-70 territory and is pointing north, while the MACD accelerated above both its zero and signal lines. Switching to the daily chart, I see that after rebounding from the 50% retracement level of the 14th of April - 15th of May up leg, GBP/USD moved back above the 80-day exponential moving average. In my view, yesterday’s move above 1.5800 (S1) confirmed that the overall picture has turned positive as well.
• Support: 1.5800 (S1), 1.5700 (S2), 1.5600 (S3)
• Resistance: 1.5950 (R1), 1.6000 (R2), 1.6175 (R3)
USD/JPY falls below the short-term uptrend line
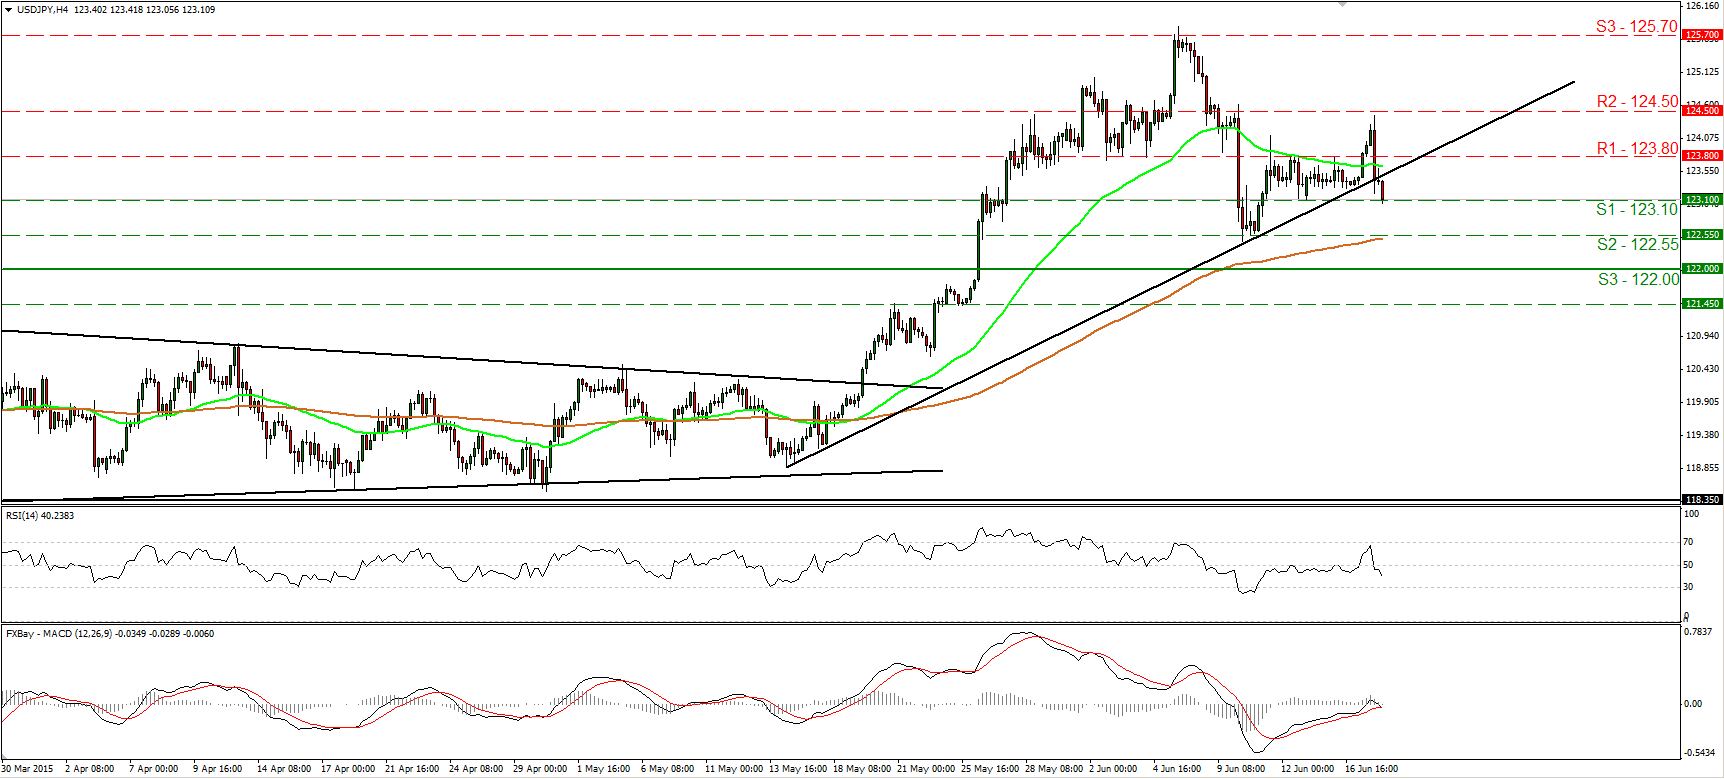
• USD/JPY tumbled on Wednesday, after hitting resistance at 124.50 (R2). The rate fell back below the 123.80 (R1) line and subsequently dipped below the short-term uptrend line taken from back the 14th of May. The short-term bias has now turned negative, and I would expect a move below the support line of 123.10 (S1) to open the way for our next support at 122.55 (S2). Looking at our momentum studies, I see that the RSI fell below 50, while the MACD has topped slightly above zero, turned negative again, and fell below its signal line. These signs support my view for further near-term declines. In the bigger picture, the break above the 122.00 (S3) zone on the 26th of May triggered the continuation of the long-term upside path. I would treat any further near-term declines as a corrective phase of the larger uptrend.
• Support: 123.10 (S1), 122.55 (S2), 122.00 (S3)
• Resistance: 123.80 (R1), 124.50 (R2), 125.70 (R3)
Gold hits support near the uptrend line and shoots up
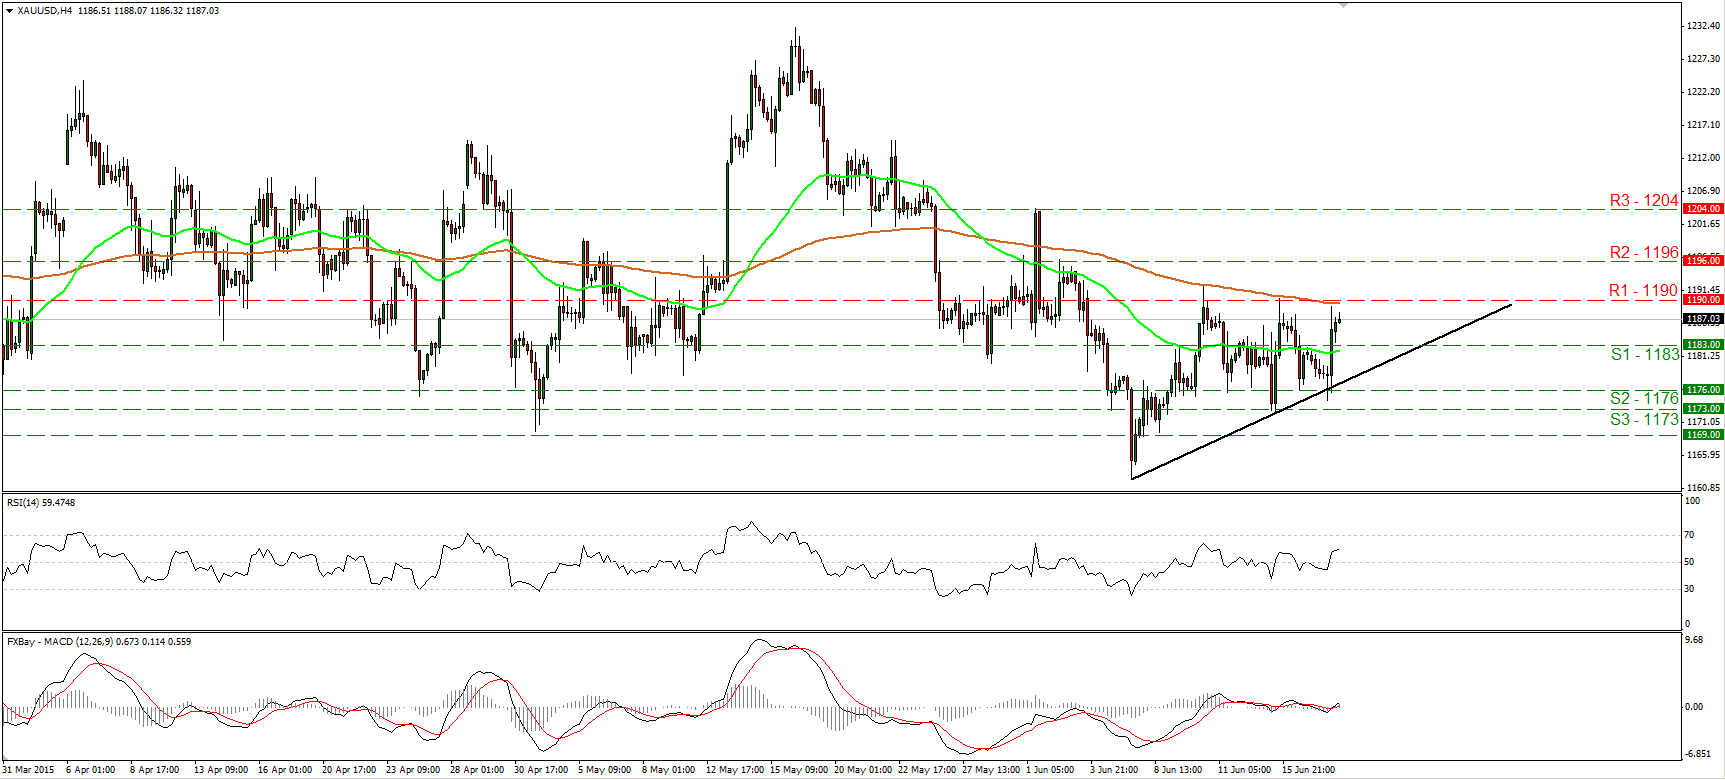
• Gold rallied on Wednesday after hitting support near the short-term uptrend line taken from the low of the 5th of June. The precious metal emerged above the resistance turned into support of 1183 (S1), but the advance was halted slightly below the 1190 (R1) barrier. A move above that line is now needed to confirm a forthcoming higher high on the 4-hour chart. Something like that is likely to target our next resistance of 1196 (R2). Our short-term momentum studies support the notion. The RSI raced higher after crossing above 50, while the MACD has poked its nose above both its zero and signal lines. On the daily chart, the move below 1169 on the 5th of June gives a first sign that the overall outlook has probably turned negative. As a result, I would treat any possible short-term advances as a corrective phase.
• Support: 1183 (S1), 1176 (S2), 1173 (S3)
• Resistance: 1190 (R1), 1196 (R2), 1204 (R3)
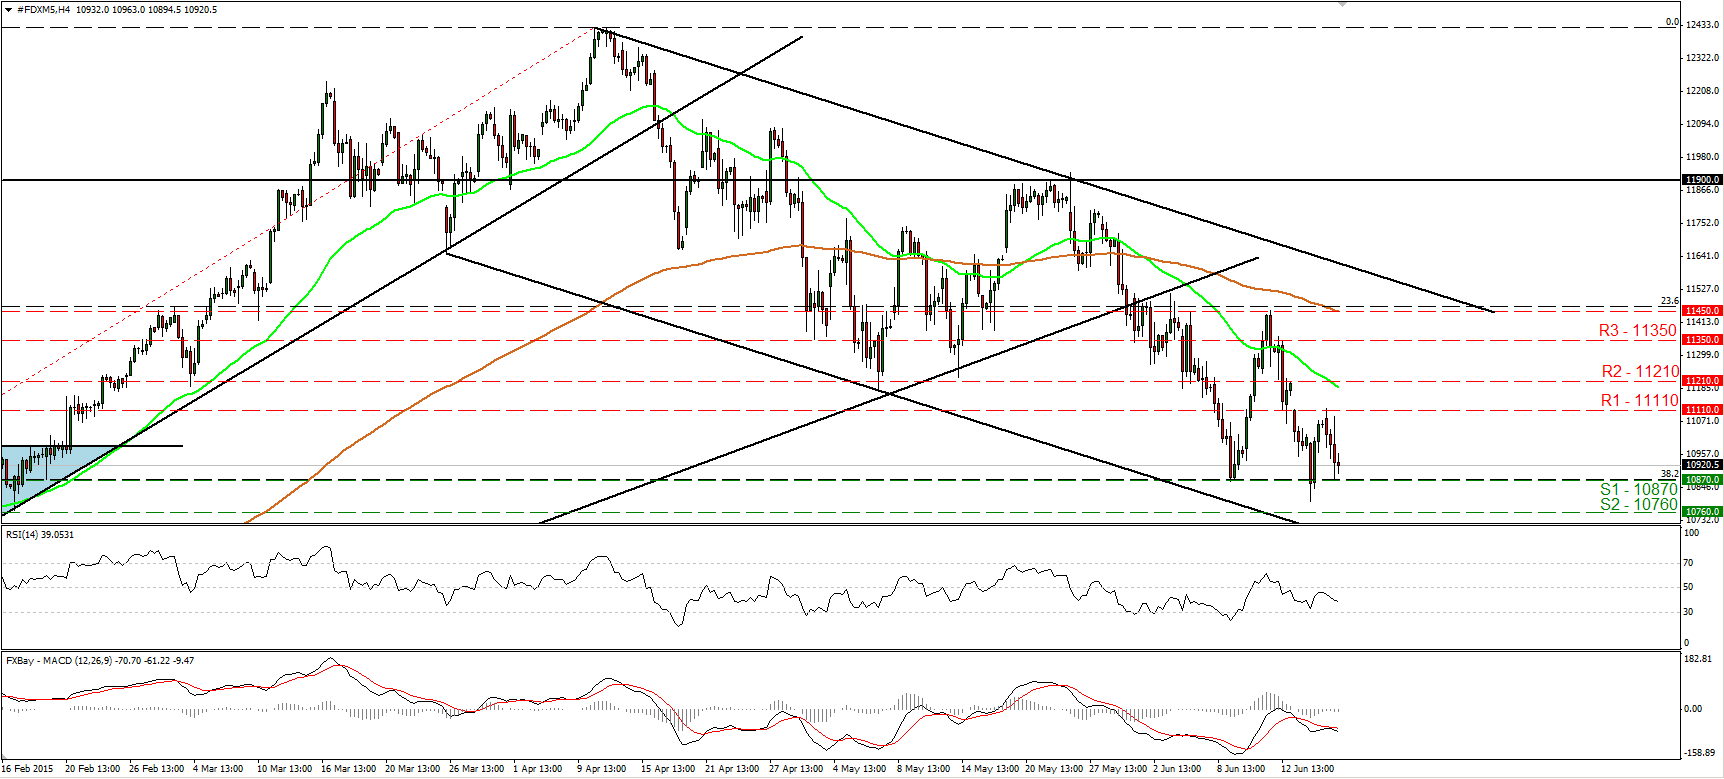
DAX futures decline after hitting 11110
• DAX futures tumbled on Wednesday, after hitting resistance marginally above the 11110 (R1). That move printed a lower high on the 4-hour chart and kept the near-term bias negative. Now the index looks ready to challenge once again the 10870 (S1) line, which happens to be the 38.2% retracement level of the 16th of October – 10th of April advance. A break below that obstacle is likely to challenge the next support at 10760 (S2), marked by the low of the 16th of February. Our momentum studies reveal downside speed and increase the likelihood that we may see the index trading lower in the near term. The RSI turned down after hitting resistance slightly below its 50 line, while the MACD stands below both its zero and trigger lines. In the bigger picture, although the index is trading within a downside channel and below the uptrend line taken from the low of the 16th of October, I prefer to wait for a clear close below 10870 (S1) before I get more confident on the medium-term downside path.
• Support: 10870 (S1), 10760 (S2), 10600 (S3)
• Resistance: 11110 (R1) 11210 (R2), 11350 (R3)

