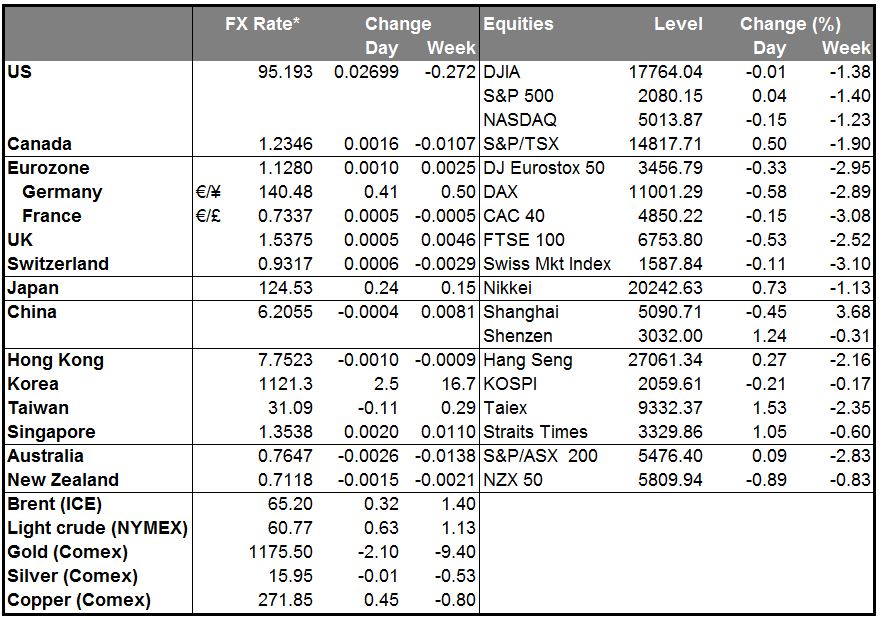
Dollar drifts higher on encouraging US data The pendulum swung back again yesterday as better-than-expected US data improved the relative attractiveness of USD, while the continued stalemate in Greece is weighing on the EUR. The National Federation of Small Businesses (NFIB) optimism index rose more than expected, and the percentage of managers saying they will increase pay held steady. There was also some improvement in key components such as “plans to hire” and “positions not able to fill.” At the same time, the Job Opening and Labor Turnover Survey (JOLTS) job openings rose more than expected in April, and job openings exceeded the number of people hired for the first time ever, indicating a tightening labor market. Signs that the Fed is on the way to achieving its employment mandate pushed Fed funds rate expectations for end-2017 up 4 bps and 10-Year yields up 5.5 bps.
10-year Bund yields were up 7 bps though, so the spread at the long end moved further in Germany’s favour. Still, USD gained against EUR as talks between Greece and its creditors go nowhere, while the clock ticks down to the end-June deadline. Watch what happens later today, when the ECB makes its weekly decision on whether to increase the Emergency Liquidity Assistance (ELA) funds to Greek banks. I expect that they will want to up the pressure on the Greek authorities, and therefore won’t increase the ELA funds, even though outflows from the Greek banks are reportedly accelerating. That should put further downward pressure on EUR/USD.
USD rose against most other G10 currencies too, except NOK, CAD and GBP. A sharp rise in oil prices (WTI up 4.2%!) was the reason why NOK and CAD outperformed. Oil rose on expectations of falling US supply, as indicated by the weekly American Petrolelum Institute (API) data, plus comments by the Saudi oil minister that their increase in output was due to a rise in demand, not an attempt to regain market share. We’ll have to see if the official Energy Information Administration (EIA) data out tonight verifies the privately issued API data. That could push oil up even further and support these currencies. Still, I expect US production to rise in June because of changes to the taxation system that kick in this month, making it more attractive to pump oil, plus limits on how long wells can remain drilled but not pumping. There’s a saying in the oil market that “high prices cure high prices,” and that’s what we’re likely to see happen as the recovery in oil prices off the lows prevents the kind of wholesale shut-down in US shale oil production that some people were looking for.
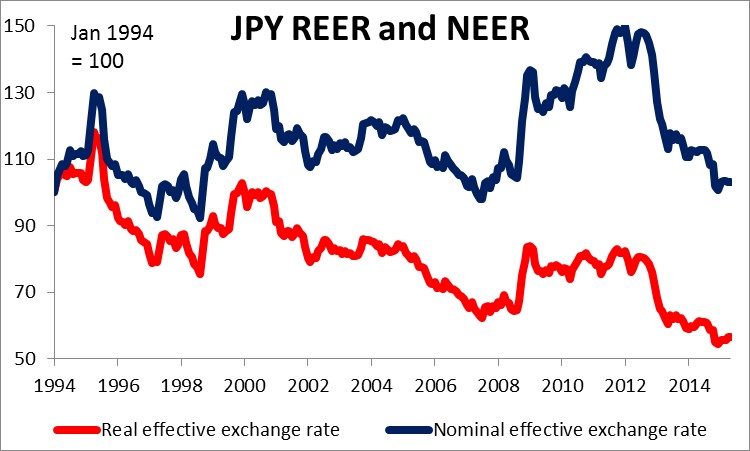
Kuroda kicks USD/JPY Bank of Japan Gov. Kuroda said in the Diet that Japan’s real effective exchange rate is already very weak, and it’s hard to see it falling more. He noted that the yen has returned to levels it was at before the collaps of Lehman Bros. He’s absolutely right; indeed, on a REER basis, the yen is the weakest it’s been at least since 1994 (the beginning of the BIS data series). That doesn’t mean it can’t weaken further, however. Remember that Japan has the world’s biggest QE program going and is likely to maintain it indefinitely, which over time should weaken the yen further, in my view.
Japan’s machinery orders for April rose 3.8% mom, far better than the market’s estimate of a 2.1% mom decline. Note though that the “market estimate” for this indicator is just a guess, as there’s really no way to forecast this extremely volatile indicator. The figure had no impact on the FX market.
Today’s highlights: On Wednesday, we have a relatively light calendar of events. During the European day, French industrial production for April is due to be released.
From Norway, we get the CPI for May. The country’s CPI rate is still close to the central bank’s 2.5% target, even though it declined to 2.0% yoy in April vs 2.3% yoy in March. Given that Norway’s central Bank mentioned the likelihood of a rate cut in June at their last policy meeting, the market is likely to pay more attention at this week’s release. Therefore, despite the solid growth figures that took off some pressure from the Bank to act, another disappointment in the CPI figure could hint at a rate cut and put NOK under increased selling pressure.
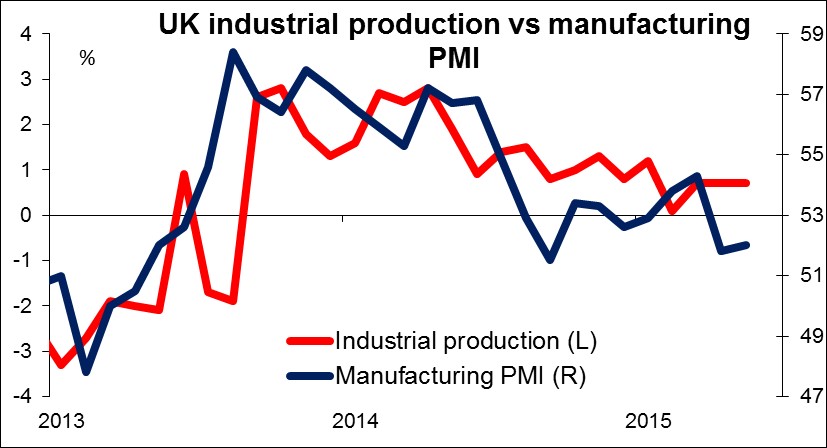
In the UK, industrial production for April is coming out. Following the disappointment in the manufacturing and service-sector PMIs, expectations for a broad rebound in the nation’s growth has lessened. The forecast is for the monthly figure to remain unchanged while the annual rate is expected to decelerate. A strong positive surprise in industrial production following the sharp narrowing in trade deficit is needed to keep the scenario for a rebound in Q2 alive.
Later, during the end of the US session, RBNZ holds its policy meeting. At their last meeting, the Bank turned dovish and no longer mentioned the conditions for raising rates, but only for dropping them. A similar stance at this meeting is likely to keep NZD under selling pressure. The market’s estimate of the likelihood of a rate cut has been steadily increasing. It now stands at 61%, up from 33% a month ago. Similarly, out of the nine economists whom Bloomberg polled in May and June, five forecast a cut and four forecast no cut. So apparently the market leans towards a cut, but conviction is low. That means there is still room for NZD to decline if they do cut, or looked at the other way, for it to appreciate if they don’t. In other words, expect some volatility from NZD overnight!
As for the speakers, BoE Governor Mark Carney and Chancellor of the Exchequer George Osborne will address the annual Mansion House dinner. Last year, Gov. Carney shocked the markets with his comments that interest rate hikes could come sooner than expected. A year later, and the interest rates are still at 0.5%. Nevertheless, he could shock the markets again this year if he provides any guidance on the timing of the first rate rise.
The Market
EUR/USD hits support at 1.1210
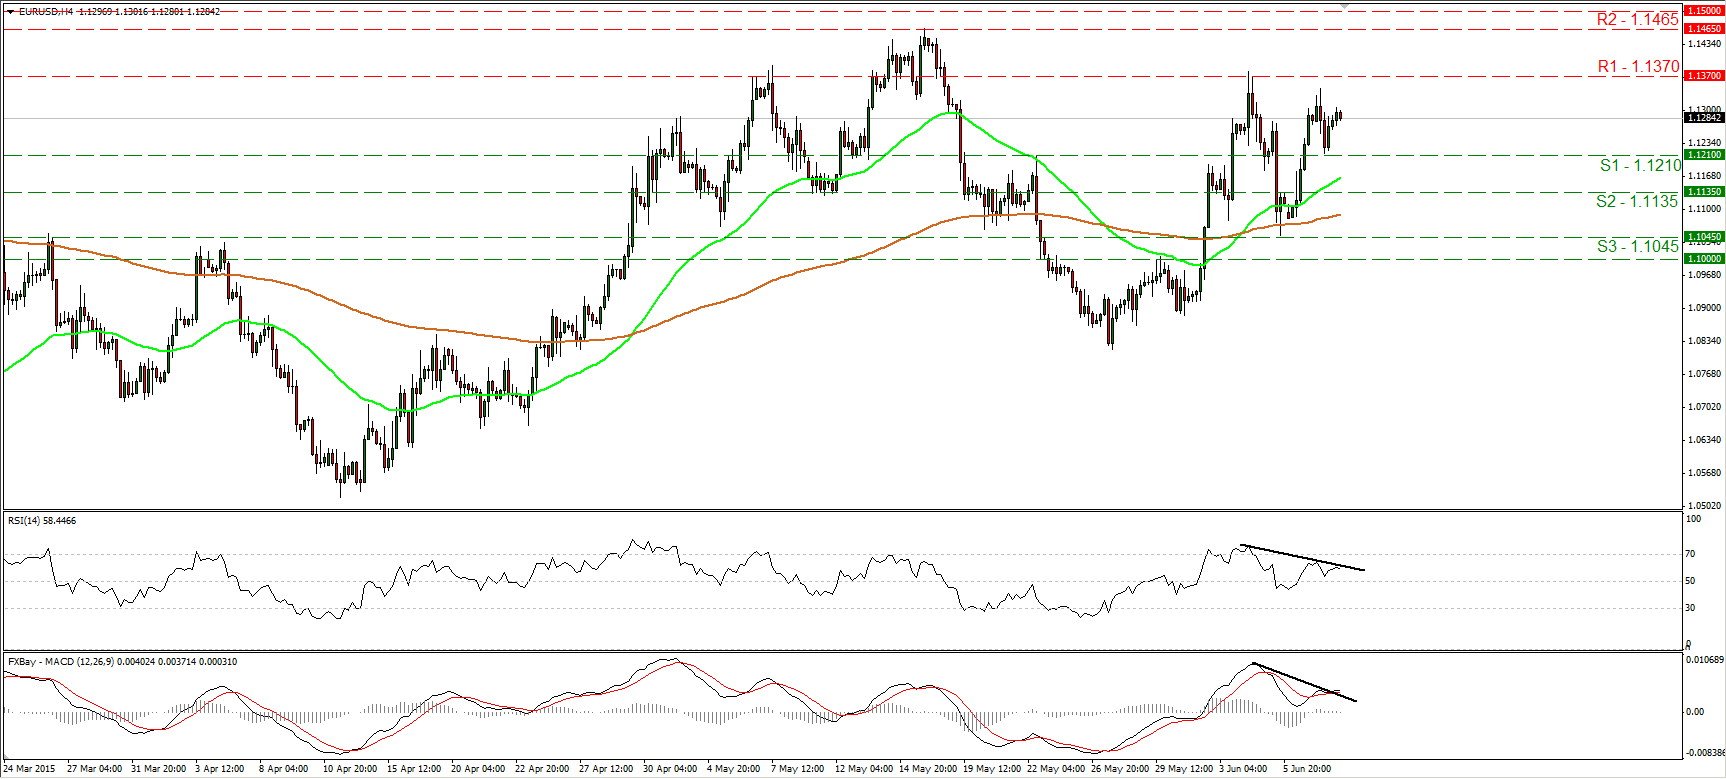
EUR/USD slid somewhat on Tuesday, hit support at 1.1210 (S1), and then recovered to trade virtually unchanged. Given that the rate failed to reach the resistance line of 1.1370 (R1), and the mixed signs given by our short-term oscillators, I would switch my stance to neutral for now. The RSI hit resistance at its downside resistance line and turned down, but the MACD has moved above its respective resistance line. A break above 1.1370 (R1) is needed to confirm a forthcoming higher high on the 4-hour chart, and perhaps turn the short-term picture to the upside. Such a move could prompt extensions towards our next resistance of 1.1465 (R2). On the downside, a move below 1.1210 (S1) would signal the completion of a minor-term failure swing top and perhaps challenge the next support at 1.1135 (S2). In the bigger picture, I believe that the move that could carry larger bullish implications is a clear close above the psychological zone of 1.1500 (R3).
• Support: 1.1210 (S1), 1.11350 (S2), 1.1045 (S3).
• Resistance: 1.1370 (R1), 1.1465 (R2), 1.1500 (R3).
EUR/JPY oscillates around the 140.00 barrier
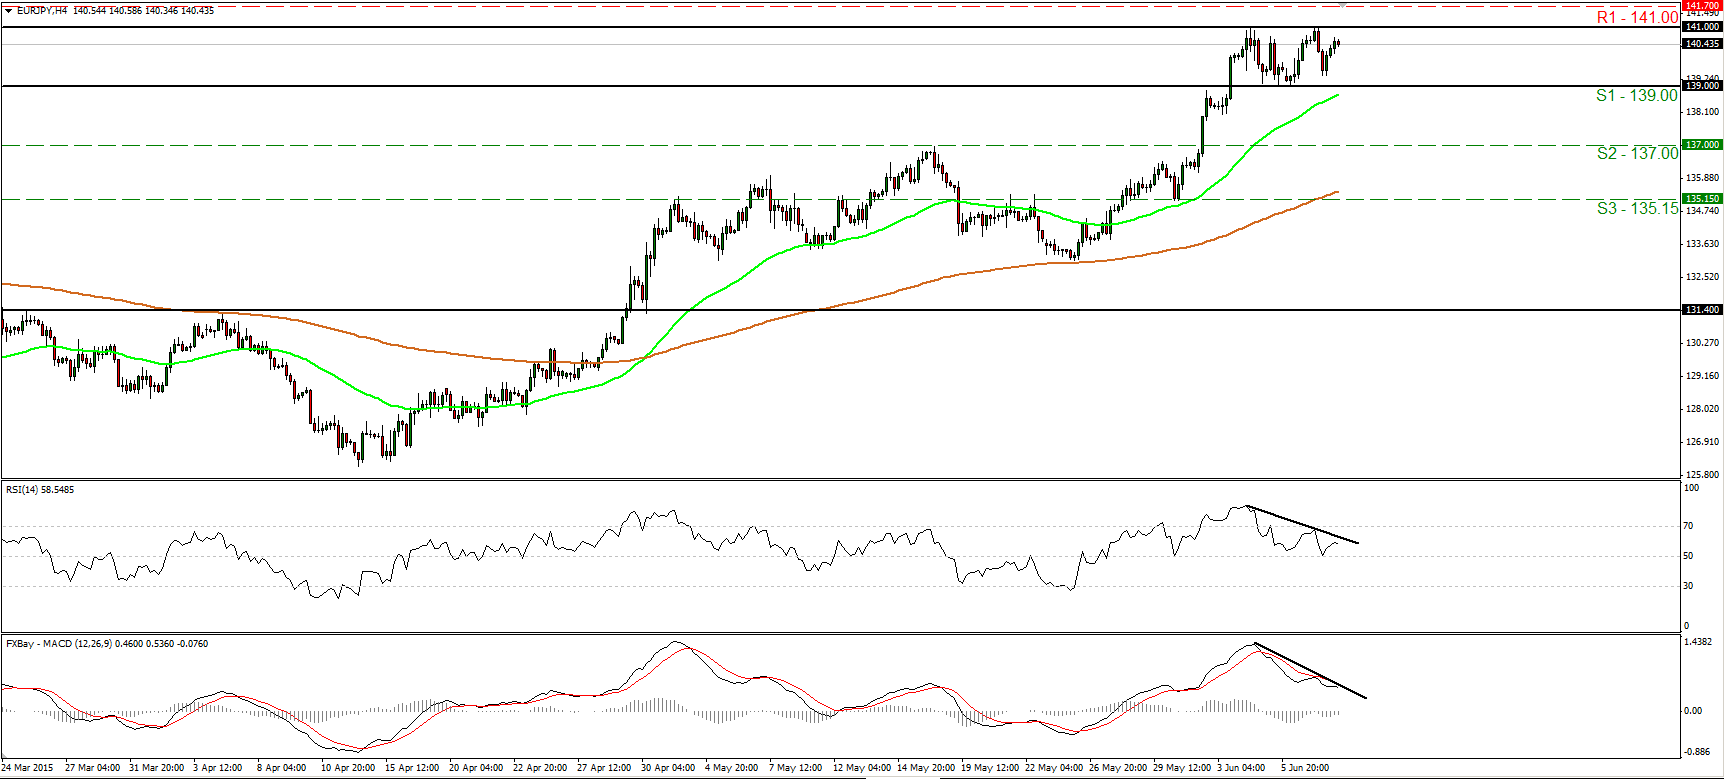
EUR/JPY has been trading in a sideways mode around the round number of 140.00 since the 3rd of June. It has been oscillating between 139.00 (S1) and 141.00 (R1), so I believe that a clear break above 141.00 (R1) is necessary to trigger the resumption of the prevailing uptrend. Something like that could initially target our next resistance of 141.70 (R2). However, taking into account that there is negative divergence between both our short-term oscillators and the price action, I would stay cautious that a pullback could be looming before the next positive leg. On the daily chart, the break above 131.40 on the 29th of April signaled a possible trend reversal in my view. Therefore, I would consider the medium-term trend of EUR/JPY to be positive.
• Support: 139.00 (S1), 137.00 (S2), 135.15 (S3).
• Resistance: 141.00 (R1), 141.70 (R2), 142.20 (R3).
NZD/USD in a sideways mode
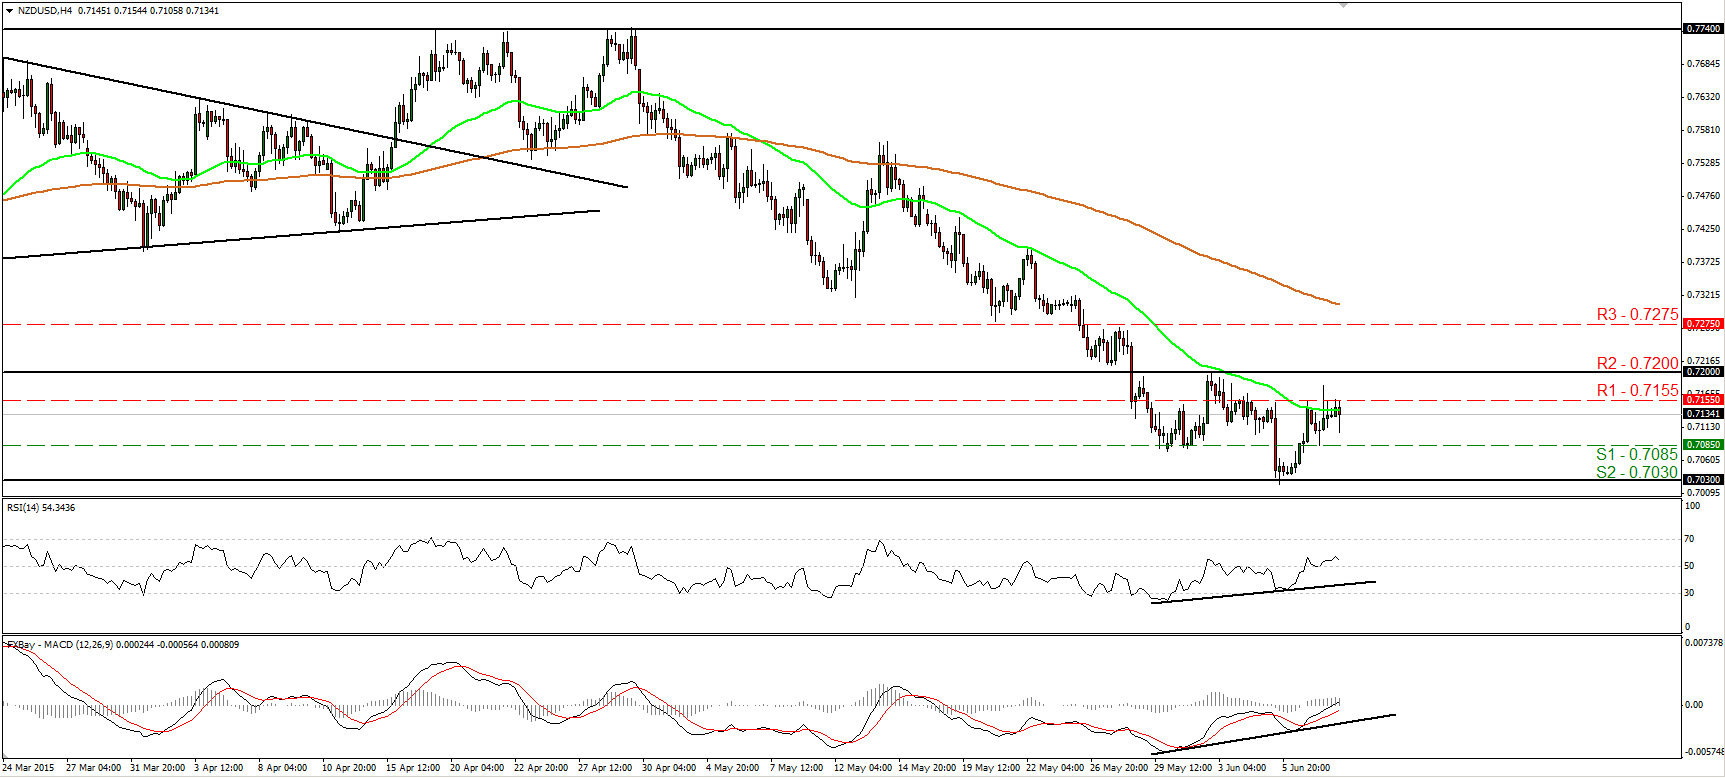
NZD/USD has been trading in a short-term trading range between the support of 0.7030 (S2) and the resistance of 0.7200 (R2). Taking this into account and the fact that there is positive divergence between our short-term oscillators and the price action, I would take the sidelines for now. The prevailing longer-term path of the pair is to the downside, but I believe that a clear close below the round figure of 0.7000 (S3) is the move that could signal its resumption. This is a second reason I prefer to stay flat at the moment. The third reason is that taking a look at our daily oscillators, I see signs of decelerating downside momentum. The 14-day RSI rebounded from its 30 line, while the daily MACD, although negative, has bottomed and looks able to cross above its trigger line.
• Support: 0.7085 (S1), 0.7030 (S2), 0.7000 (S3).
• Resistance: 0.7155 (R1), 0.7200 (R2), 0.7275 (R3).
Gold hits resistance at 1183
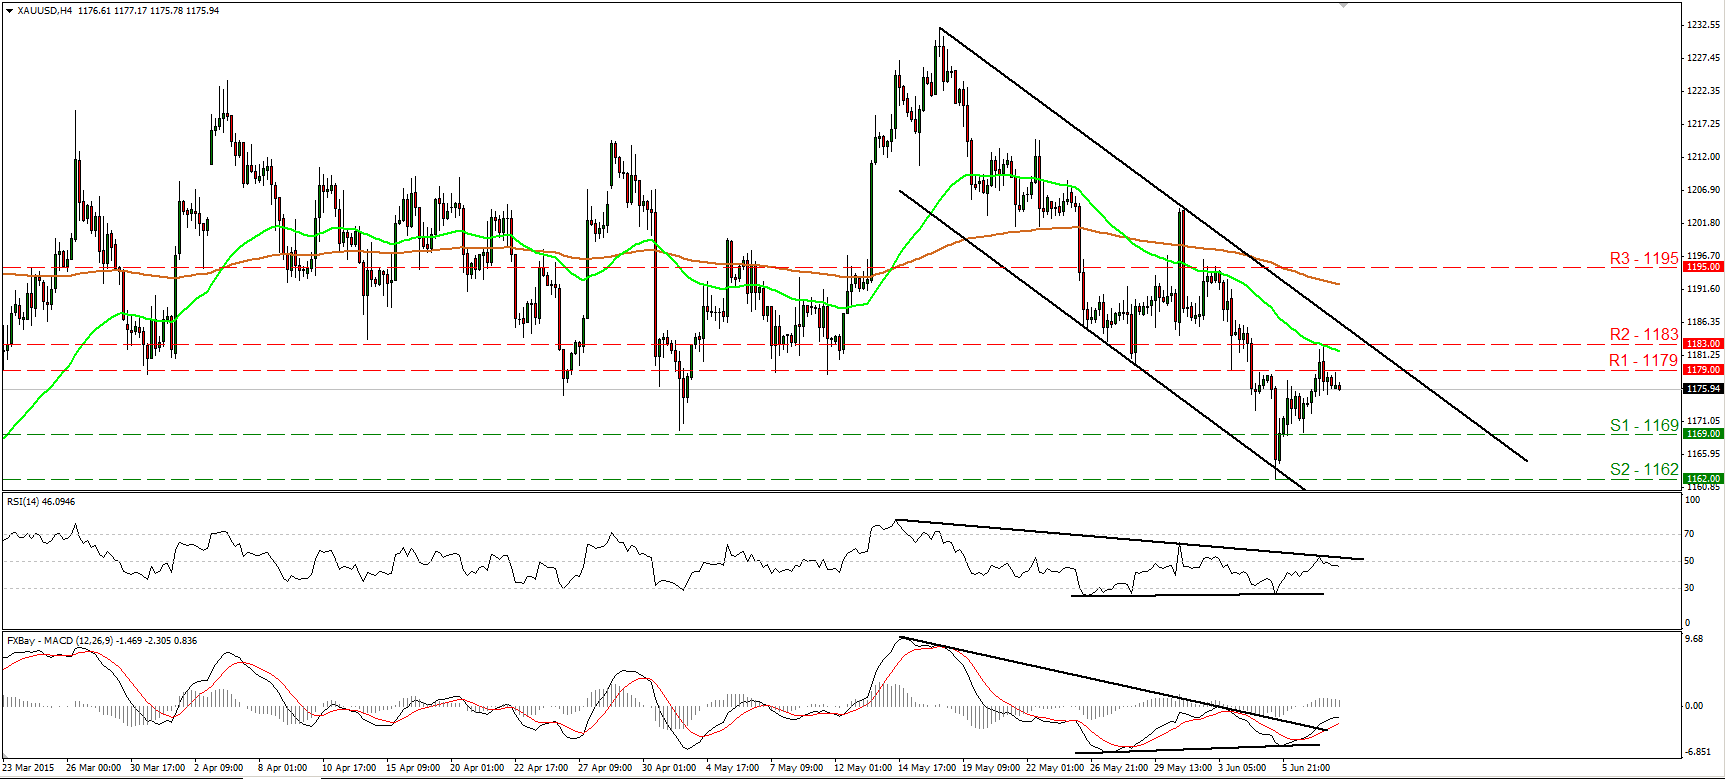
Gold traded higher on Tuesday, but hit resistance at 1183 (R2) and slid back down to trade once again virtually unchanged. Since the metal remains within the black downside channel, I still believe that the short-term picture is negative. I also believe that the next move is likely to be down as well, perhaps for another test at the 1169 (S1) territory. Our short-term oscillators support the notion. The RSI found resistance at its downside resistance line and turned back below 50, while the MACD, already negative, shows signs of topping and that it could fall below its trigger line soon. On the daily chart, the move below 1169 (S1) on the 5th of June gives a first sign that the overall outlook has probably turned negative. This is also supported by our daily oscillators. The 14-day RSI stands below its 50 line, while the daily MACD lies below both its signal and zero lines.
• Support: 1169 (S1), 1162 (S2), 1153 (S3).
• Resistance: 1179 (R1), 1183 (R2), 1195 (R3).
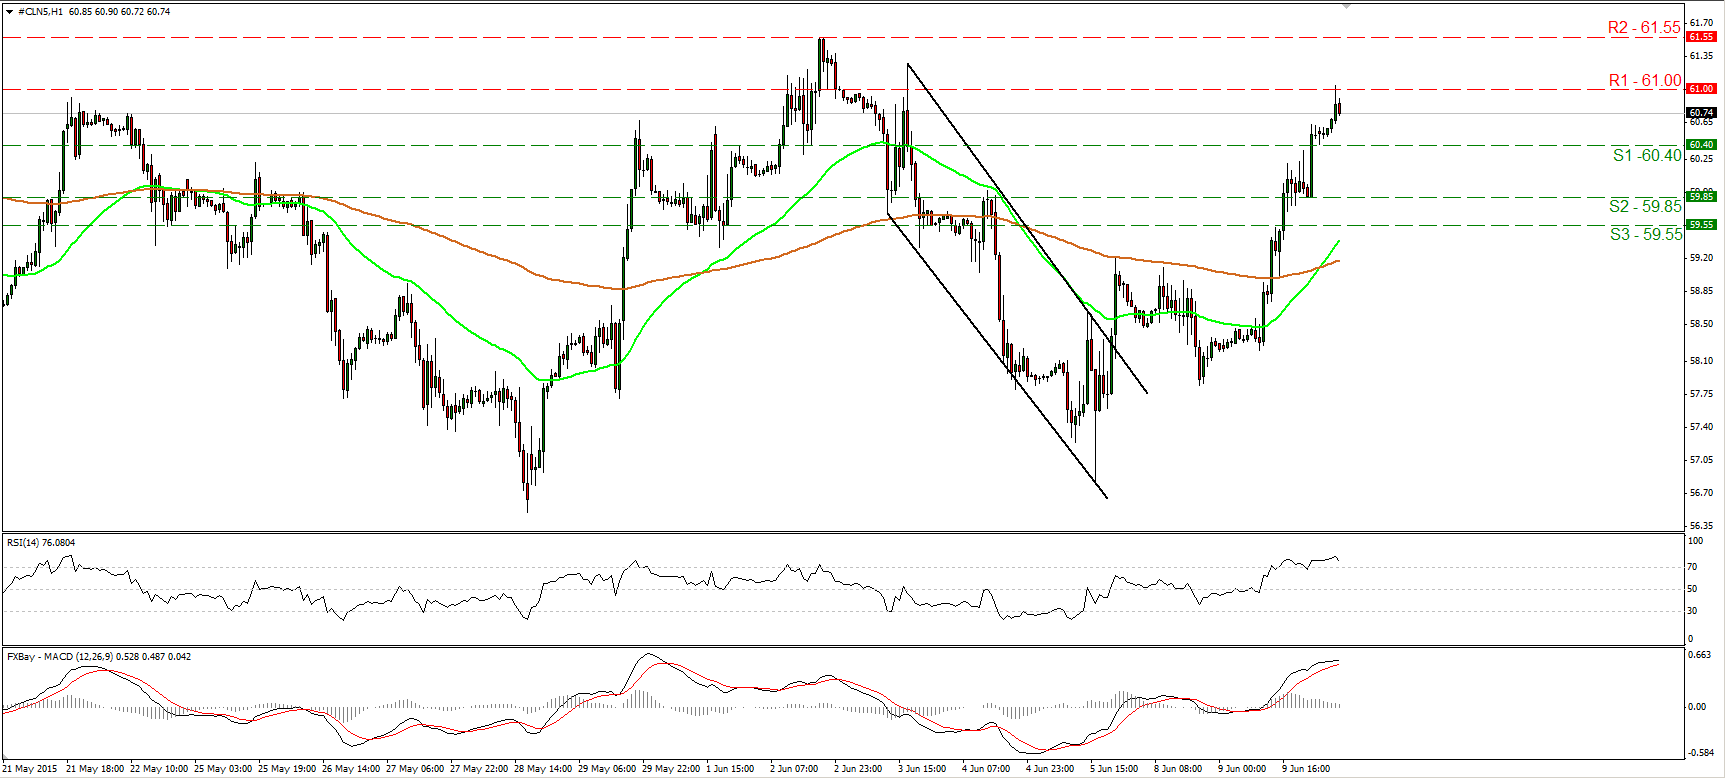
WTI is back above 60.00
WTI soared on Tuesday, moving again back above the round figure of 60.00. Nevertheless, the bulls found resistance a few cents above the 61.00 (R1) barrier. The short-term picture stays positive in my view, thus a decisive move above 61.00 (R1) is likely to open the way for the peak of the 2nd of June at 61.55 (R2). Taking a look at our hourly momentum studies though, I would be careful of a possible pullback before the bulls take the reins again. The 14-hour RSI has topped within its overbought territory and could fall below 70 soon, while the hourly MACD shows signs that it could turn down and fall below its trigger line. As for the broader trend, the break above 55.00 on the 14th of April signaled the completion of a double bottom formation, something that could carry larger bullish implications in the not-too-distant future. Therefore, I would treat any declines that stay limited above 55.00 as a corrective phase for now.
• Support: 60.40 (S1), 59.85 (S2), 59.55 (S3).
• Resistance: 61.00 (R1) 61.55 (R2), 62.50 (R3).

