Greece to dominate the markets this week
After an eventful week last week, the calendar this week is rather sparse. The Reserve Bank of New Zealand (RBNZ) meeting on Thursday is probably the highlight, followed later in the day by the US retail sales for May (see below). I expect the dollar to remain well supported this week in the aftermath of the much better-than-expected employment data for May, especially ahead of the FOMC meeting next week. Although few people expect the Committee to move this month, they could change the tone of their statement to take into account the continued improvement in the labor market.
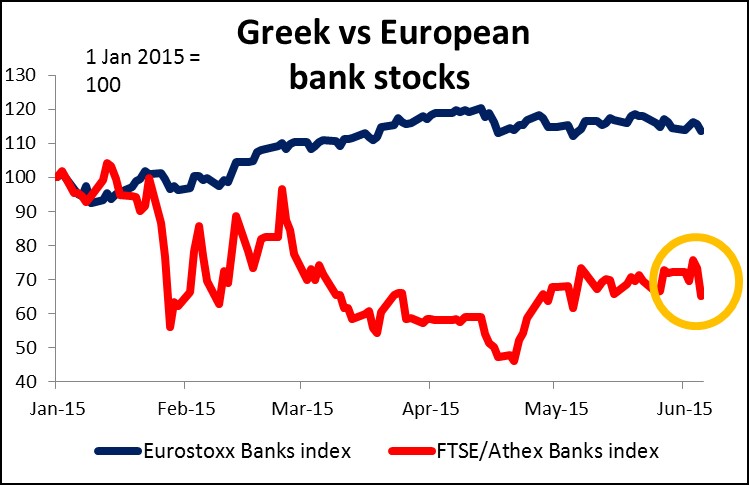
With few major indicators out and the market waiting for the FOMC meeting, the focus will remain on Greece. PM Tsipras’ speech to the Greek parliament on Friday got terrible reviews by the country’s creditors, who according to press reports are losing patience (I’m surprised they have any left.) EC President Juncker Sunday accused Tsipras of distorting the creditors’ proposals and urged him to put forward alternative proposals swiftly to allow negotiations this week. Tsipras may meet EU leaders on the sidelines of an EU-Latin America summit in Brussels on Wednesday. The Bank of Greece Friday reportedly asked the ECB to increase the limit on Emergency Liquidity Assistance (ELA) that the ECB provides to compensate for withdrawals from the banking system. Watch what the ECB decides to do about the ELA at its regular weekly meeting Wednesday. I suspect that once again it will not increase the amount, which will show its displeasure and increase the pressure on Greece. This is likely to be EUR-negative. Note that on Friday, the Athens stock market was down 5% vs -1.3% for the overall European market, while Greek bank stocks plunged 11.3%. This shows that the locals are turning more pessimistic about a successful resolution of the crisis – not an encouraging sign!
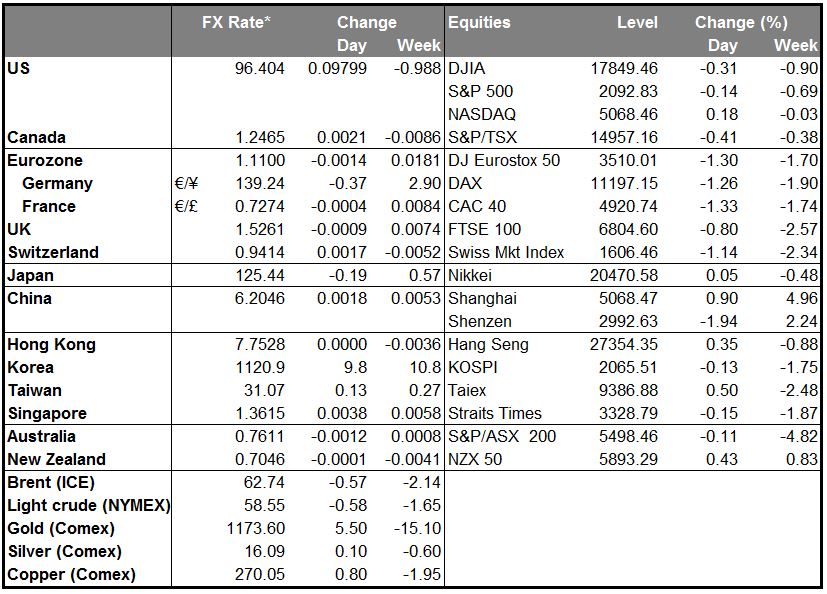
Turkish government loses vote; TRY plunges
The government of President Recep Tayyip Erdogan lost its majority in parliament in the elections over the weekend, winning only 258 seats, 18 short of the number needed for a majority. There will now be either a fragile minority administration, a prolonged period of bargaining among parties, or yet another election, none of which are good for the currency. The constitution requires a coalition to be formed within 45 days, but all three major opposition parties indicated that they don’t want to form an alliance with the ruling AK Party. This means a short-lived minority government is the most likely outcome. TRY has hit a record low this morning. Given the prospect of increased political instability and uncertainty about economic policy, I would not want to try to catch this falling knife.
Japan’s Q1 GDP revised up, April current account surplus shrinks
Japan’s Q1 GDP was revised up to 3.9% qoq SAAR from 2.4%, far exceeding market estimates (2.8%). Upward revisions to business investment (good) and inventory buildup (bad) were behind the revision. The news is positive for JPY as it means less need for the Bank of Japan to increase its stimulus and indeed USD/JPY did move lower on the news. However I would point out that the current account balance shrank in April from the previous month, with the trade balance unexpectedly moving into deficit on a balance-of-payments basis. I think the government will want to keep the trade balance in surplus and thus I don’t think the political pressure for a weaker yen has ended. I would think USD/JPY might be likely to move back up today.
Chinese imports fall faster than expected = AUD-negative
China’s trade surplus rose in May, but not because of any export surge; on the contrary, exports were down slightly on a yoy basis, while imports collapsed. The weak imports suggest that domestic demand is not recovering despite the government’s efforts to stimulate the economy. This is bad news for AUD in particular and NZD as well.
Today’s highlights: During the European day, we get the German industrial production for April.
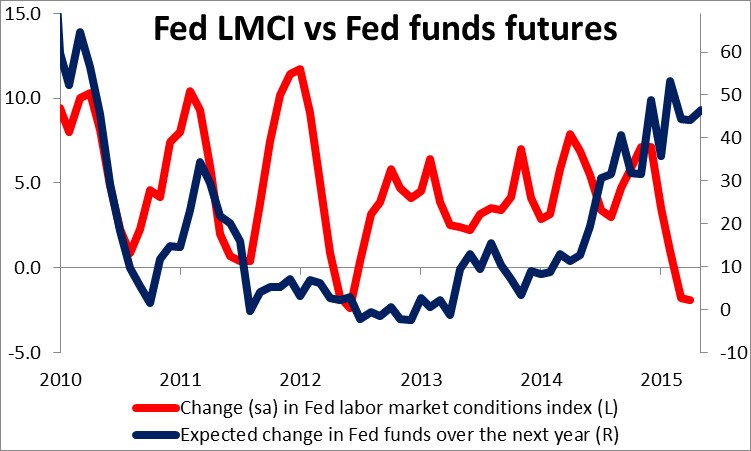
In the US, we get the labor market conditions index for May. This is a monthly index that draws on a range of data to produce a single measure to gauge whether the labor market is on the whole improving. The LMCI index, although not major market mover, summarizes the broad US labor situation in one number and shows whether the Fed is on track to achieve its mandate of “maximum employment.” So far it’s saying no, but the market seems to be thinking differently. There are no forecasts available but I would think that this month’s figure would be somewhat higher, as the labor market data in May was fairly good (higher NFP, lower unemployment, higher participation rate). That could help to extend Friday’s positive sentiment about the dollar.
On Tuesday, we get China’s CPI and PPI data for May. The forecast is for the CPI rate to slow to +1.4% yoy from +1.5% yoy, while the PPI rate is anticipated to fall at a slower pace than in the month before. The slight deceleration in the CPI and the stagnation of the PPI rate in deflationary territory could suggest that the easing measures taken so far has yet to make their way into the real economy. This may also increase the pressure on PBoC to act again in the near future. From the US, the Job Openings and Labor Turnover Survey (JOLTS) brings the “quit rate,” a closely watched indicator of how strong the job market is.
On Wednesday, Norway releases the CPI for May. Uniquely among the G10, their CPI rate is still close to the central bank’s 2.5% target, even though it declined to 2.1% yoy in April vs 2.3% yoy in March. Given that Norges Bank mentioned the possibility for a rate cut in June at their last policy meeting, there will be increased interest on the CPI data for May and any other data going forward the meeting. Therefore, despite the solid growth figures that took off some pressure from the Bank to act, another disappointment in the CPI figure could hint a rate cut and put NOK under increased selling pressure.
In the UK, industrial production for April is coming out. Following the disappointment in the manufacturing and service-sector PMIs, expectations for a broad rebound in the nation’s growth has lessened. The forecast is for the monthly figure to remain unchanged while the annual rate is expected to decelerate. A strong positive surprise in industrial production is needed to keep the scenario for a rebound in Q2 alive and keep the UK on a recovery path.
On Thursday, the highlight of the day will be the RBNZ policy meeting. At their last meeting, the Bank dropped the line about “a period of stability in the OCR” and “future interest rate adjustments, either up or down…” and instead, it said only that “it would be appropriate to lower the OCR if demand weakens, and wage and price-setting outcomes settle at levels lower than is consistent with the inflation target.” In other words, the Bank turned dovish and no longer mentioned the conditions for raising rates, but only for dropping them. The market is not looking for a cut at rates at this meeting, but is discounting at least two more cuts by the end of the year. I would expect the statement to have a dovish tone, which could weaken NZD.
As for the indicators, US retail sales for May are expected to accelerate. Admittedly, April’s retail sales figures were puzzling soft and USD plunged in May after the flat reading. However, a positive surprise could ease market concerns, which have been looking for signs that the soft Q1 is coming to an end.
Finally on Friday, the only noteworthy indicator we get is the preliminary University of Michigan consumer sentiment index for June. The forecast is for the index to tick up a bit from the previous month. The surveys of 1-year and 5-to-10 year inflation expectation outlook are also coming out.
The Market
EUR/USD falls after a strong US jobs report
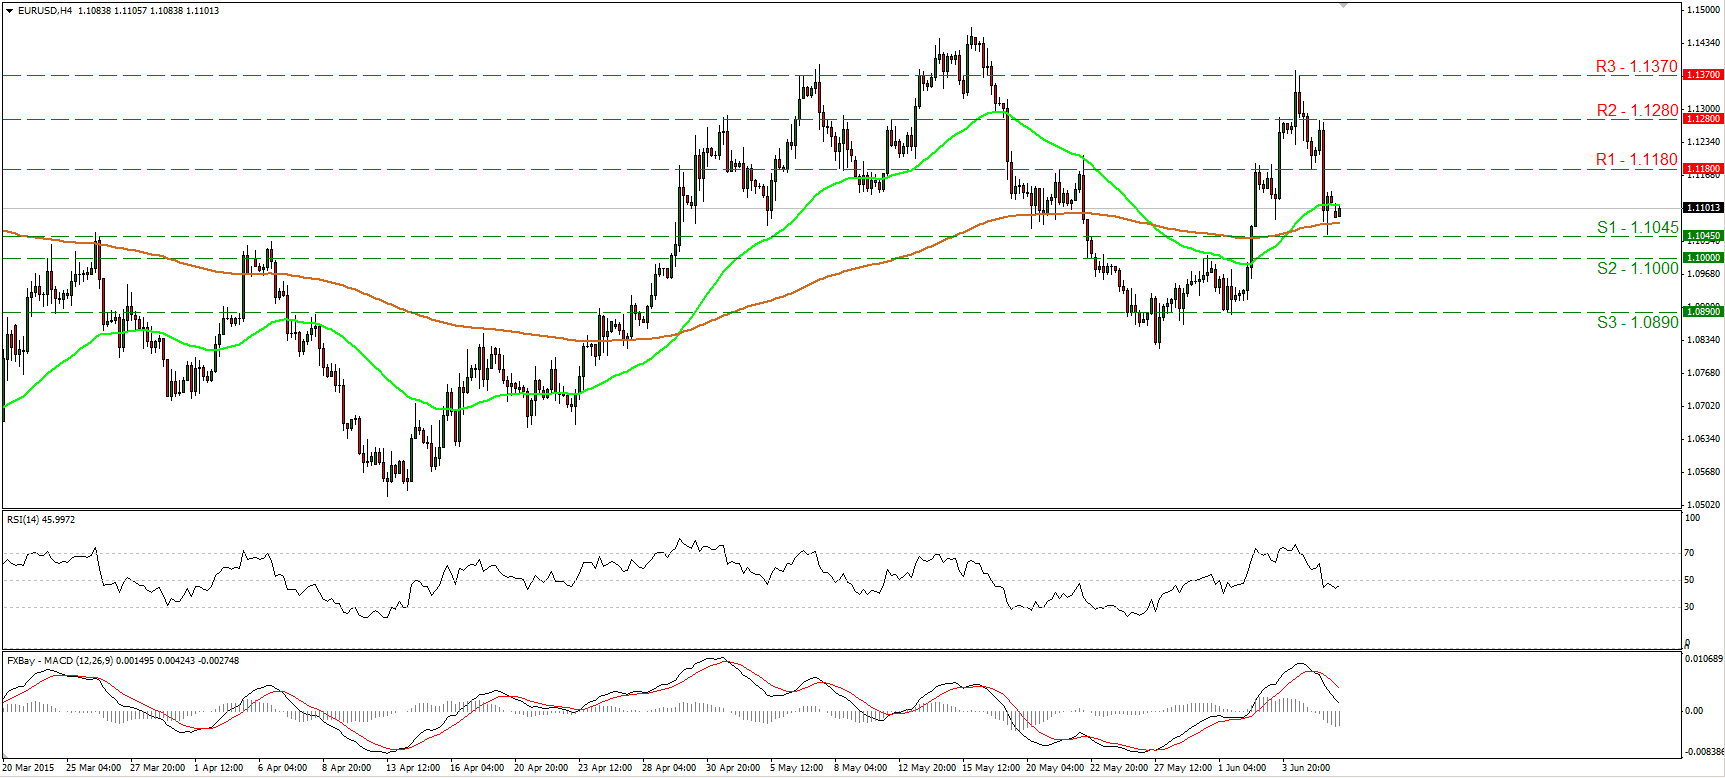
EUR/USD tumbled on Friday after US nonfarm payrolls rose 280k in May, exceeding forecasts of 220k. The rate fell below the support (now turned into resistance) barrier of 1.1180 (R1) and found support at the 1.1045 (S1) hurdle. In my view, the fall does not yet signal a decisive change in sentiment. I believe the move that could carry larger bearish extensions is a clear break below the psychological line of 1.1000 (S2). Something like that is likely to pave the way for our next support area, around 1.0890 (S3). The oscillators on the 4-hour chart confirm Friday’s negative momentum. The RSI fell below its 50 line, while the MACD has topped and fallen below its trigger line. On the 1-hour chart however, the hourly oscillators give evidence that a bounce could be looming before the bears shoot again. The 14-hour RSI exited its oversold territory, while the hourly MACD has bottomed and crossed above its trigger line. On the daily chart, I see a possible evening star candle formation, which increases the possibilities for further declines in the not-too-distant future.
• Support: 1.1045 (S1), 1.1000 (S2), 1.0890 (S3).
• Resistance: 1.1180 (R1), 1.1280 (R2), 1.1370 (R3).
GBP/USD hits support around 1.5185
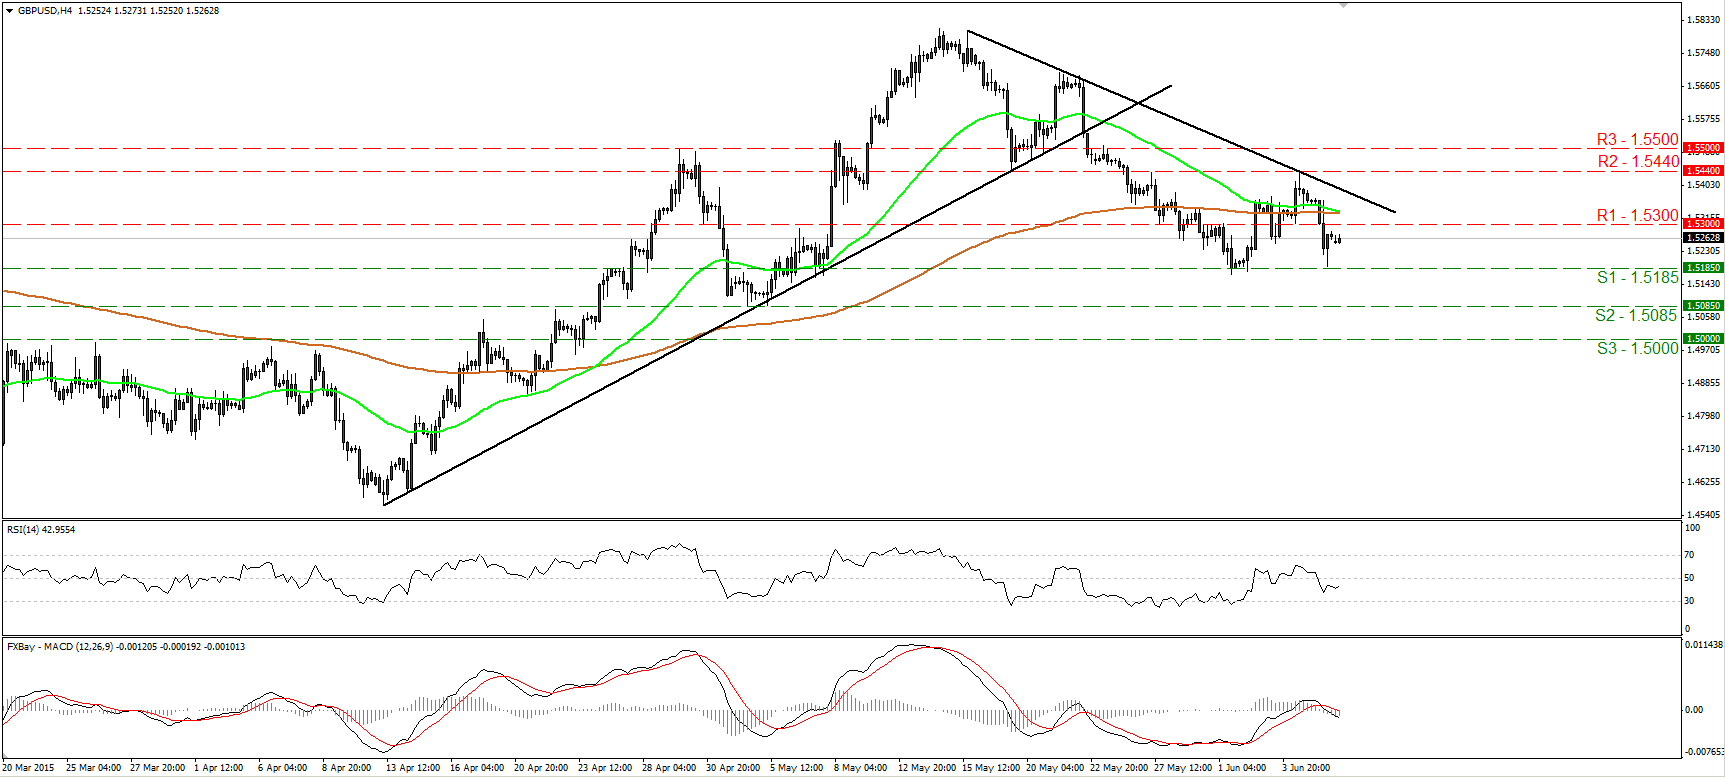
GBP/USD tumbled on Friday after the strong US employment data, but the decline was halted by the 1.5185 (S1) support field. As long as the rate is trading below the uptrend line taken from back at the low of the 13th of April, and below the downtrend line drawn from the peak of the 15th of May, the short-term outlook stays bearish in my view. A decisive break below 1.5185 (S1) is likely to pull the trigger for our next obstacle, at 1.5085 (S2). Our short-term oscillators reveal negative momentum. The RSI stands below its 50 line, while the MACD lies below both its zero and signal lines. Switching to the daily chart, the rate is now trading marginally below the 80-day exponential moving average, increasing the odds that the rate could trade lower in the not-too-distant future.
• Support: 1.5185 (S1) 1.5085 (S2), 1.5000 (S3).
• Resistance: 1.5300 (R1), 1.5440 (R2), 1.5500 (R3).
USD/JPY hits 125.85
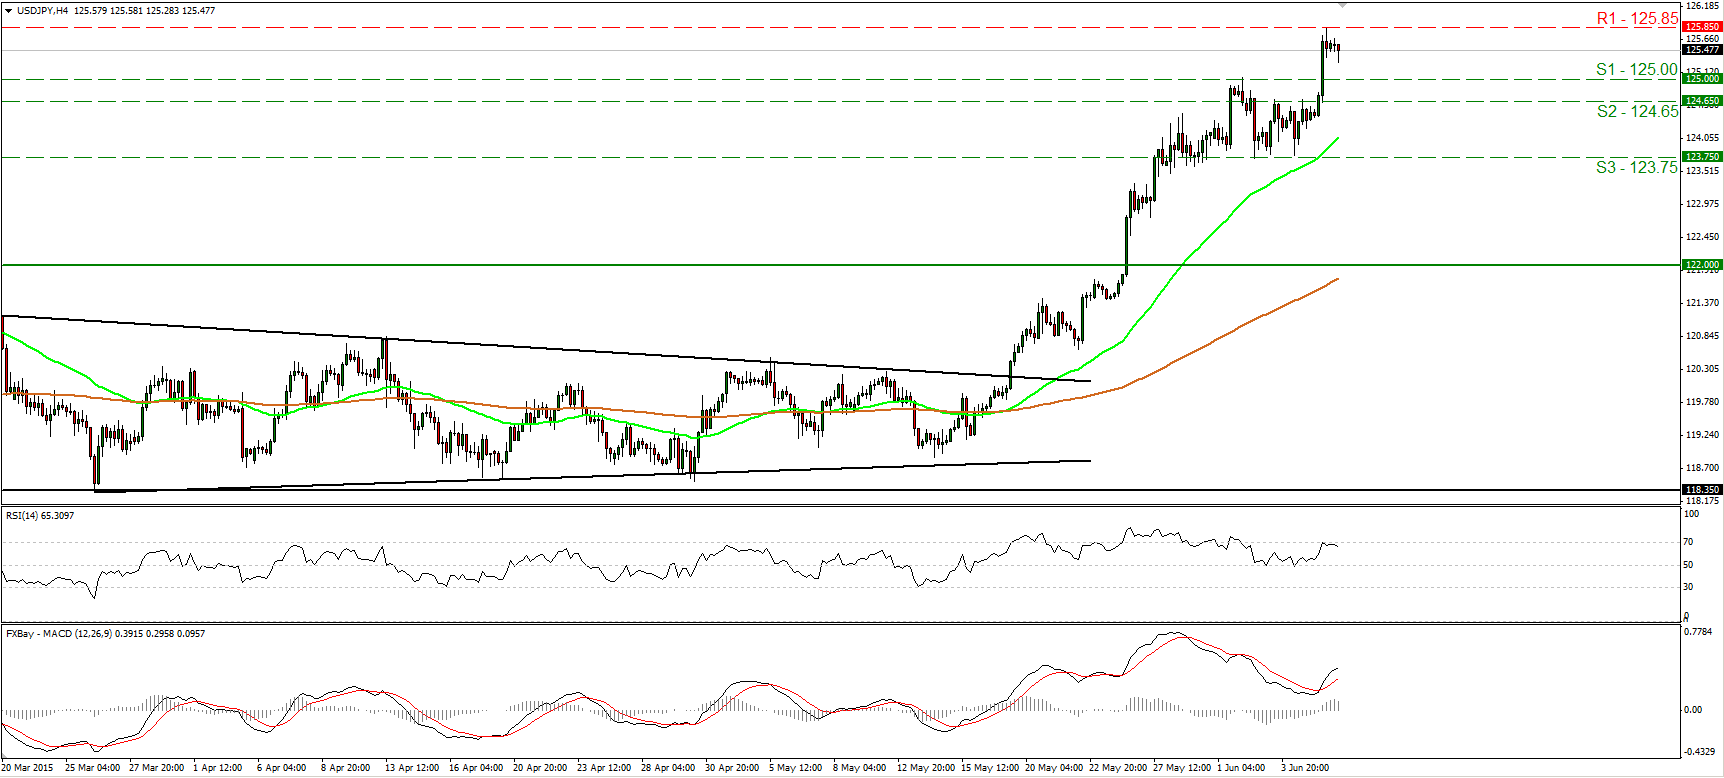
USD/JPY soared on Friday and hit resistance at 125.85 (R1), a resistance zone defined by the peak of the 5th of December 2002. The short-term picture remains positive in my view, and therefore I would expect a clear break above 125.85 (R1) to set the stage for extensions towards our next hurdle, at 126.75 (R2), marked by the inside swing lows of the 3rd and 7th of March 2002. Nevertheless, having in mind that the RSI hits resistance at its 70 line and turned down, I would be careful of a possible pullback before the bulls prevail again. On the daily chart, the break above the 122.00 zone confirmed a forthcoming higher high and triggered the continuation of the long-term upside path.
• Support: 125.00 (S1), 124.65 (S2), 123.75 (S3).
• Resistance: 125.85 (R1), 126.75 (R2), 128.40 (R3).
Gold rebounds from 1162
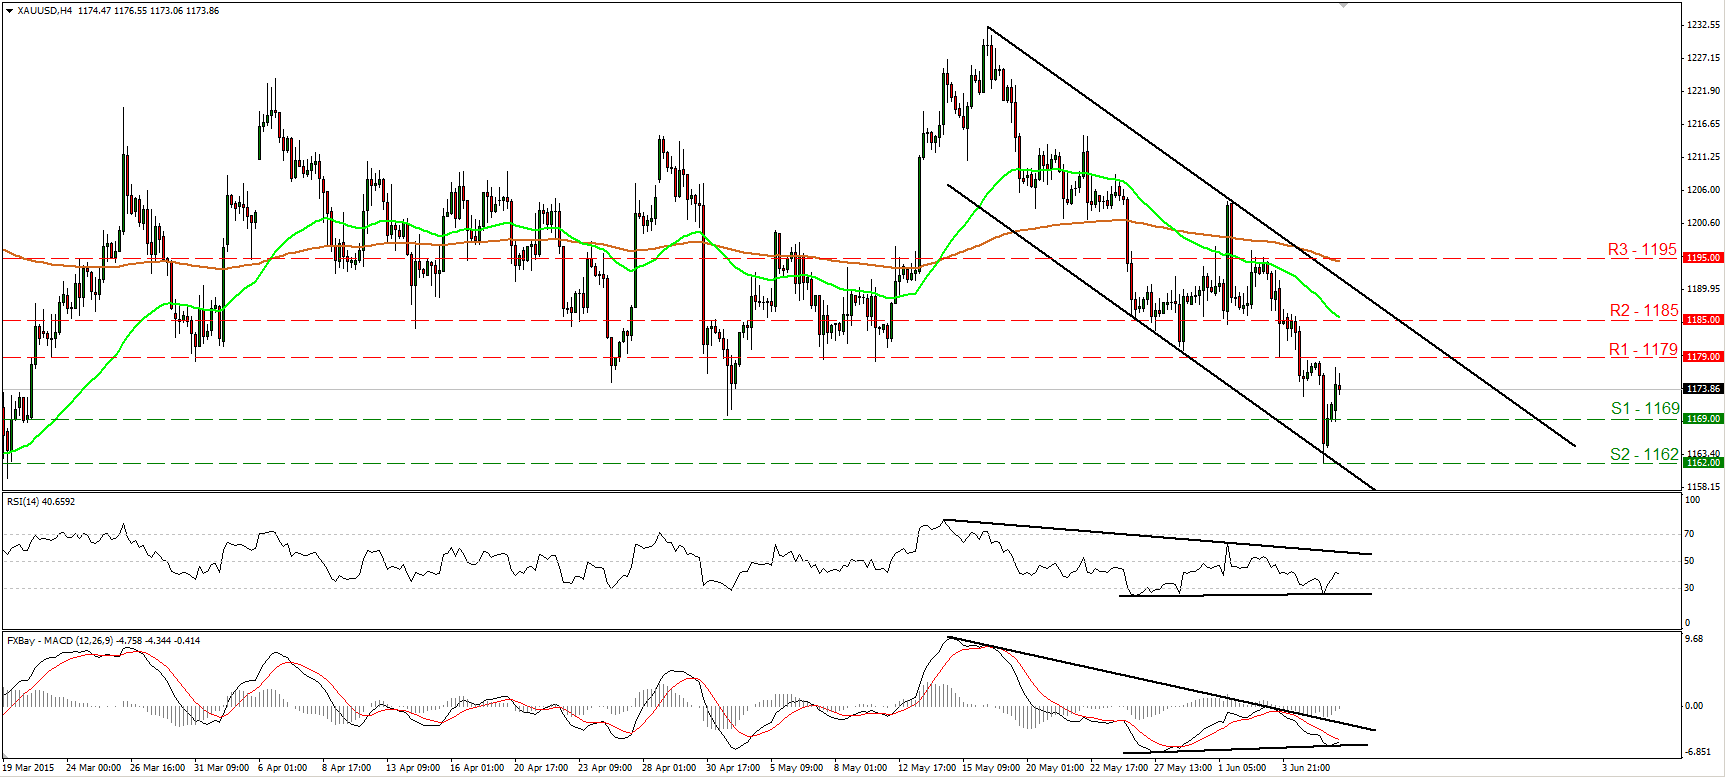
Gold fell on Friday, but hit some buy orders at 1162 (S2) and rebounded to trade virtually unchanged. During the early European morning Monday, the metal is trading slightly below the resistance barrier of 1179 (R1), and although the short-term picture is negative, I see signs that the rebound may continue. The RSI exited its oversold territory, while the MACD has bottomed and could move above its trigger line soon. There is also positive divergence between both the indicators and the price action. If the bulls manage to drive the battle above 1179 (R1), I would expect them to target our next resistance at 1185 (R2). On the daily chart, the move below 1169 (S1) gives a first sign that the overall outlook has probably turned negative. This is also supported by our daily oscillators. The 14-day RSI stands below its 50 line, while the daily MACD lies below both its signal and zero lines.
• Support: 1169 (S1), 1162 (S2), 1153 (S3).
• Resistance: 1179 (R1), 1185 (R2), 1195 (R3).
WTI hits resistance at 59.20
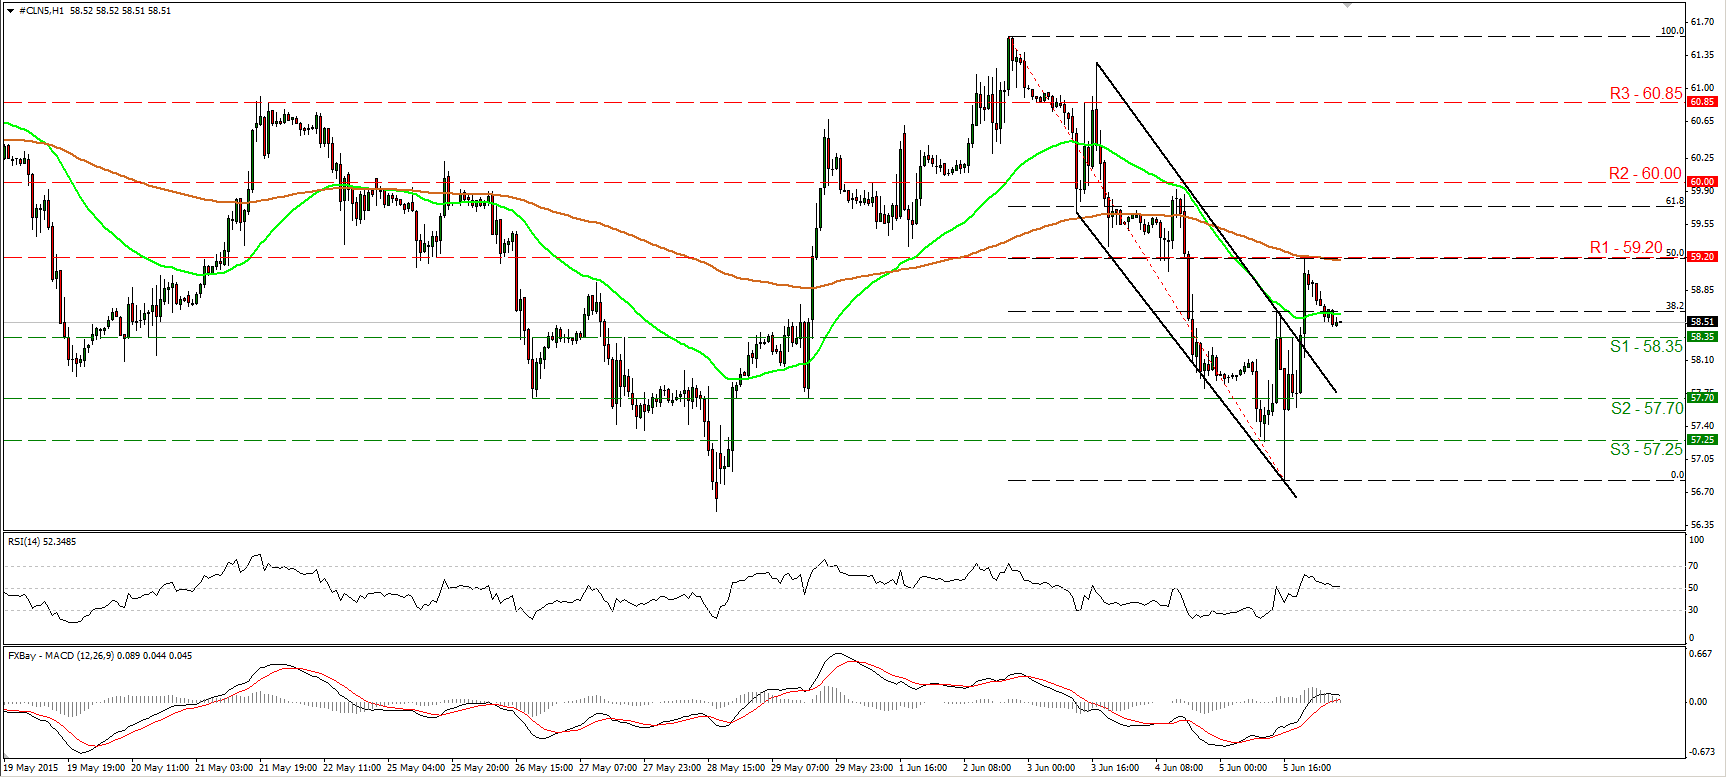
WTI rallied on Friday, but hit resistance at the 59.20 (R1) line, which happens to be the 50% retracement level of the 2nd – 5th of June decline, and currently coincides with the 200-hour moving average. Subsequently, WTI retreated. A break above 59.20 (R1) is now needed to trigger additional bullish extensions, perhaps towards the round number of 60.00 (R2). Our hourly momentum studies however give evidence that further pullback could be on the cards. The 14-hour RSI slide towards its 50 line and could cross below it soon, while the hourly MACD, although positive, has topped and could fall below its trigger. As for the broader trend, the break above 55.00 on the 14th of April signalled the completion of a double bottom formation, something that could carry larger bullish implications in the not-too-distant future. Therefore, I would treat any declines that stay limited above 55.00 as a corrective phase for now.
• Support: 58.35 (S1), 57.70 (S2), 57.25 (S3).
• Resistance: 59.20 (R1) 60.00 (R2), 60.85 (R3) .

