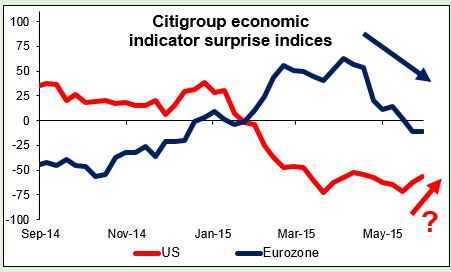
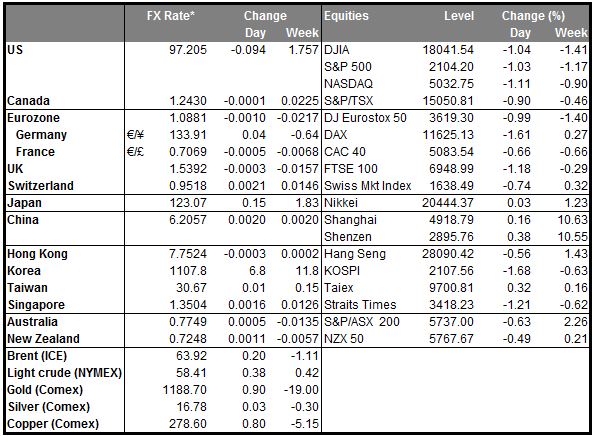
Good US data lifts USD without lifting rate expectations A string of largely better-than-expected data yesterday lifted the USD against every currency that we track, including all 15 EM ones – a rare event – even though Fed funds rate expectations ended the day lower. US durable goods ex-transportation beat estimates, as did the capital goods orders (excluding defense and aircraft orders), a leading indicator of business investment. New home sales surged and house price gains beat expectations. Consumer confidence rose. The Markit (NASDAQ:MRKT) service sector PMI was slightly lower, but in line with expectations. The big disappointment was the Dallas Fed manufacturing activity index, but that’s a function of the problems in the oil industry, and not representative of the economy as a whole. Overall, the hoped-for improvement in US economic indicators is starting to come through, and the US economic indicator surprise index is turning up. It looks like the Fed’s analysis of the US economy is turning out to be correct! Apparently, private sector economists are starting to revise up their estimates for US Q2 GDP.
Nonetheless, Fed funds rate expectations for Dec 2017 fell by 4 bps yesterday, as US Treasury yields fell through the recent lows as global markets generally traded in a risk-off mode. Most European stock markets fell, and the S&P 500 was down 1% -- perhaps Greek worries?
Oil falls sharply Oil prices fell sharply, with the strong dollar blamed for the move. The market is also hitting an inflection point: prices were rising on the idea that US shale producers would cut back on their output, but now prices have risen to the point that shale production becomes profitable again and the fall in the rig count has largely stopped. The lower oil prices are likely to hurt sentiment for the commodity currencies, which indeed were the main losers over the last 24 hours. Speaking of commodity currencies, the US Department of Agriculture’s Beijing bureau doubled its estimate of the size of Chinese whole milk powder inventories. That means less need to import milk powder for the rest of the year, which is negative for NZD.
Juncker confirms first week of June is deadline for Greece EC President Juncker said that there is an increasing sentiment among his colleagues that a default by Greece or its exit from the Eurozone must be avoided, and that he will do everything in his power to reach a deal by the first week of June, which he said is the "obvious" deadline. But he added that everyone he’s spoken to insists that the IMF must be involved. This means his reported plan for an initial “mini-deal" without the IMF is not likely, and that a full agreement is required. Given Greece’s objections to the IMF’s involvement, such an agreement may be difficult to achieve.
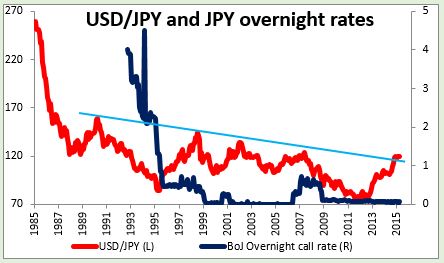
Bank of Japan minutes show Board members still confident of hitting their target The Bank of Japan released the minutes of its April 30 meeting. These are not the minutes from the most recent meeting, but rather from the previous one, where they downgraded their inflation forecasts and said that they expect to reach the 2% inflation target in 1H FY2016 (April-September 2016), rather than during the current FY2015. This was only bowing to reality, given that inflation is currently zero. Members seem content with things the way they are; “many members” viewed QQE as exerting its intended effects and “many members” thought inflation was likely to reach the 2% target around 1H FY2016. Personally, I can’t understand why they think this. Overnight interest rates in Japan have been below 0.5% since 1995 and around zero since April 1999, with the exception of maybe two years around 0.5% in the mid-2000s, and inflation is still zero. I don’t know why they think anything will change now. Given the general satisfaction on the board, they are likely to wait at least until July, when the results of this year’s wage negotiation should be known and the MPC members update their forecasts again, before taking further easing measures. October, when the next formal revision of the forecast is due, seems more likely. Meanwhile, USD/JPY broke through a 30-year trend line on the upside – is this the start of a new leg up? It was noticeable that JPY was one of the weakest currencies overnight despite the risk-off atmosphere, which usually would cause the yen to strengthen.
Today’s highlights: During the European day, the only noteworthy indicators we get are the German GfK consumer confidence for June and French consumer confidence for May.
The Queen’s Speech in Britain will lay out the agenda for the new Conservative government in this session of Parliament. The plans are likely to follow closely the pledges made in the party’s election manifesto and so should not surprise the market.
From Sweden, we get the economic tendency survey for May. The forecast is for the indicator to increase a bit, which could strengthen SEK somewhat.
The main event will be the Bank of Canada rate decision. The market expects the Bank to remain on hold, so the impact on CAD will depend on the tone of the statement. BoC Governor Poloz may reiterate his optimistic tone seen in a recent speech on the economy’s prospects. Coming on top of the firm oil price in recent weeks, a positive statement could strengthen CAD somewhat.
As for the speakers, Richmond Fed President Jeffrey Lacker speaks. Wednesday is also the first of a three day meeting of the G7 Finance Ministers and Central Bankers in Germany. The officials are expected to discuss global finance, regulation, growth and trade. There could be some confrontation between US Treasury Secretary Lew, who wants countries to boost economic growth, and German Finance Minister Schaeuble, who insists that Germany has no room to expand spending.
The Market
EUR/USD reaches 1.0865
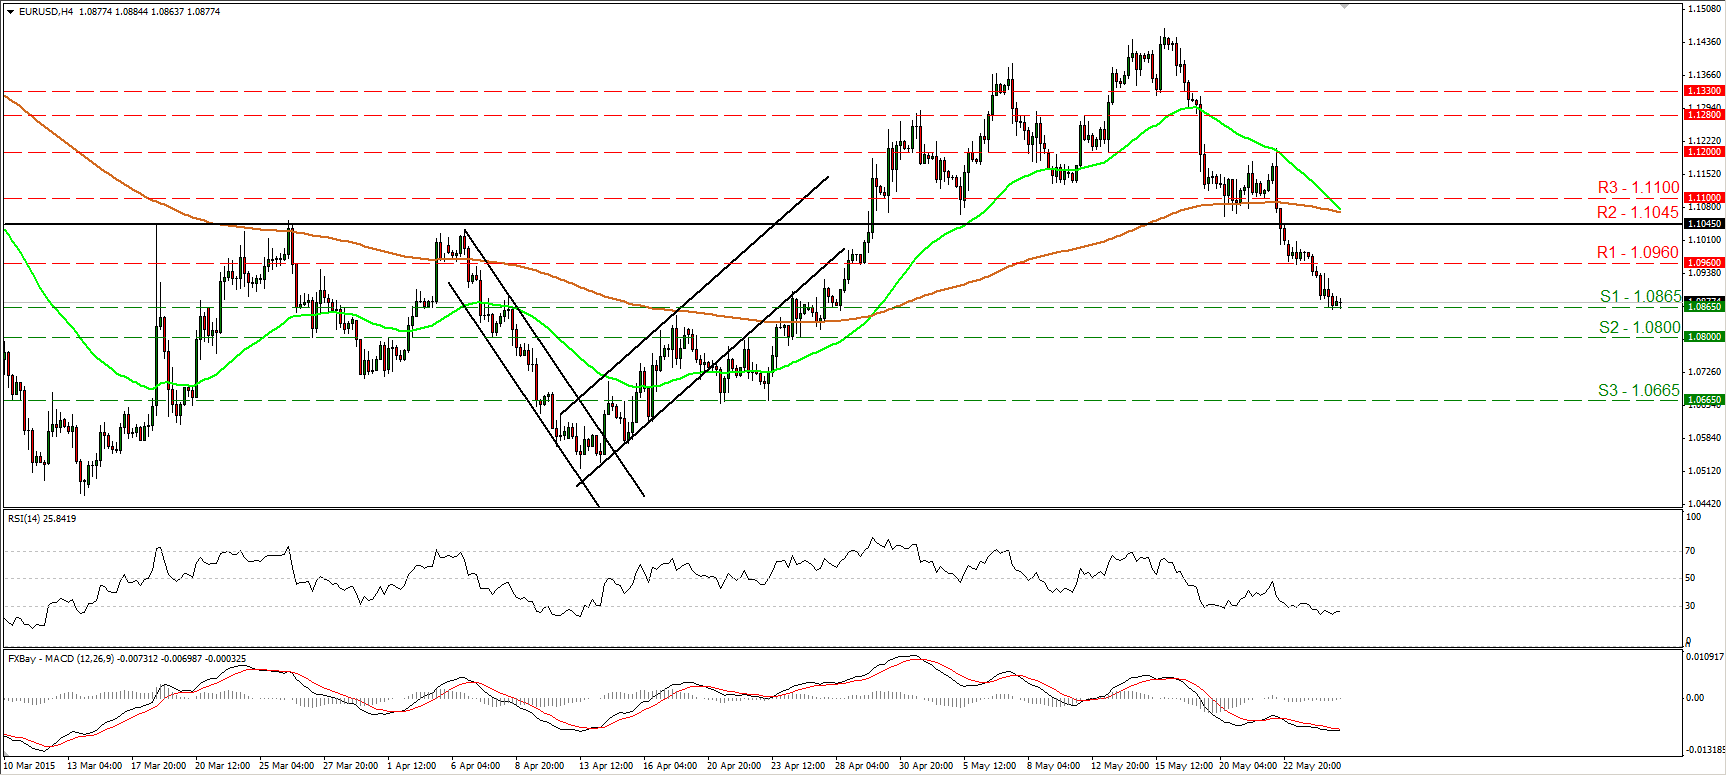
EUR/USD continued its tumble on Tuesday and managed to reach our support territory of 1.0865 (S1). The short-term outlook remains negative in my view, and as a result, I would expect a break below that obstacle to drive the battle towards the next one at 1.0800 (S2). However, taking a look at our short-term oscillators, I would be careful that a corrective bounce could be in the works before the next negative leg. The RSI has bottomed within its below-30 territory and could exit that field soon, while the MACD, although negative, shows signs of bottoming as well. On the daily chart, the move below the 1.1045 (R2) barrier increases the likelihood that the 13th of April – 15th of May recovery was just a corrective move and that the prior downtrend could now be resuming.
• Support: 1.0865 (S1), 1.0800 (S2), 1.0665 (S3).
• Resistance: 1.0960 (R1), 1.1045 (R2), 1.1100 (R3).
GBP/JPY ready to challenge the 189.80 barrier again
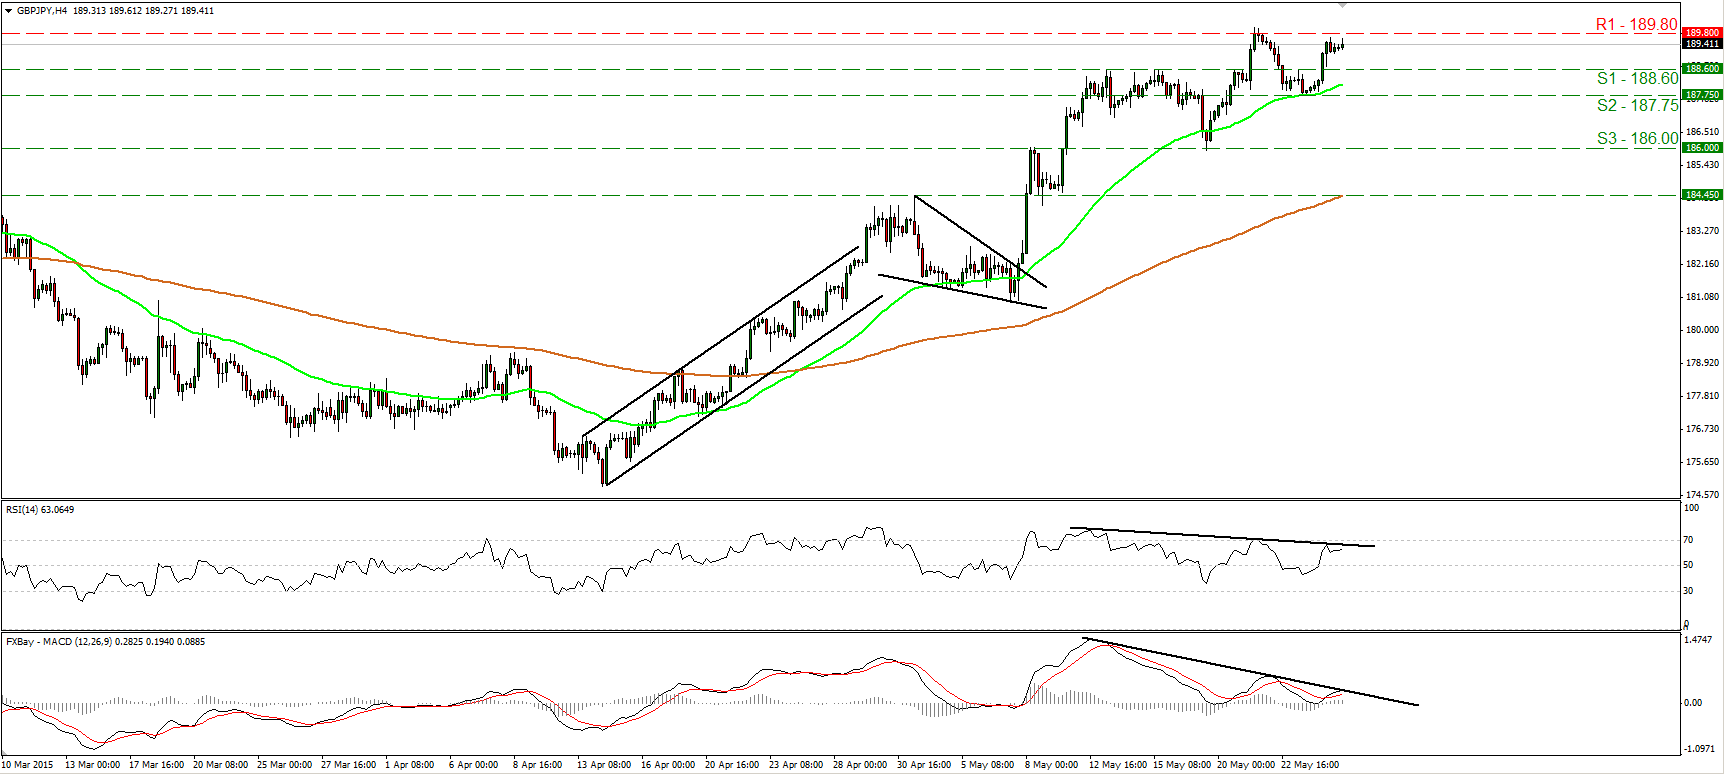
GBP/JPY traded higher after hitting support at 187.75 (S2), and today during the European morning, looks ready to challenge again the 189.80 (R1) barrier, defined by the peak of the 21st of May and by the highs of the 5th and 8th of December. The short-term picture remains positive in my view, and as a result, I would expect a decisive break above 189.80 (R1) to open the way for our next resistance territory of 192.80 (R2). However, there is negative divergence between our oscillators and the price action, indicating that a corrective move could be in the cards before the bulls shoot again. On the daily chart, the rate is trading well above both the 50- and the 200-day moving averages, and this supports the continuation of the short-term uptrend. However, our daily momentum indicators give evidence of a possible correction as well. The 14-day RSI looks ready to exit its above-30 territory, while the MACD has topped and could fall below its trigger soon.
• Support: 188.60 (S1), 187.75 (S2), 186.00 (S3).
• Resistance: 189.80 (R1), 192.80 (R2), 195.00 (R3).
NZD/USD finds support slightly above 0.7200
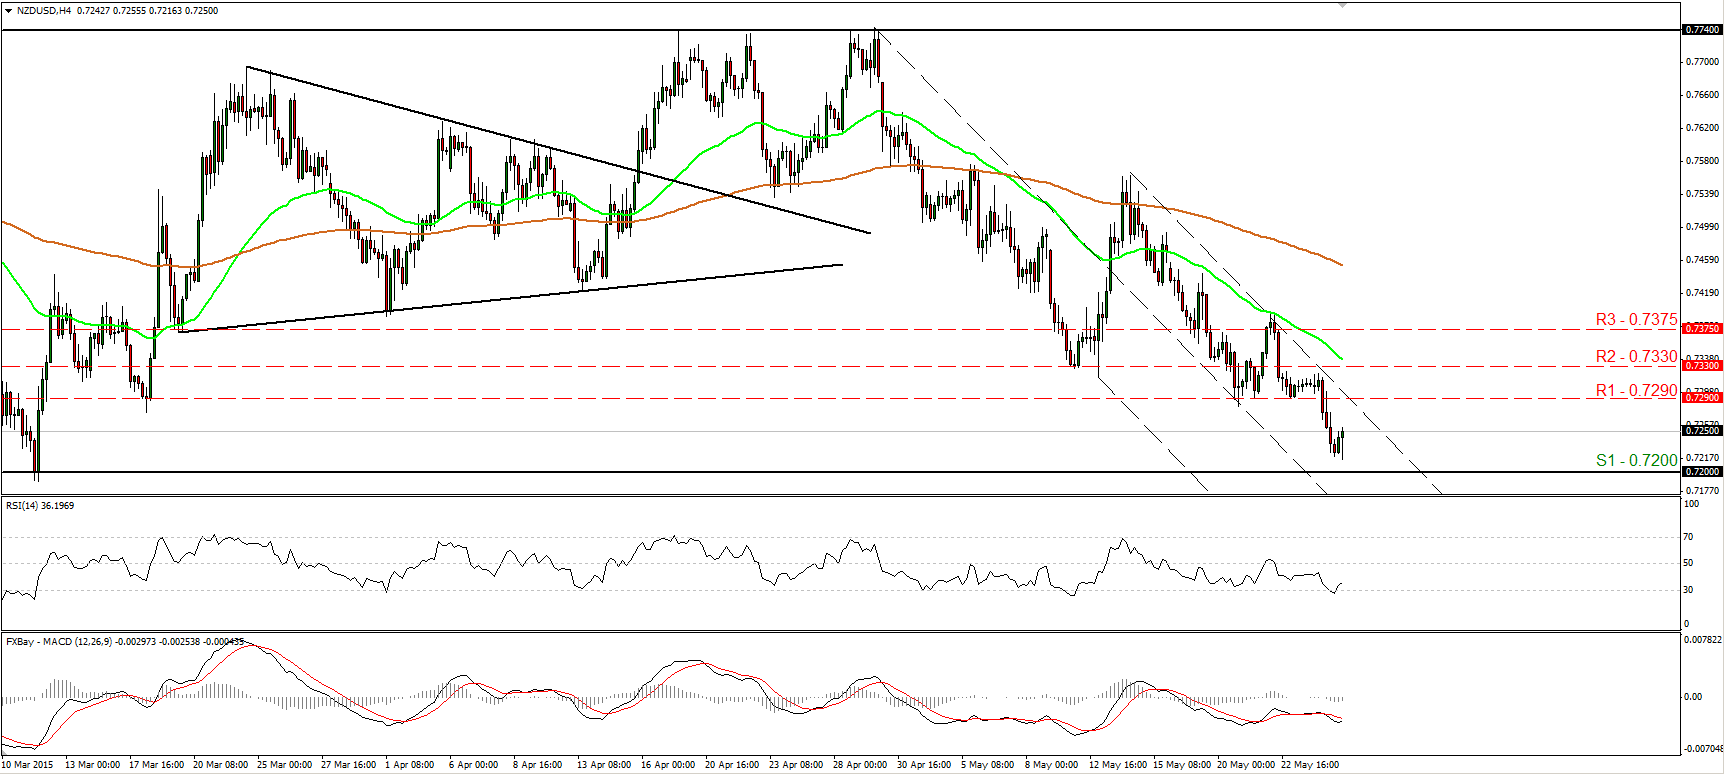
NZD/USD tumbled yesterday, falling below the support (now turned into resistance) hurdle of 0.7290 (R1). However, the decline was halted slightly above our critical support zone of 0.7200 (S1). Bearing in mind our proximity to that strong support zone, I would switch my stance from negative to neutral, as a strong rebound near 0.7200 (S1) could be looming. Our short-term oscillators support my choice to take the sidelines for now. The RSI rebounded from its 30 line and points up, while the MACD, although negative, shows signs of bottoming. On the daily chart, I see a trendless path between the key support of 0.7200 (S1) and the resistance territory of 0.7740. Therefore, I would stay neutral as far as the broader trend is concerned as well. I would like to see a clear close below the 0.7200 area before I start discussing the resumption of the prior longer-term downtrend.
• Support: 0.7200 (S1), 0.7120 (S2), 0.7000 (S3).
• Resistance: 0.7290 (R1), 0.7330 (R2), 0.7375 (R3).
Gold collapses back below 1200
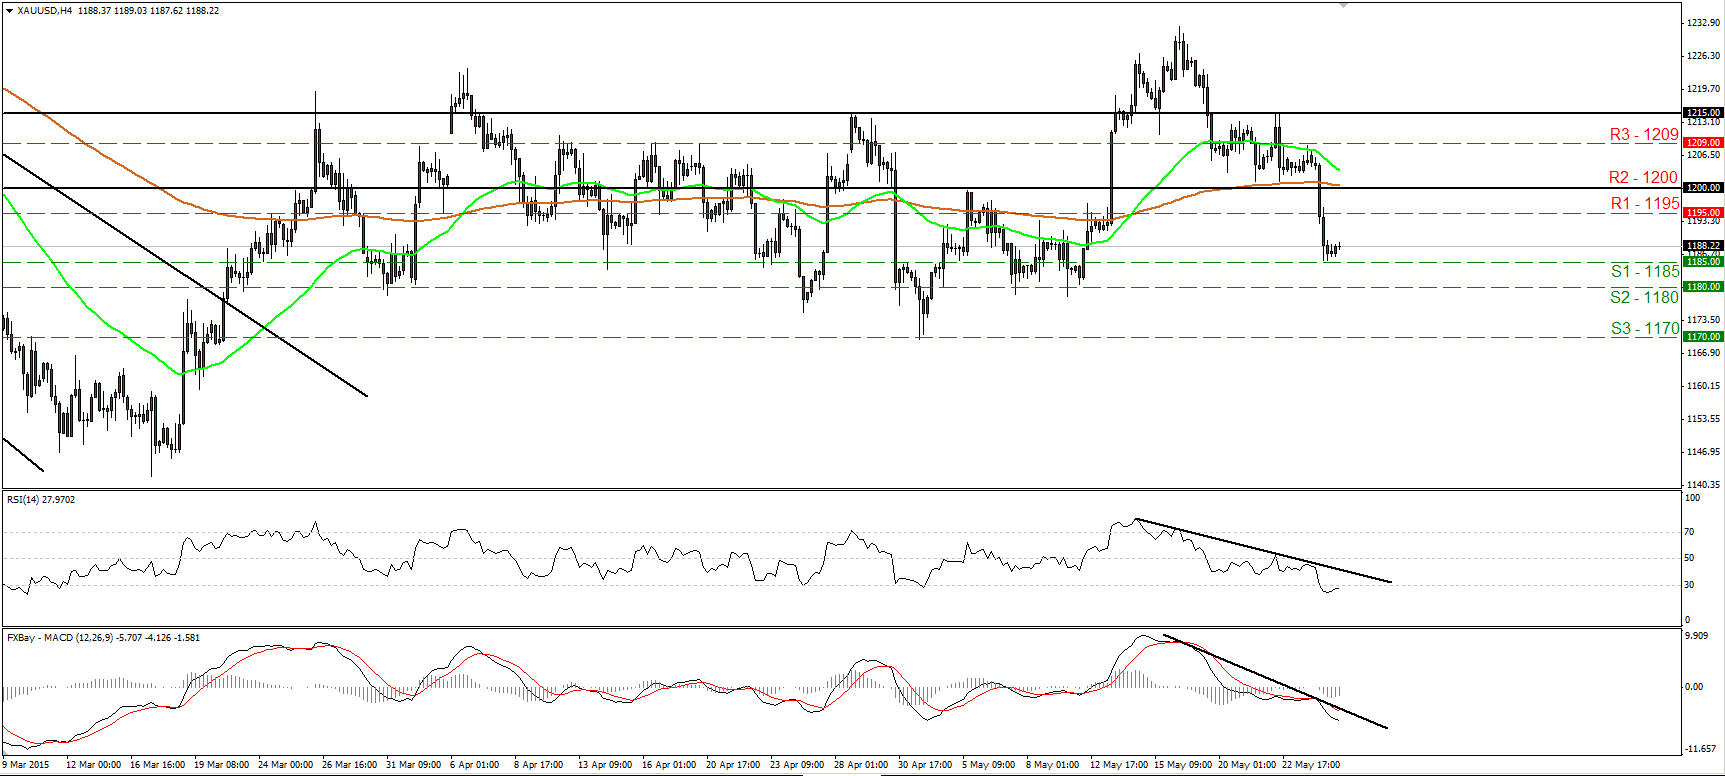
Gold fell sharply yesterday, breaking back below the psychological barrier of 1200 (R2), and finding support at around 1185 (S1). The break below the key barrier of 1200 (R2) turned the picture negative in my view. I would expect the metal to challenge the 1180 (S2) hurdle soon, but I would be careful of a possible upside corrective wave before the bears prevail again. The reason is because the RSI bottomed within its oversold territory and move above 30 soon. On the daily chart, gold has been trading in a non-trending structure since the last days of March. Therefore, although I see a negative near-term picture, I would hold my neutral stance as far as the overall picture is concerned.
• Support: 1185 (S1), 1180 (S2), 1170 (S3).
• Resistance: 1195 (R1), 1200 (R2), 1209 (R3).
DAX pulls back
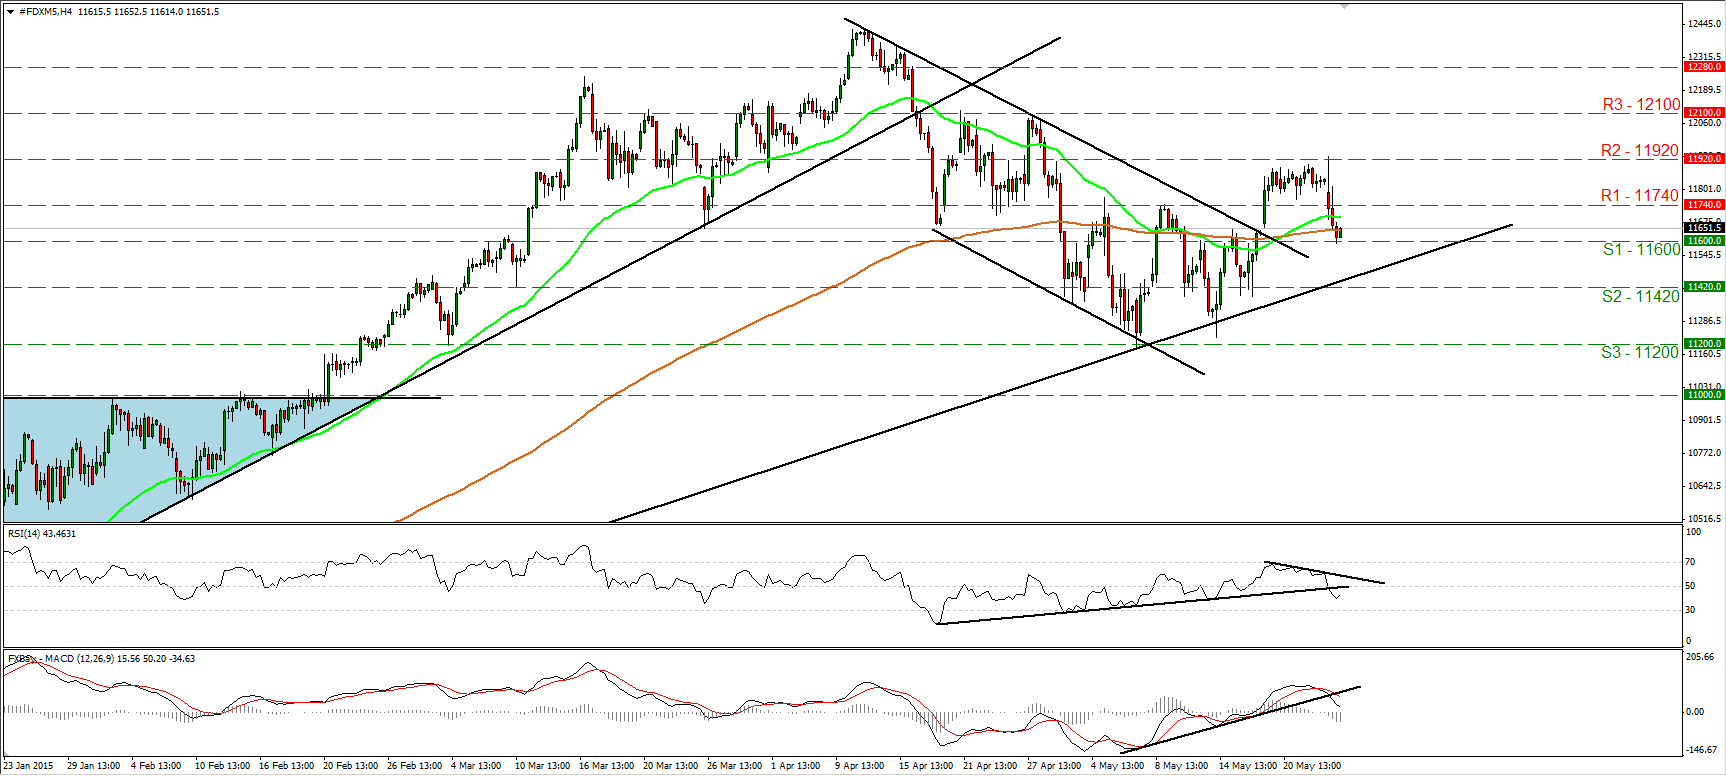
DAX futures slid on Tuesday, breaking back below the 11740 (R1) area and finding support at 11600 (S1). However, since the possibility for a higher low still exist, I would keep the view that the short-term outlook is cautiously positive. A break above the 11920 (R2) barrier is the move that could restore the short-term positive picture, which could prompt extensions towards our next hurdle of 12100 (R3). On the daily chart, the index rebounded from the long-term uptrend line taken from back at the low of the 16th of October. This keeps the longer-term path to the upside in my view. Therefore, I believe that any short-term downside extensions are likely to provide renewed buying opportunities.
• Support: 11740 (S1), 11420 (S2), 11200 (S3).
• Resistance: 11920 (R1) 12100 (R2), 12280 (R3).

