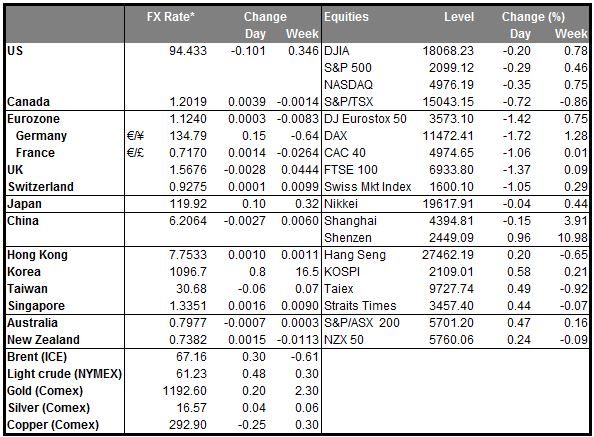
• Chaos in the bond market Bond yields gyrated around the world yesterday after NY Fed President Dudley’s speech, which talked about a “regime shift” in monetary policy. In a speech, “The Global Implications of Diverging Monetary Policy Settings in Advanced Economies,” he said,
“…I think it would be naïve not to expect some impact [from the Fed’s first rate hike]. After more than six years at the zero lower bound, lift-off will signal a regime shift even though policy would only be slightly less accommodative after lift-off than it is before. I expect that this will have implications for global capital flows, foreign exchange valuation and financial asset prices even if it is mostly anticipated when it occurs.”
The point is that even 0.25 is infinitely larger (as a percent) than zero, so what looks like a small increase is actually a huge change: something vs nothing. Meanwhile, San Francisco Fed President Williams added to the chaos when he said that a “gradual increase” in the Fed funds rate over time would be the safe way to raise rates and therefore “that calls for starting a bit earlier,” even as soon as the June meeting. The comments caused chaos in the bond markets, with US 10-Year yields soaring from 2.27% to 2.36% and then back down all the way to 2.24%. But after all that, the 10-year yield finished the day down around 3 bps, while Fed funds futures were largely unchanged and stocks regained much (but not all) of their early losses. While the speech affected yields all around the world, ultimately US policy is likely to affect US bond yields the most and therefore should be bullish for USD. Dudley’s speech can be found here.
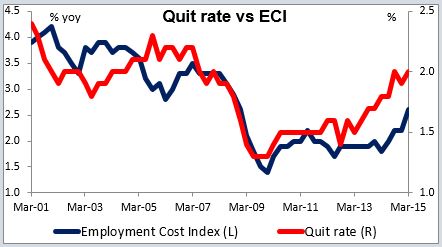
• JOLTS data supports US rate hike In fact I was surprised that the dollar was so weak after the supportive US Job Opening and Labor Turnover Survey (JOLTS) report. Job openings were down slightly, but still were the third-highest ever in the series (starting Dec. 2000). Meanwhile, the hiring rate continued at a relatively high 3.6% and the quit rate rose 10 bps to 2.0%. Fed Chair Yellen frequently refers to the JOLTS data as a good indicator of the level of slack in the labor market. The quits rate – the percent of the workforce that voluntarily quit their job each month -- is a particularly effective leading indicator of labor market conditions, because people usually don’t quit their job unless they either have another one lined up or feel confident they can get one. The quits rate is now up to 2%, which as the graph shows, implies a continued rise in the employment cost index (ECI), which rose to 2.6% yoy in March. The ECI is the Fed’s favorite measure of wage inflation. If it continues to rise this year, as the JOLTS data suggests, then it should average 2.6% over the year to September. The Fed hiked rates in 2004 with the ECI averaging around that level.
• ECB continues aid to Greece: The ECB held its weekly non-monetary meeting yesterday and apparently agreed to raise the amount of Emergency Lending Assistance (ELA) funds to Greek banks by EUR 1.1bn while keeping the haircut on collateral unchanged. Apparently, they are either being rewarded for the small progress being made, or at least the ECB is not yet penalizing them. On the other hand, the Greek government did not win the increase in T-bill issuance that it had hoped for, so the overall implication was probably neutral. In any event, sudden death is delayed for another week at least, but this is not yet the end of the story by any means.
• China data disappoints (again): China released its retail sales, industrial production and fixed assets investment data for April. The yoy rate of growth in retail sales was down slightly from March, although industrial production was slightly higher (although below estimates). The big change was that fixed asset investment fell sharply. This is exactly what the government is aiming for; they want to change the country’s growth model from investment-driven to consumption-driven. However the change inevitably means a slowdown in growth, as we are seeing. The news should be negative for AUD today.
• Today’s highlights: The main data was out early today: the preliminary Q1 GDP figures for France, Germany and the eurozone as a whole. France’s GDP was better than expected, but Germany’s was notably lower. The market focused on that and EUR/USD fell slightly. The preliminary figure for the eurozone as a whole is due out later today. German final CPI and French CPI for April are also coming out.
• In the UK, the main event will be the Bank of England quarterly inflation report. BoE Gov. Mark Carney will present the quarterly inflation report with the economic assessment along with updates of the Bank’s GDP and inflation forecasts. If Gov. Carney repeats that inflation will reach 2% in the two-year forecast and the next move in rates will most likely be an increase, investors could bring forward their rate hike expectations and GBP could strengthen somewhat.
• As for the indicators, the UK unemployment rate for March is forecast to have declined to 5.5% from 5.6% in the month before, while average weekly earnings are expected to have risen at the same annual pace as previously (+1.7% yoy). This, accompanied by a decline in the unemployment rate and a hawkish tone in the inflation report could support the pound.
• In the US, retail sales for April are due out. Headline retail sales are forecast to have risen +0.2% mom in April, a slowdown from +0.9% mom in March. The core rate (excluding the volatile items of auto and gasoline) is expected to accelerate to +0.6% mom from +0.5% mom. A positive figure would support the theory that the weakness in Q1 was mainly due to the harsh weather, and could add to the USD strength
The Market
EUR/USD rebounds from 1.1130
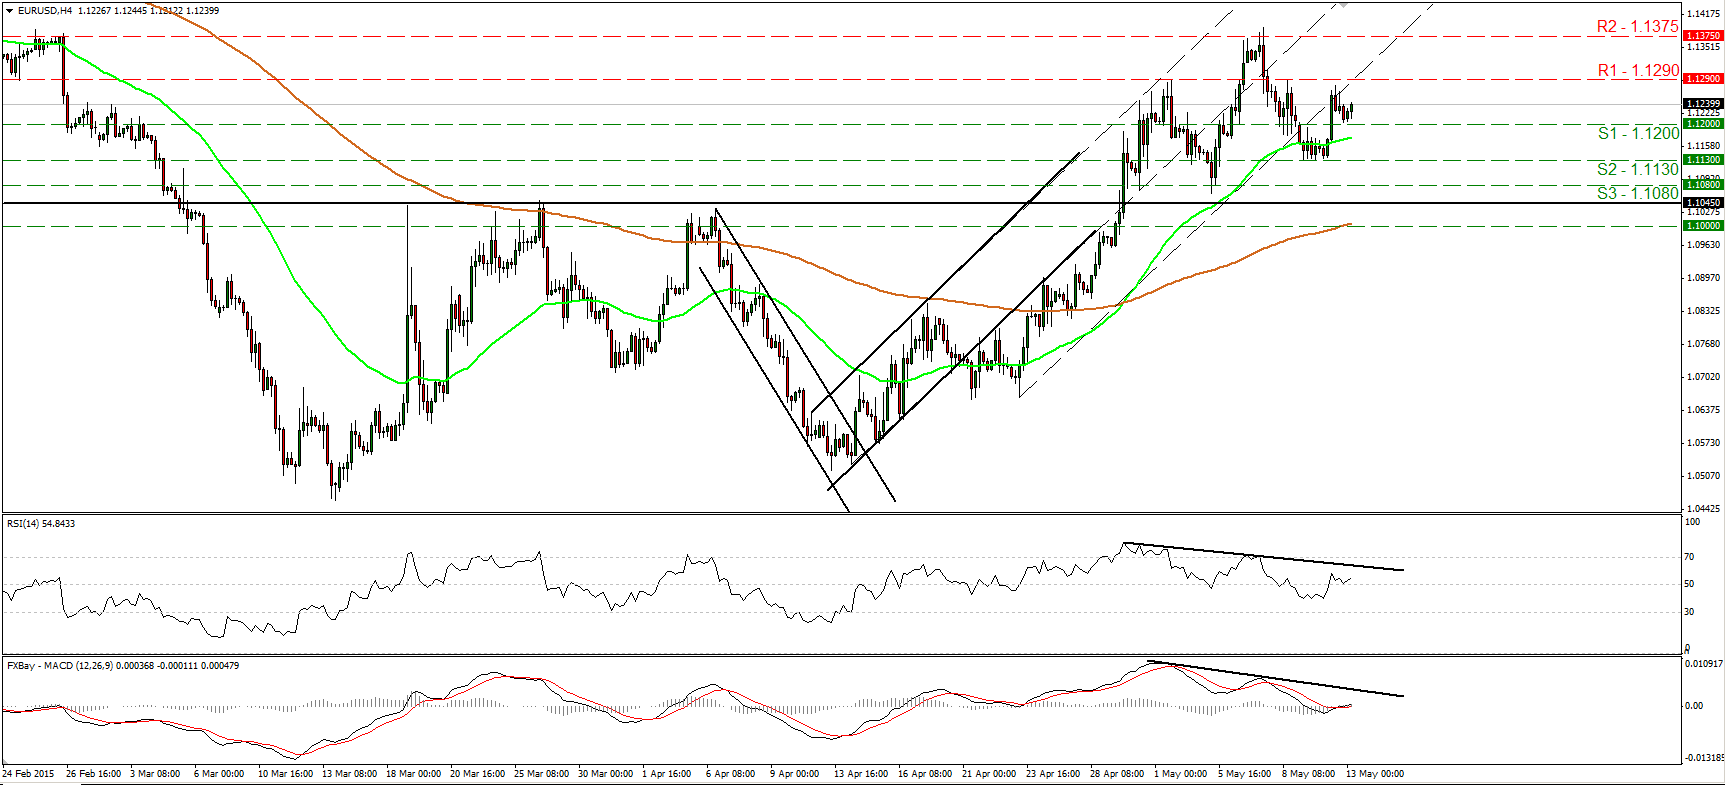
• EUR/USD traded higher on Tuesday, after hitting support at 1.1130 (S2). However, the rally remained limited below our resistance line of 1.1290 (R1). The rebound confirmed a forthcoming higher low on the 4-hour chart, but given that there is still positive divergence between our short-term oscillators and the price action, I would prefer to stay on hold for now. A clear move above 1.1290 (R1) is needed to trigger further upside extensions, perhaps for another test at the 1.1375 (R2) territory. . As for the broader trend, the break above 1.1045 signaled the completion of a possible double bottom formation, something that could carry larger bullish implications. As a result, I would treat any declines that stay limited above the 1.1045 barrier as a corrective move before buyers seize control again.
• Support: 1.1260 (S1), 1.1130 (S2), 1.1080 (S3)
• Resistance: 1.1290 (R1), 1.1375 (R2), 1.1445 (R3)
GBP/JPY continues its rally
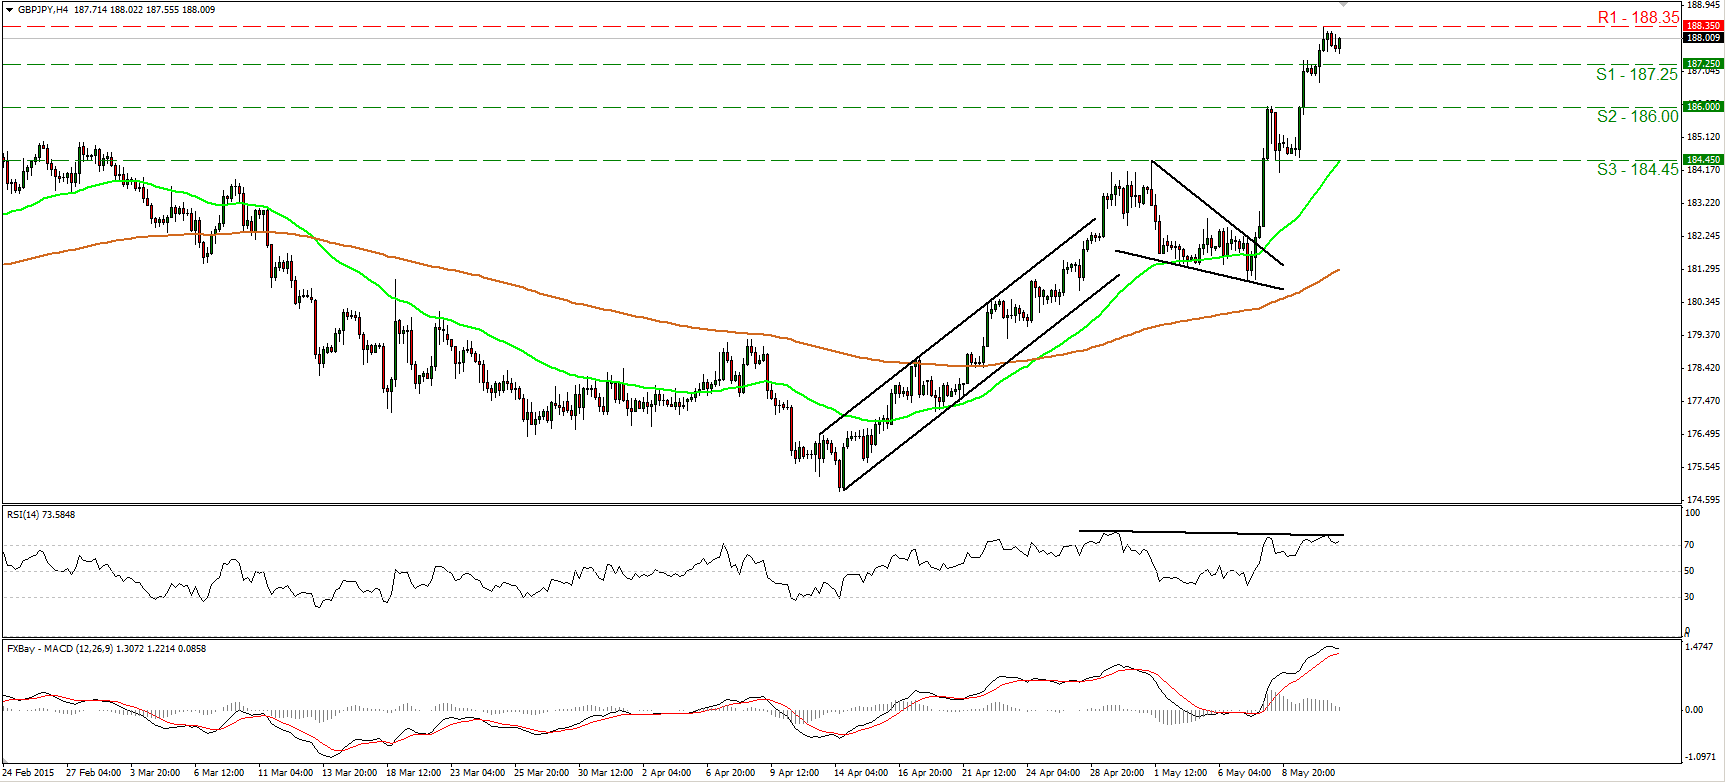
• GBP/JPY continued to trade higher, breaking above the resistance (turned into support) barrier of 187.25 (S1) and reaching the 188.35 (R1) line. The short-term trend remains positive and as a result I would expect a clear break above 188.35 (R1) to open the way for the next obstacle of 189.20 (R2), defined by the peak of the 9th of December. However, our short-term oscillators give evidence that a retreat could be on the cards before the bulls seize control again. There is negative divergence between the RSI and the price action, while the MACD has topped and could move below its trigger soon. On the daily chart, the rate is trading well above both the 50- and the 200-day moving averages, and this supports the continuation of the short-term uptrend. What is more, our daily momentum indicators detect strong upside speed. The 14-day RSI just poked its nose above its 70 line, while the daily MACD stands above both its zero and signal lines and points north.
• Support: 187.25 (S1), 186.00 (S2), 184.45 (S3)
• Resistance: 188.35 (R1), 189.20 (R2), 189.80 (R3)
AUD/USD rebounds from 0.7885
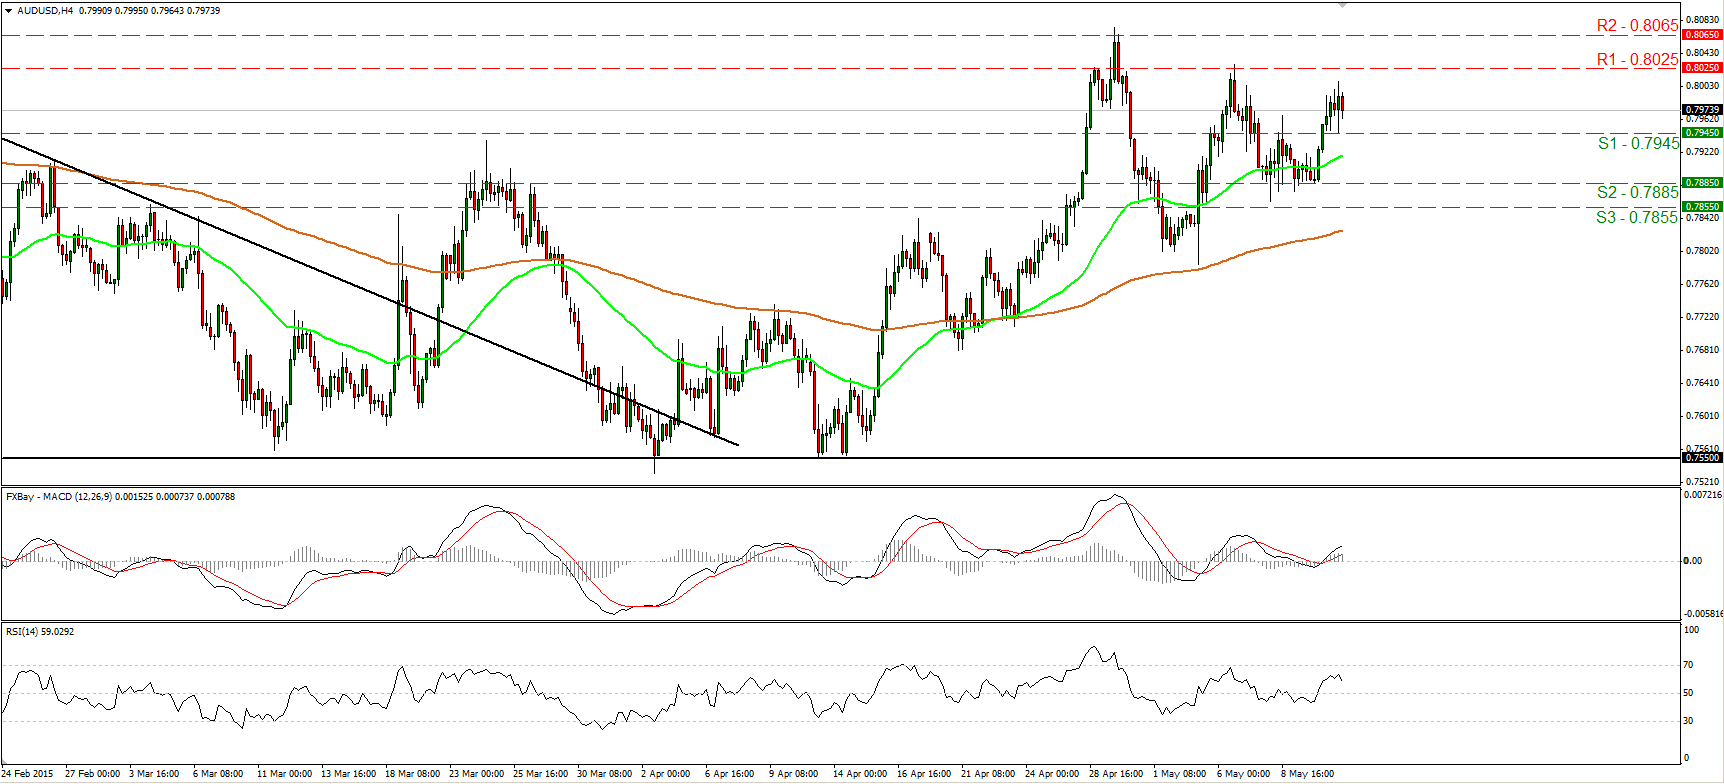
• AUD/USD rebounded from near 0.7885 (S2), broke above 0.7945 (S1), but the advance remained limited below our resistance line of 0.8025 (R1). The rebound confirmed a higher low on the 4-hour chart, therefore I still see a somewhat positive near-term picture. A break above 0.8025 (R1) is likely to target again the 0.8065 (R2) area, defined by the peaks of the peak of the 29th of April. Our oscillators detect positive momentum and amplify the case that AUD/USD could trade higher in the near-term. The RSI stands above its 50 line, while the MACD lies above both its zero and signal lines. However, the RSI has topped and turned down; hence, a pullback could be in the works before buyers take control again. In the bigger picture, the pair is still trading above the uptrend line taken from back the low of the 14th of April, and this keeps the medium term picture positive as well.
• Support: 0.7920 (S1), 0.7860 (S2), 0.7800 (S3)
• Resistance: 0.8025 (R1), 0.8065 (R2), 0.8135 (R3)
Gold still trendless
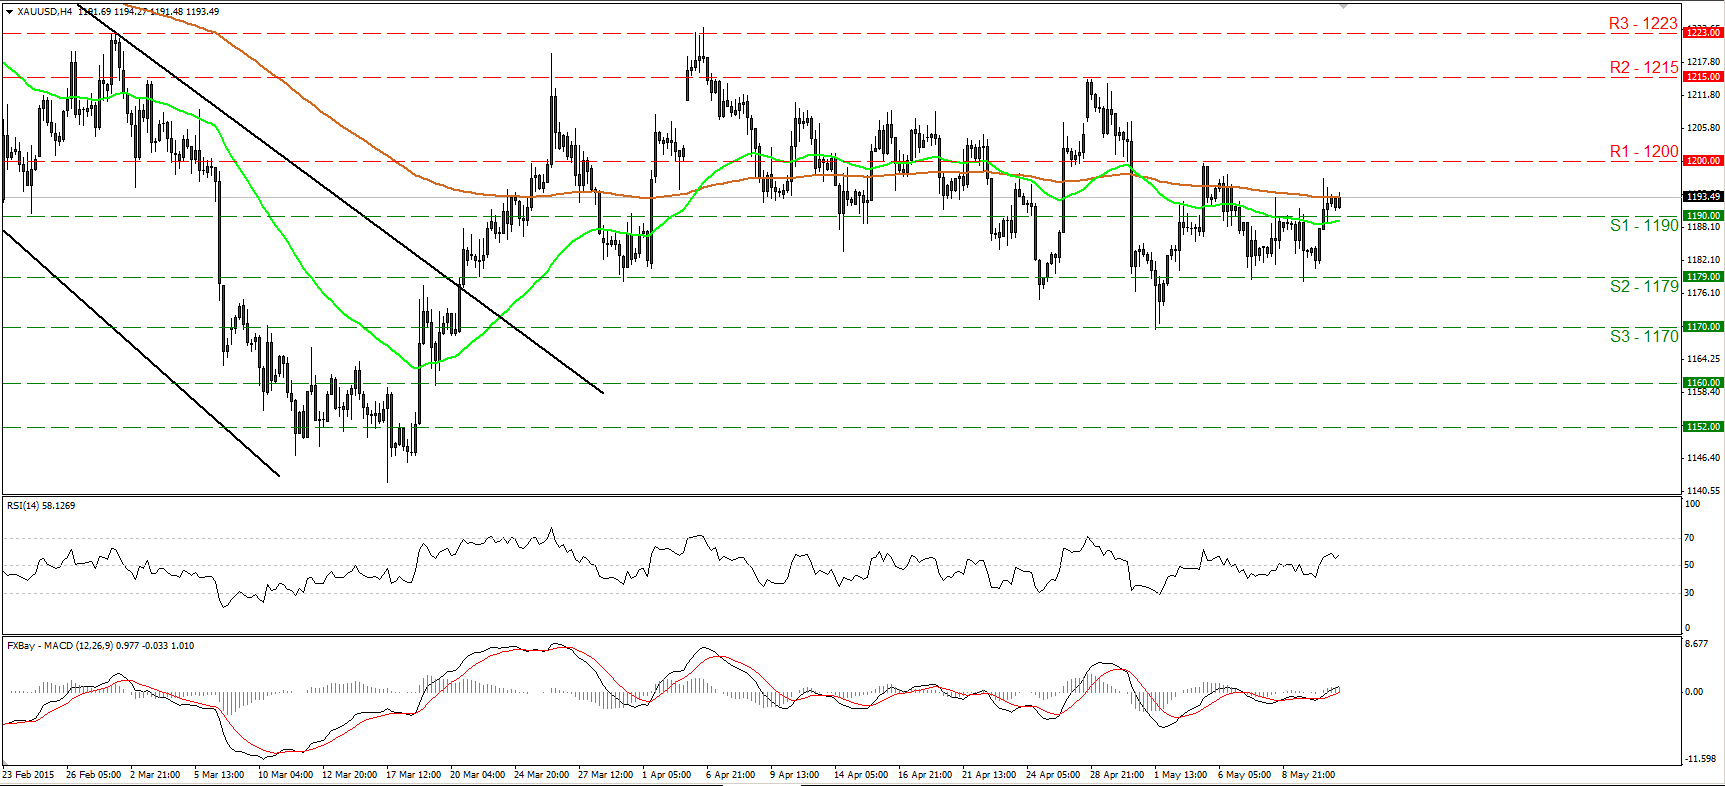
• Gold traded higher on Tuesday, but the advance stayed limited below the 1200 (R1) barrier. Subsequently, the metal pulled back to settle slightly above 1190 (S1). I still don’t see a clear trending structure on the 4-hour chart; therefore, I maintain my view that the short-term outlook is neutral. On the daily chart, both of our short-term oscillators gyrate around their equilibrium lines, confirming the trendless short-term picture. A clear close below 1170 (S3) could be the signal that the 17th of March – 6th of April advance was just a 50% retracement of the 22nd of January – 17th of March decline and that the bias is back to the downside.
• Support: 1190 (S1), 1179 (S2), 1170 (S3)
• Resistance: 1200 (R1), 1215 (R2), 1223 (R3)
WTI shoots up
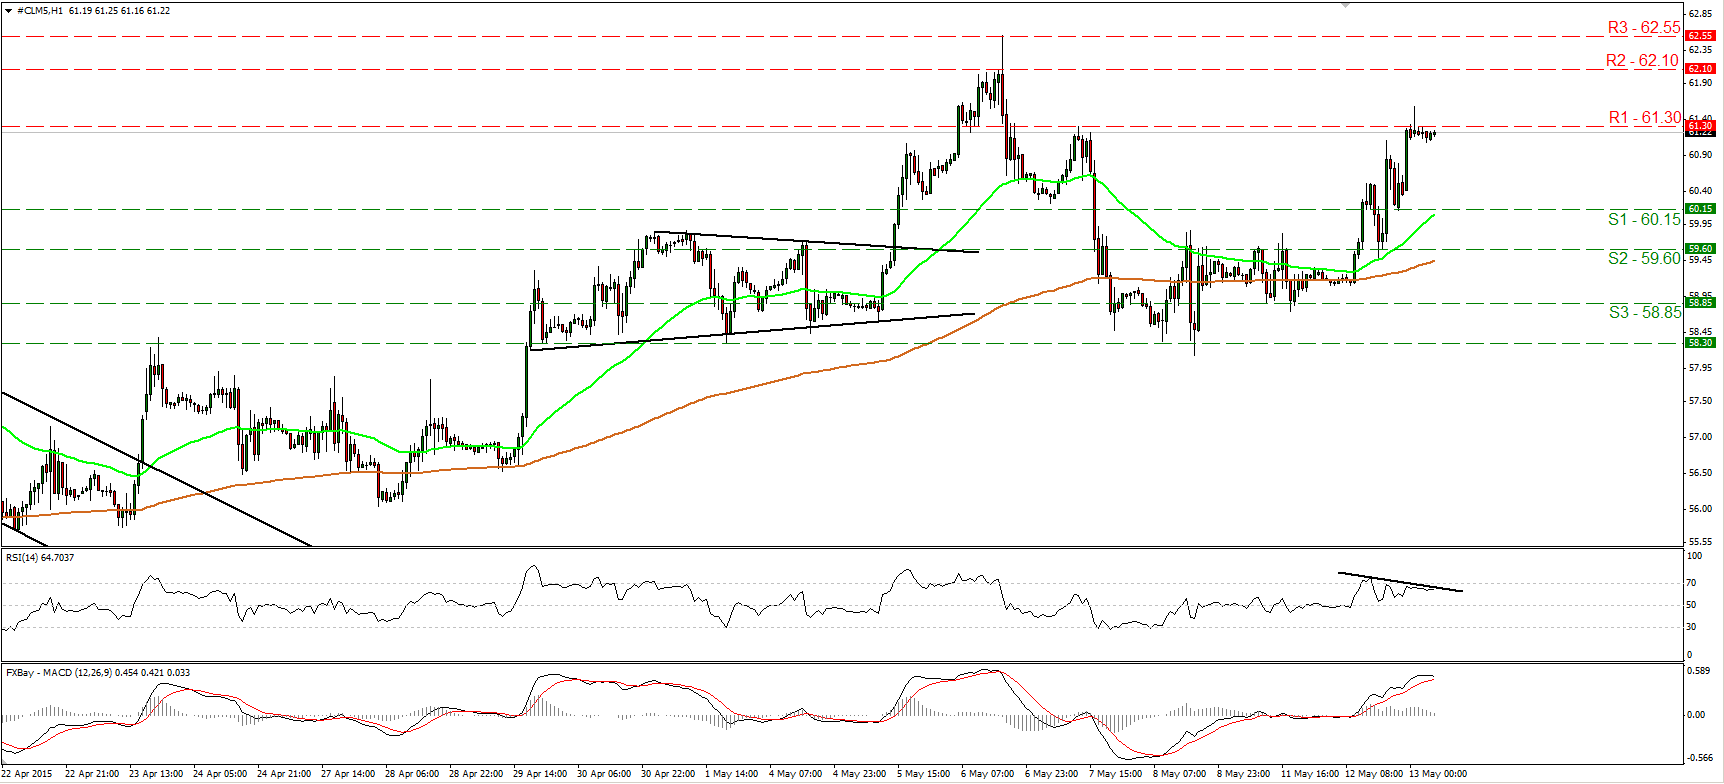
• WTI surged yesterday to trade back above 60.00 until it hit resistance slightly above the 61.30 (R1) line. This shifted the short-term bias back to the upside in my view. A clear break above 61.30 (R1) is likely to open the way for the next resistance at 62.10 (R2). Nevertheless, looking at our short-term oscillators I would be careful that a minor pullback could be looming before the next positive leg. The RSI hit resistance near its 70 line and turned somewhat down, while the MACD has topped and could move below its trigger line soon. Moreover, there is negative divergence between the RSI and the price action. As for the broader trend, on the daily chart, I see a positive medium term outlook as well. The break above 55.00 on the 14th of April signalled the completion of a double bottom formation, something that could carry larger bullish implications in the not-too-distant future.
• Support: 60.15 (S1), 59.60 (S2), 58.85 (S3)
• Resistance: 61.30 (R1) 62.10 (R2), 62.55 (R3)

