Greece: Another meeting...and again no agreement
Greece has been in talks with its international creditors for months trying to secure a favourable deal on its debt repayment and to unlock 7.2bn euros in further financial aid. The statement following the end of Monday’s meeting recognized the progress that has been achieved so far and reiterated that the statement of the 20th of February remains the valid framework for the discussions. Eurogroup President Jeroen Dijsselbloem said that the talks with the new team were “more efficient, more positive, more constructive” and that “we are making fast progress but more time is needed to bridge the remaining gaps”. The improvement in the negotiations came after Greece eased fears that it may default on its payment to the International Monetary Fund (IMF), as it announced that a transfer order was already put to pay the 750mn euros debt interest. Following the positive talks, it is most likely that when the ECB meets on Wednesday to reassess the ELA funds it provides to Greek banks to keep them afloat, it may keep the haircut on the collateral received unchanged.
San Francisco Fed President
John Williams reassured the market that the US economy could rebound in Q2 and that the Q1 weakness in GDP was “a big anomaly”. Williams who is a voting member of the FOMC this year, said that he expects the unemployment rate to decline to 5% or even lower than that by the end of the year. He also reiterated the fact that a rate hike is on the table at every Fed meeting, a decision that will solely depend on the economic data. A key point was that the Fed officials are unlikely to provide much warning ahead of an increase in rates because as he said “you don’t want to make a decision two or three months in advance when you really have more time to collect data and make the most informed decision you can”. Despite the recent batch of soft economic data, the Fed is still on track to raise rates this year and the USD is likely to regain its lost glamour as the alternatives within the G10 become less attractive.
Overnight
Australia’s home loans rose 1.6% mom in March from +1.1% mom in the previous month, well above expectations of +1.0% mom. The biggest part of the lending growth came from housing investment, which suggests that despite efforts from Australian authorities to cool down the housing market, it keeps overheating. AUD/USD didn’t react sharply on the news, but moved higher to break above 0.7900 again. The move up was also supported by the advance in iron ore prices, Australia’s main export product. Aussie could continue to gyrate around 0.8000 against the dollar, as long as iron ore prices are moving higher, but it could move higher against NZD amid expectations for a rate cut by the RBNZ.
Today’s highlights:
During the European day, Sweden’s CPI and CPIF –the Riksbank’s favorite inflation measure, which assumes fixed interest rate and is no directly affected by a change in mortgage rates -are due to be released. The minutes of the Riksbank’s April policy meeting are also coming out. At that meeting, the Bank surprised the market and left its official cash rate unchanged and admitted that the expansionary monetary policy is having a positive impact on the Swedish economy. However, to support the positive development and ensure that inflation rises sufficiently quickly, the Bank decided to extend its QE program by a further SEK 40-50 bn.
A slightly positive tone in the minutes and a strong CPI are likely to support SEK at least temporarily. Nevertheless, a possible decline in USD/SEK following the figures could provide renewed buying opportunities. This is because of the Sweden’s central bank preference of a weak currency, as it has led to higher import and good prices and put upward pressure on CPI, as well as the Bank’s readiness to make monetary policy even more expansionary if necessary that could put SEK under selling pressure.
In the UK, industrial production for March is coming out. A strong industrial production is needed for the final Q1 GDP to accelerate and keep the UK on a recovery path. A positive surprise could strengthen GBP.
In the US, only data of secondary importance are coming out. The NFIB small business optimism for April is expected to have increased a bit, staying fractionally below its December 7-year high. While this indicator is not particularly market-affecting, it’s well worth watching because of the Fed’s emphasis on employment. Small businesses employ the majority of people in the US. The Job Opening and Labor Turnover Survey (JOLTS) report for March is forecast to show that the number of job openings has increased marginally. We will also be watching the “quit rate,” which acts as a barometer of worker confidence in labor market opportunities as once highlighted by Fed Chair Janet Yellen.
As for the speakers, Riksbank Deputy Governor Per Jansson and San Francisco Fed President John Williams speak (again).
The Market
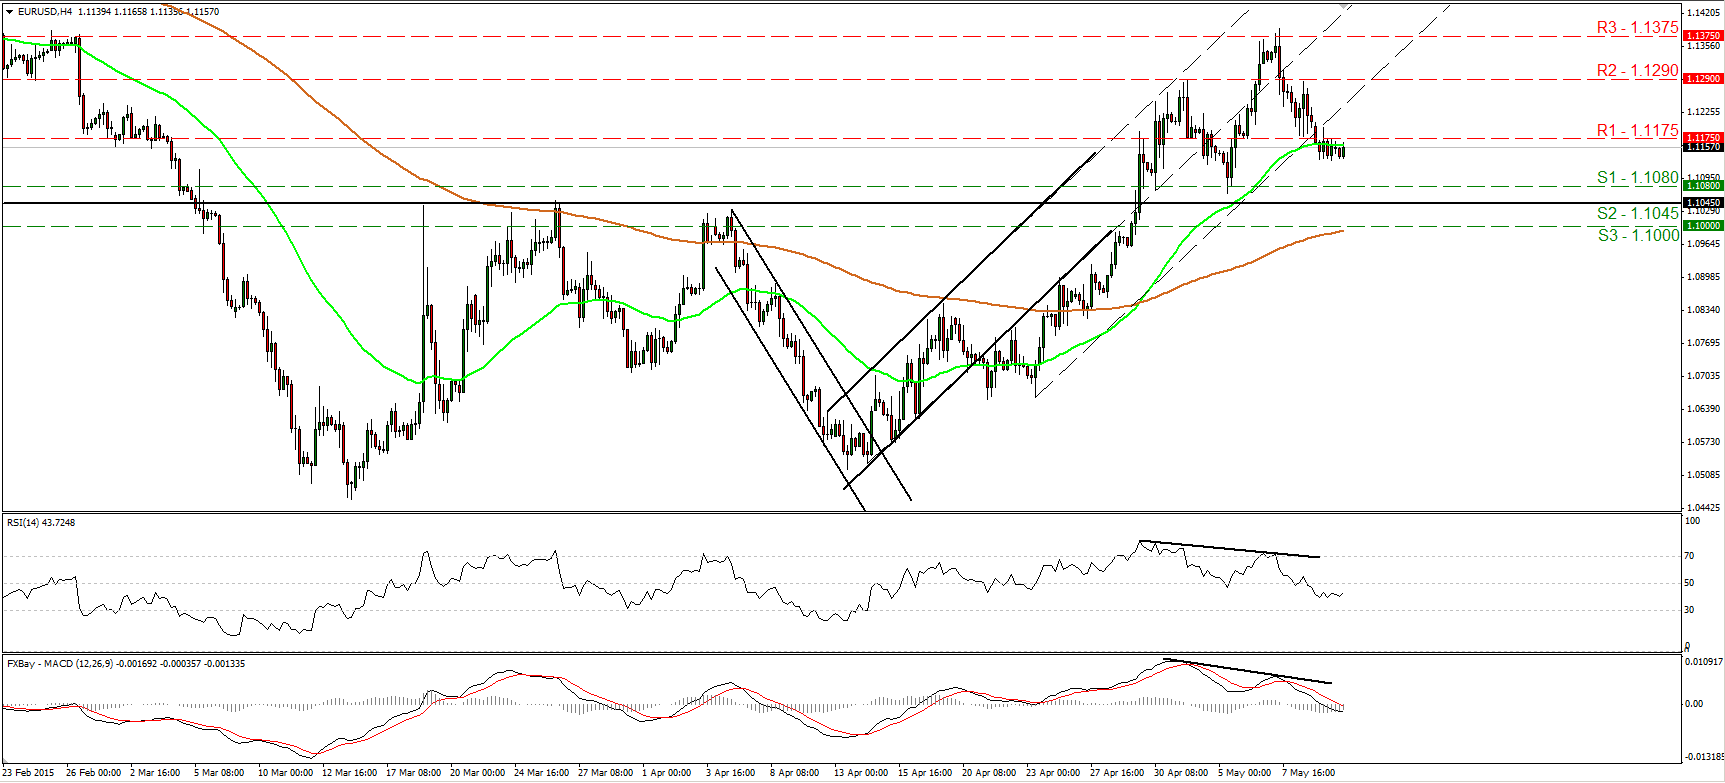
EUR/USD trades in a consolidative manner below 1.1175
EUR/USD traded in a consolidative manner on Monday, staying below the resistance barrier of 1.1175 (R1). Although the possibility for a higher low still exist, I would prefer to stay on the sidelines for now, and the reason is because there is still negative divergence between both our short-term oscillators and the price action. What is more, both these indicators lie within their bearish territories. As for the broader trend, the break above 1.1045 (S2) signaled the completion of a possible double bottom formation, something that could carry larger bullish implications. As a result, I would treat any further declines that stay limited above the 1.1045 (S2) barrier as a corrective move before buyers seize control again.
• Support: 1.1080 (S1), 1.1045 (S2), 1.1000 (S3).
• Resistance: 1.1175 (R1), 1.1290 (R2), 1.1375 (R3).
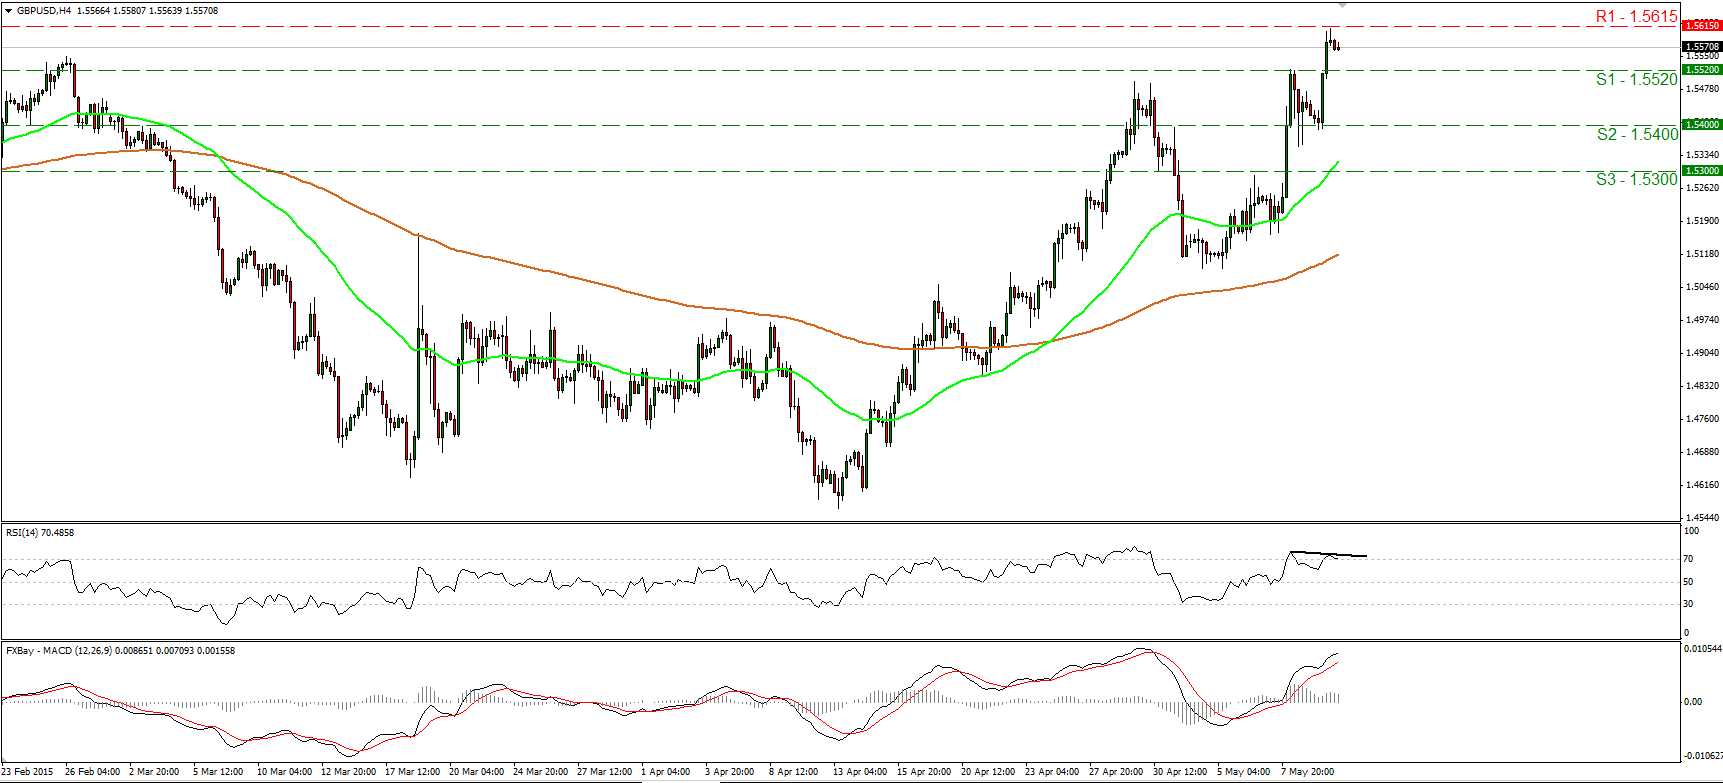
GBP/USD shoots up
GBP/USD surged on Monday after hitting support at 1.5400 (S2), and subsequently broke above the resistance (now turned into support) barrier of 1.5520 (S1). However, the rally was halted at 1.5615 (R1). The price structure suggests a positive short-term picture, therefore I believe that a break above 1.5615 (R1) could carry larger bullish implications and perhaps target the 1.5685 (R2) line, defined by the peak of the 19th of December. Nevertheless, taking a look at our momentum indicators, I see the possibility that a minor pullback could be on the cards before the next positive leg. The RSI looks willing to exit its overbought territory, while the MACD, shows signs that it could start topping. Moreover, there is negative divergence between the RSI and the price action. On the daily chart, the rate is trading well above the 80-day exponential moving average. As a result, I would see a positive medium-term outlook as well.
• Support: 1.5520 (S1), 1.5400 (S2), 1.5300 (S3).
• Resistance: 1.5615 (R1), 1.5685 (R2), 1.5760 (R3).
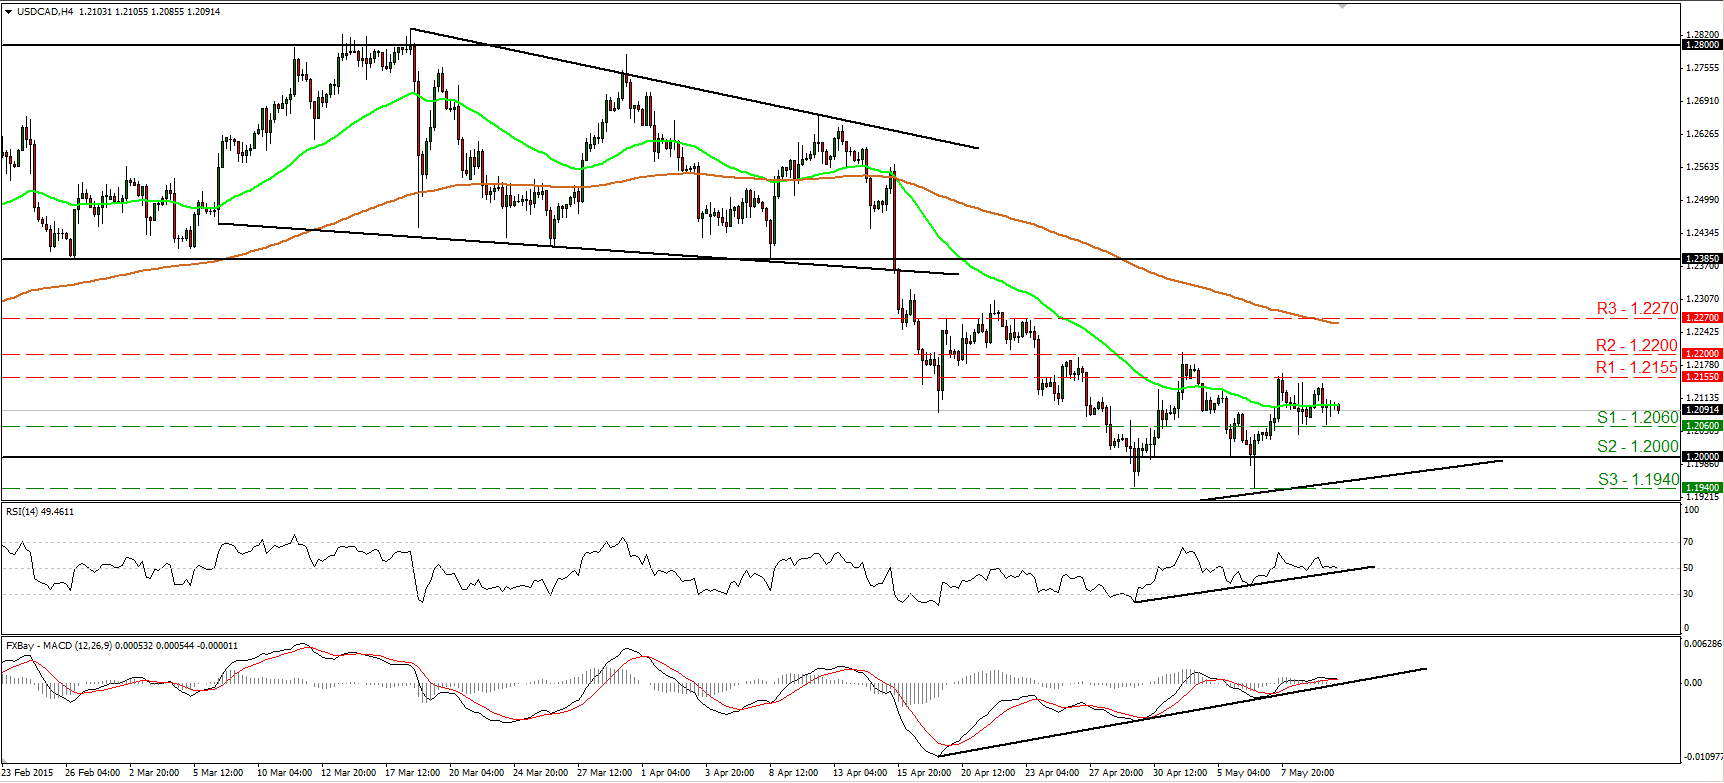
USD/CAD hits support near 1.2060
USD/CAD traded somewhat lower yesterday and hit support near the 1.2060 (S1) line. However, I would expect the rate to trade higher in the near future. The reasons are: 1) the rate found twice solid support at 1.1940 (S3), 2) the rate is trading very close to the longer-term uptrend line taken from the low of the 11th of July 2014, 3) there is positive divergence between our short-term oscillators and the price action. A break above 1.2200 (R2) is the move that could shift the short-term bias to the upside and perhaps open the way for the next resistance at 1.2270 (R3). On the downside, only a clear close below the aforementioned uptrend line and the 1.1940 (S3) hurdle would make me again confident on the downside. Such a move could carry larger bearish extensions and perhaps pull the trigger for the 1.1800 zone.
• Support: 1.2060 (S1), 1.2000 (S2), 1.1940 (S3).
• Resistance: 1.2155 (R1), 1.2200 (R2), 1.2270 (R3).
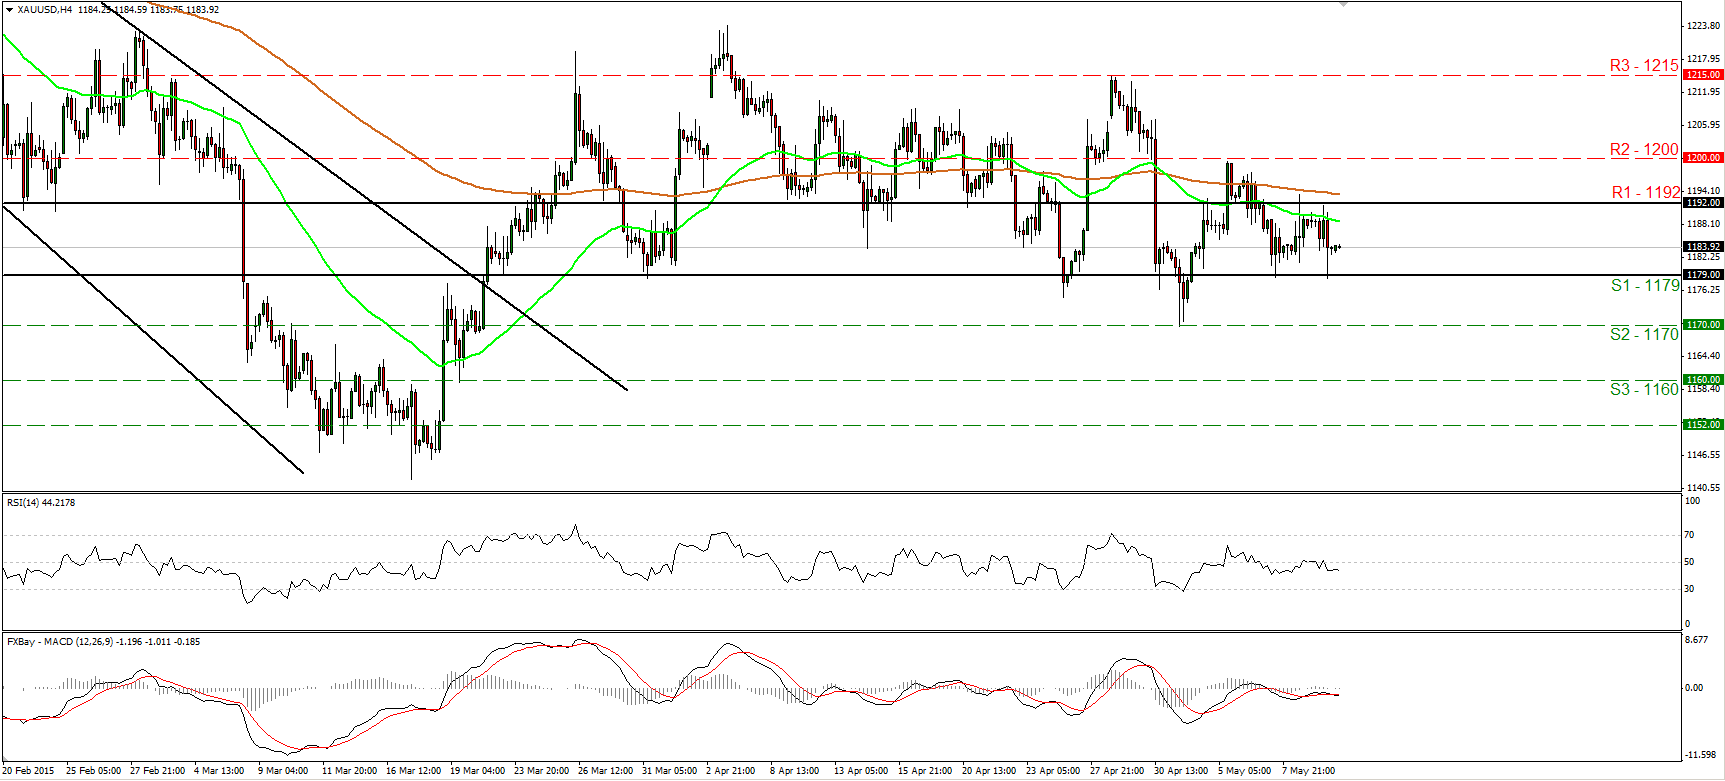
Gold remains trendless
Gold traded lower on Monday to challenge again the 1179 (S1) support line. Subsequently, the metal rebounded somewhat. Since the 6th of the month, the metal has been oscillating between that support line and the resistance of 1192 (R1). Therefore, I maintain my view that the short-term outlook is neutral. On the daily chart, both our short-term oscillators gyrate around their equilibrium lines, confirming the trendless short-term picture. A clear close below 1170 (S2), could be the signal that the 17th of March – 6th of April advance was just a 50% retracement of the 22nd of January – 17th of March decline, and that the bias is back to the downside.
• Support: 1179 (S1), 1170 (S2), 1160 (S3).
• Resistance: 1192 (R1), 1200 (R2), 1215 (R3).
WTI traded in a sideways mode
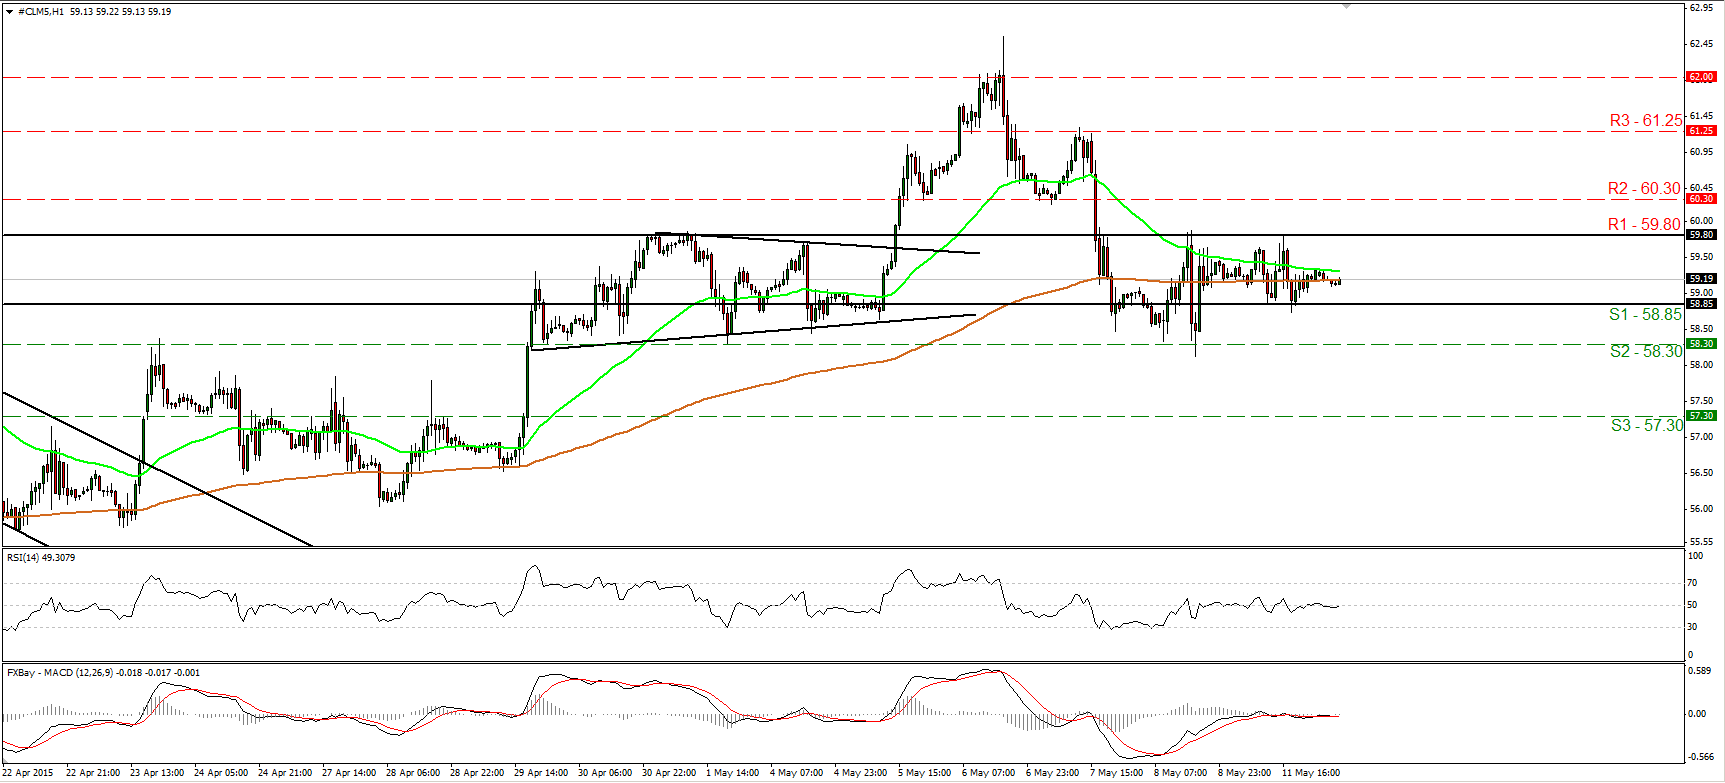
WTI moved in a sideways mode on Monday, staying between the support barrier of 58.85 (S1) and the resistance of 59.80 (R1). The sideways mode is also visible on our hourly momentum studies. Both the 14-hour RSI and the hourly MACD lie near their equilibrium lines and they point east. However, I believe that last week’s fall back below the 60.00 line shifted the short-term bias negative. A break below 58.85 (S1) is likely to pull the trigger for another test at the 58.30 (S2) territory. As for the broader trend though, on the daily chart, I see a positive medium term outlook. The break above 55.00 on the 14th of April signalled the completion of a double bottom formation, something that could carry larger bullish implications in the not-too-distant future. As a result, I would treat any short-term declines that stay limited above 55.00, as a corrective move before the next positive leg.
• Support: 58.85 (S1), 58.30 (S2), 57.30 (S3).
• Resistance: 59.80 (R1) 60.30 (R2), 61.25 (R3).

