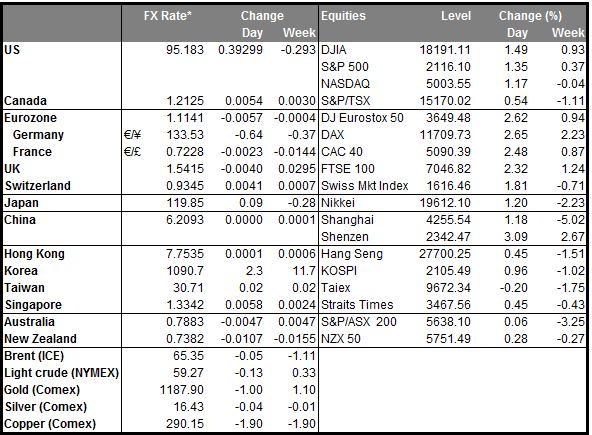
• China cuts interest rates for the 3rd time in 6 months The People’s Bank of China (PBoC) cut the one year lending rate by 25bps to 5.1% from 5.35% and the one year deposit rate by the same amount to 2.25%. The move came to support the weakening economy, after recent indicators suggested a further slowdown in Q2. As the country’s growth continues to slow, we could see additional easing measures in the coming months to lower financing costs and create more momentum for the economy. Australia and New Zealand, whose economies are heavily dependent on exports to China, saw their currencies fall on the news, as the recent stimulus measures don’t support the real economy but instead, has benefited the stock market. I would expect the NZD to weaken more that AUD, following the recent shift towards an easing bias from the RBNZ and the high possibility of a rate cut at its next meeting.
• US nonfarm payrolls just missed expectations and rose 223k in April, but the downward revision of the March figure to 85k from 126k and the weaker-than-expected wage growth disappointed investors over the soft US momentum in early 2015. Nevertheless, the decline in the unemployment rate has kept the scenario for a rate hike in September alive, and if other economic indicators rebound and show that Q1 weakness was due to transitory factors, the dollar could regain its lost glamour.
• Eurozone finance ministers meet today and of course Greece will be on the agenda, as usual. Last week the ECB decided to raise the amount of Emergency Liquidity Assistance (ELA) funds it supplies to Greek banks but put off a decision on the discount, or “haircut,” on the collateral for those funds so it could see the result of this meeting. Unfortunately, we don’t expect any breakthroughs. Eurogroup chief Jeroen Dijsselbloem said "Still, lots of issues have to be solved…so there will be no agreements on Monday.” That implies when the ECB meets again on Wednesday, it may increase the haircut on the collateral Greek banks supply to secure the ELA funds. The Greek newspaper Kathimerini says the ECB will consider raising it from the current 23% to 44%, 65% or even 80%. If it does raise the haircut, then Greek banks will either have to come up with more collateral or they will receive less funds. In either case they would probably have to call in some loans. That would increase pressure considerably on the Greek government. Meanwhile, the market has already started turning the screws. According to Bloomberg, international securities firms are curtailing trading with major Greek banks -- pulling credit lines and restricting FX trading limits – out of fear that the country may institute capital controls or even default.
• Today’s highlights: The Bank of England meets to decide on its key policy rate. There’s little chance of a change, hence the impact on the market is likely to be minimal, as usual. The minutes of the meeting however should make interesting reading when they are released on 20th of May. As mentioned by the BoE’s formerly hawkish MPC member Ian McCafferty, the majority of wage settlements are agreed between January and April, therefore we could see some discussion of how the very low inflation has affected wage negotiations. Another key point probably will be the Bank’s view, if any, on the general election result and how it is going to affect the period ahead, although probably their forecasts about the election were as wrong as everyone else’s.
• In Norway, we get the CPI for April. Uniquely among the G10, their CPI is close to the Bank’s 2.5% target. Nevertheless, following the Norges Bank decision to keep its interest rates unchanged and mentioning that they may cut rates in June, NOK could weaken again if Bank officials act in their next policy meeting. On the other hand, the strong household demand and the recent higher oil prices are positive for the Norwegian economy and could keep NOK supported as long as Brent oil price rises.
• From Sweden, we get the PES unemployment rate for April. This could be an early hint of a possible improvement in the official unemployment rate coming out on the 20th of the month. A decline in the rate could prove SEK-positive.
• In the US, we get the labor market conditions index for April. This is a monthly index that draws on a range of data to produce a single measure to gauge whether the labor market is on the whole improving. Following the improving US employment report released on Friday, the LMCI index although not major market mover, is likely to show the broader US labor condition and if the Fed is on track to achieve its maximum employment mandate.
• As for the speakers, ECB Governing Council member Ewald Nowotny speaks.
• Rest of the week The highlight will be the Bank of England quarterly inflation report on Wednesday. BoE Gov. Mark Carney will present the quarterly inflation report with the economic assessment along with updates of the Bank’s GDP and inflation forecasts. If Gov. Carney repeats that inflation will reach 2% in the two-year forecast and the next move in rates will most likely be an increase, investors could bring forward their rate hike expectations and GBP could strengthen somewhat.
• On Tuesday, Sweden’s CPI and CPIF – the Riksbank’s favorite inflation measure -- are due to be released. On 29th of April, the Riksbank surprised the market and left its official cash rate unchanged while extending its QE program by a further SEK 40bn-50bn. Tuesday’s CPI numbers are likely to support SEK at least temporarily, and a possible decline in USD/SEK following the figures could provide renewed buying opportunities, because of the Swedish central bank’s preference for a weak currency.
• On Wednesday, besides the BoE quarterly inflation report, the UK unemployment rate for March is forecast to have ticked down to 5.5% from 5.6% in the preceding month, while average weekly earnings are expected to have risen at the same annual pace as previously (+1.7% yoy). Bearing in mind that the inflation rate declined to 0.0%, a steady increase in nominal wages implies an acceleration in real wages. This, accompanied by a decline in the unemployment rate, could support the pound.
• In Europe, the main data will be the preliminary Q1 GDP figures for France, Germany and the Eurozone as a whole. Eurozone’s preliminary GDP rate for Q1 is expected to have risen a bit from Q4, while figures released from Germany, Europe’s growth engine are likely to show that the economy slowed moderately from Q4.
• On Thursday, the only noteworthy indicator we get is the US PPI for April, while on Friday, we get US industrial production also for April.
The Market
EUR/USD continues its tumble
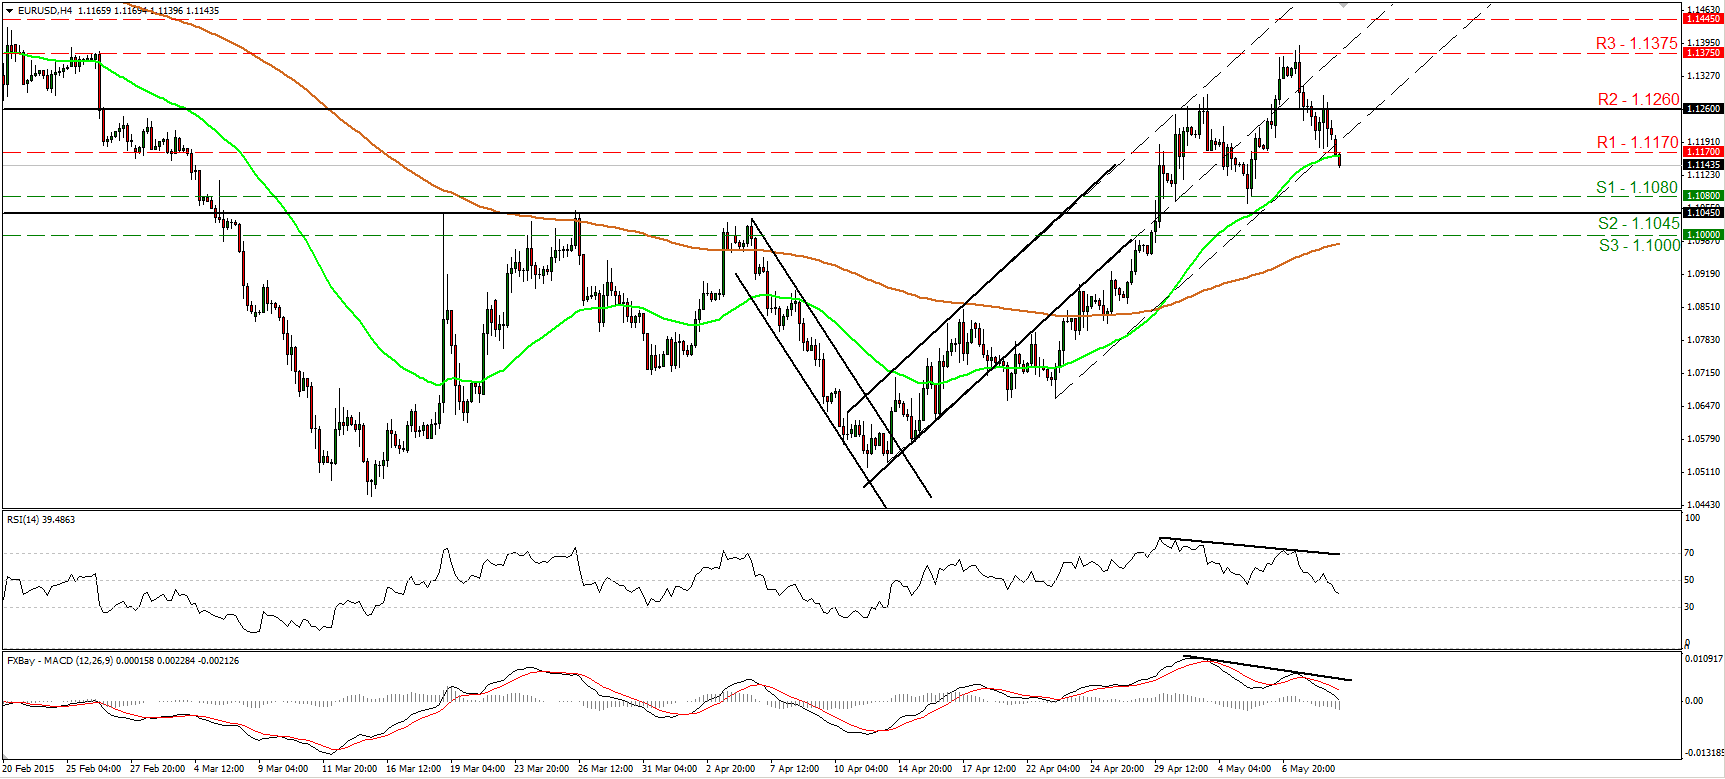
• EUR/USD continued declining on Friday, falling below the support (now turned into resistance) barrier of 1.1170 (R1). Although the possibility for a higher low still exist, I would prefer to take the sidelines now, and the reason is because I still see negative divergence between both our short-term oscillators and the price action. What is more, the RSI continued lower after falling below its 50 line, while the MACD, already below its trigger, appears ready to obtain a negative sign. As for the broader trend, the break above 1.1045 (S2) signaled the completion of a possible double bottom formation, something that could carry larger bullish implications. As a result, I would treat any further declines that stay limited above the 1.1045 (S2) barrier as a corrective move before buyers seize control again.
• Support: 1.1080 (S1), 1.1045 (S2), 1.1000 (S3)
• Resistance: 1.1170 (R1), 1.1260 (R2), 1.1375 (R3)
GBP/JPY pulls back after hitting 186.00
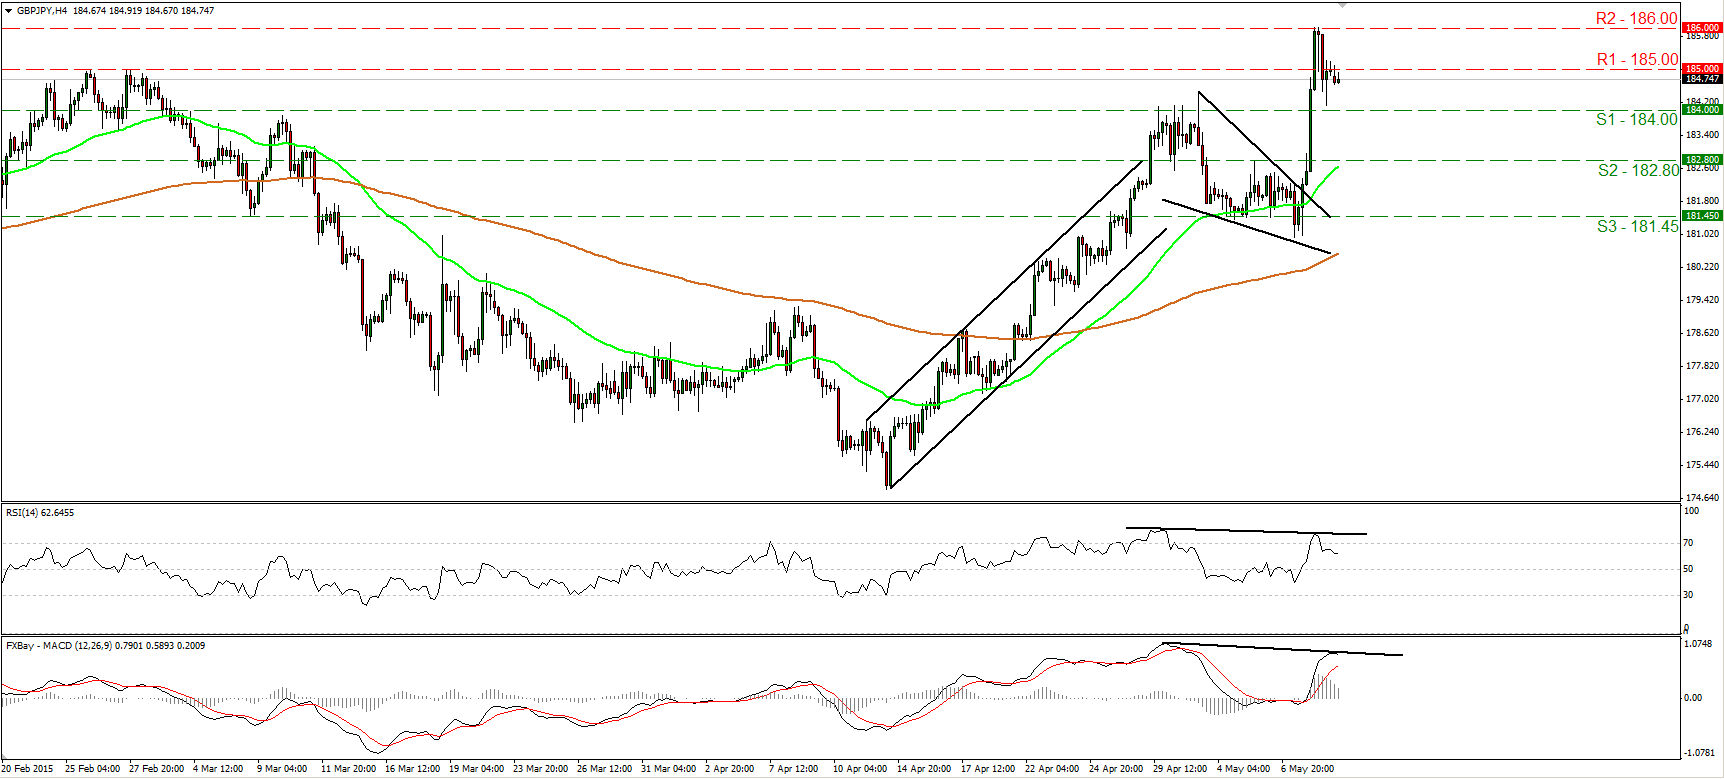
• GBP/JPY slid back below 185.00 (R1) on Friday after it hit resistance at 186.00 (R2). Although the pullback may continue for a while, Thursday’s rally following the UK elections confirmed a forthcoming higher high and kept the short-term picture positive. The likelihood for the continuation of the pullback is visible on our short-term oscillators. The RSI moved lower after exiting its overbought zone, while the MACD shows signs of topping and that it could fall below its trigger line in the near future. There is also negative divergence between both the indicators and the price action. As a result, the pullback may continue towards the 184.00 (S1) zone before buyers take control again. On the daily chart, the rate is trading well above both the 50- and the 200-day moving averages, and this supports the continuation of the short-term uptrend. What is mover, our daily momentum indicators detect strong upside speed. The 14-day RSI just poked its nose above its 70 line, while the daily MACD stands above both its zero and signal lines, and points north.
• Support: 184.00 (S1), 182.80 (S2), 181.45 (S3)
• Resistance: 185.00 (R1), 186.00 (R2), 187.25 (R3)
NZD/USD keeps falling
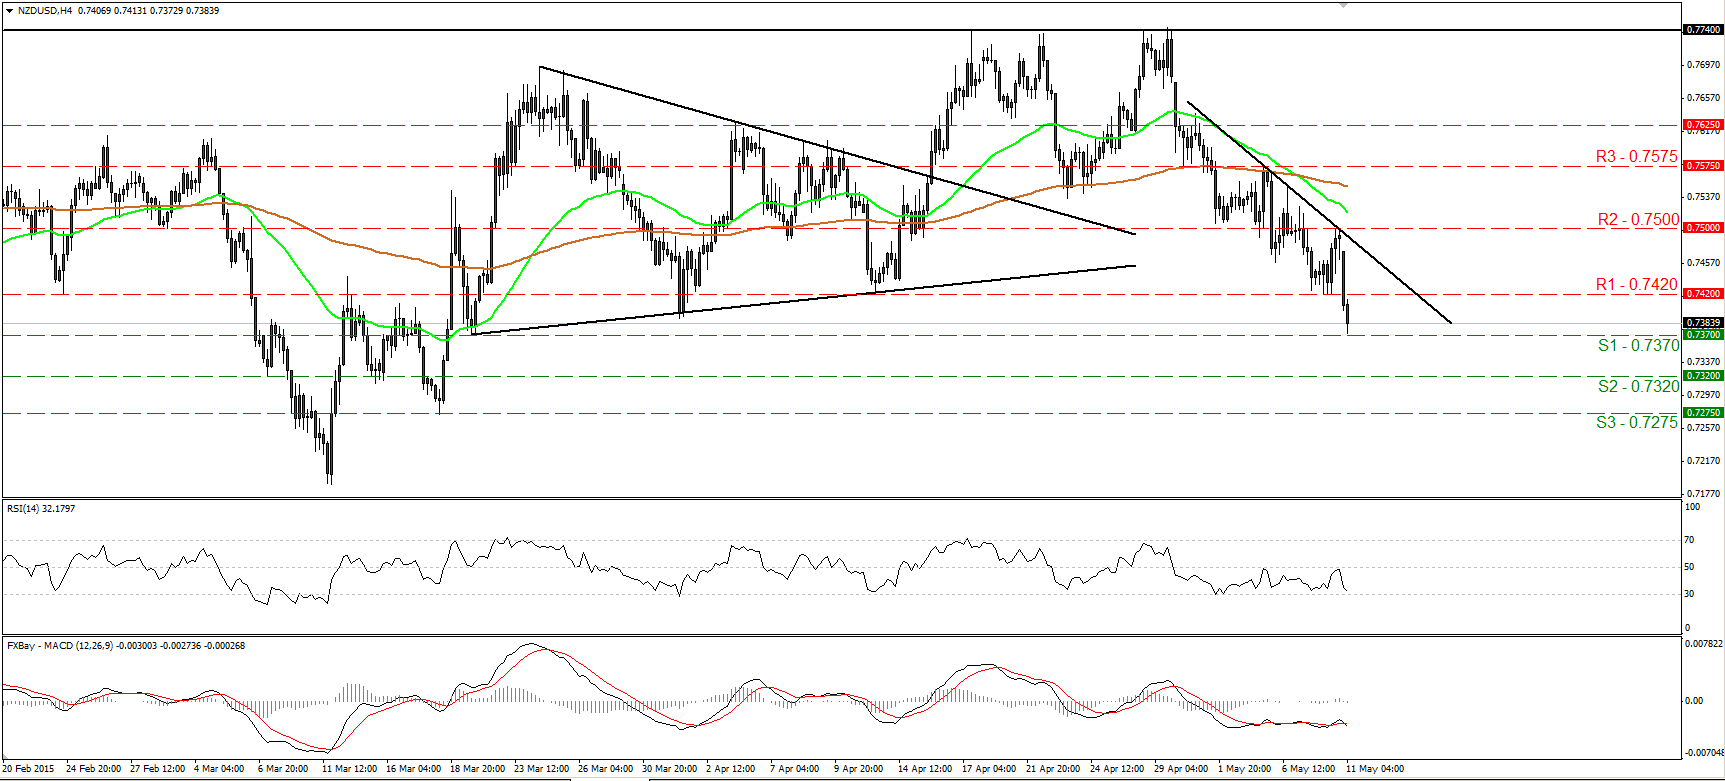
• NZD/USD continued to slide on Friday, breaking below the support (now turned into resistance) of 0.7420 (R1), but the decline was halted by the 0.7370 (S1) line. After the completion of a double top pattern on the 4-hour chart, the short-term bias has turned negative, in my view. A clear move below 0.7370 (S1) is likely to extend the decline towards our next hurdle of 0.7320 (S2). Our short-term oscillators corroborate my view and support the case that further declines could be in the works. The RSI tumbled after hitting resistance at its 50 line, while the MACD, already negative, fell again below its trigger line. On the daily chart, the failure of the pair to overcome the 0.7740 territory and the subsequent decline, make me switch my view on the overall path to neutral, at least for now.
• Support: 0.7370 (S1), 0.7320 (S2), 0.7275 (S3)
• Resistance: 0.7420 (R1), 0.7500 (R2), 0.7575 (R3)
Gold remains trendless
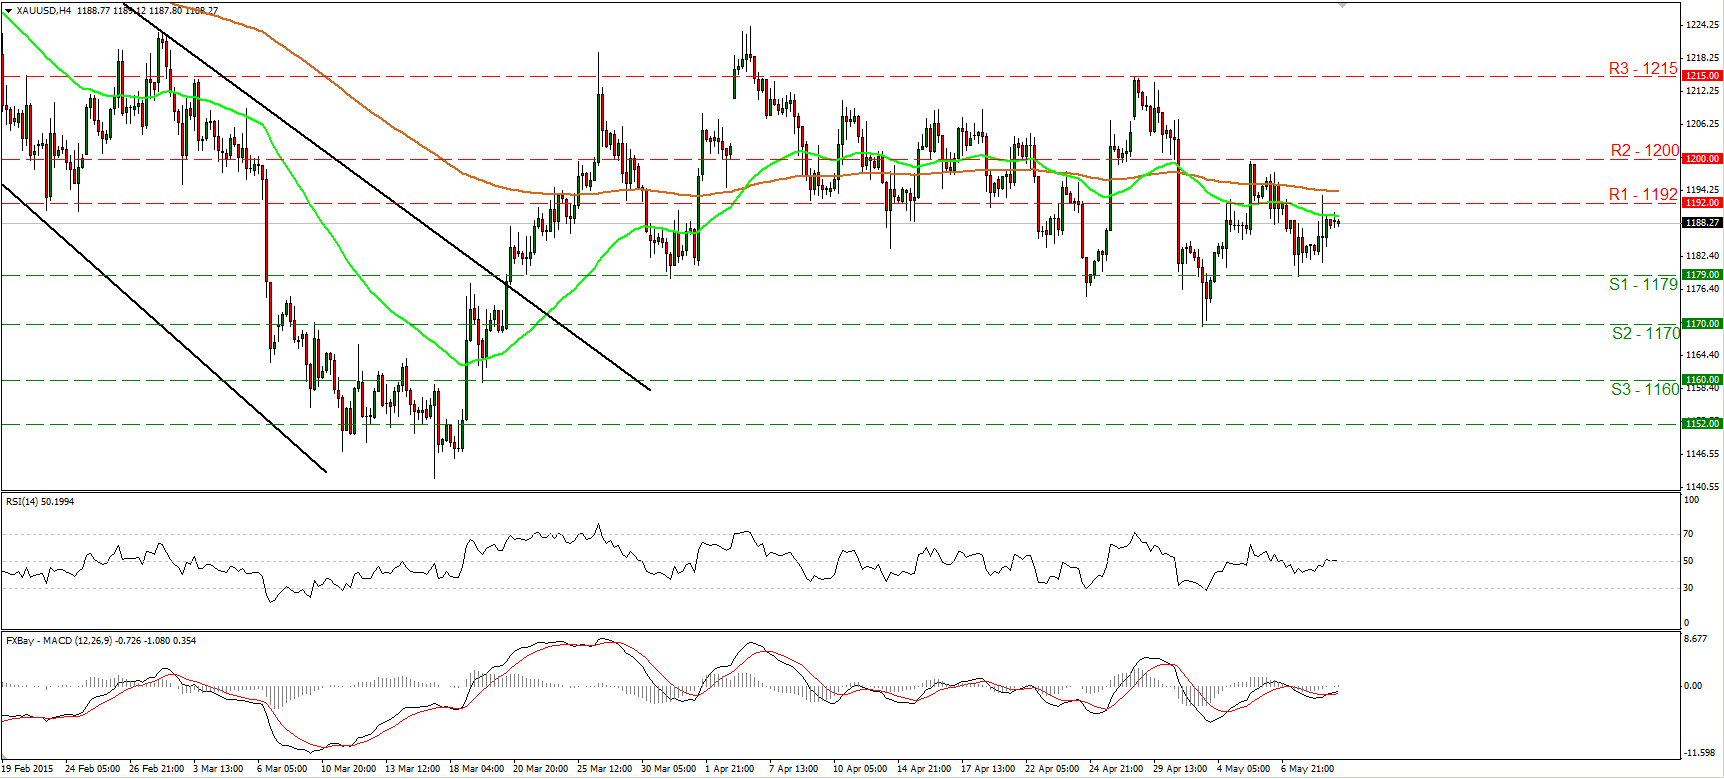
• Gold traded higher on Friday, after finding support near the 1179 (S1) line. Subsequently, the metal found resistance slightly above 1192 (R1) and then retreated somewhat. I believe that the forthcoming wave is likely to be negative, perhaps for another test at the 1170 (S1) barrier. Nevertheless, although we may experience a negative move, I maintain my view that the outlook is neutral. On the daily chart, both our short-term oscillators gyrate around their equilibrium lines, confirming the trendless short-term picture. A clear close below 1170 (S2), could be the signal that the 17th of March – 6th of April advance was just a 50% retracement of the 22nd of January – 17th of March decline, and that the bias is back to the downside.
• Support: 1179 (S1), 1170 (S2), 1160 (S3)
• Resistance: 1192 (R1), 1200 (R2), 1215 (R3)
WTI hits support near 58.30
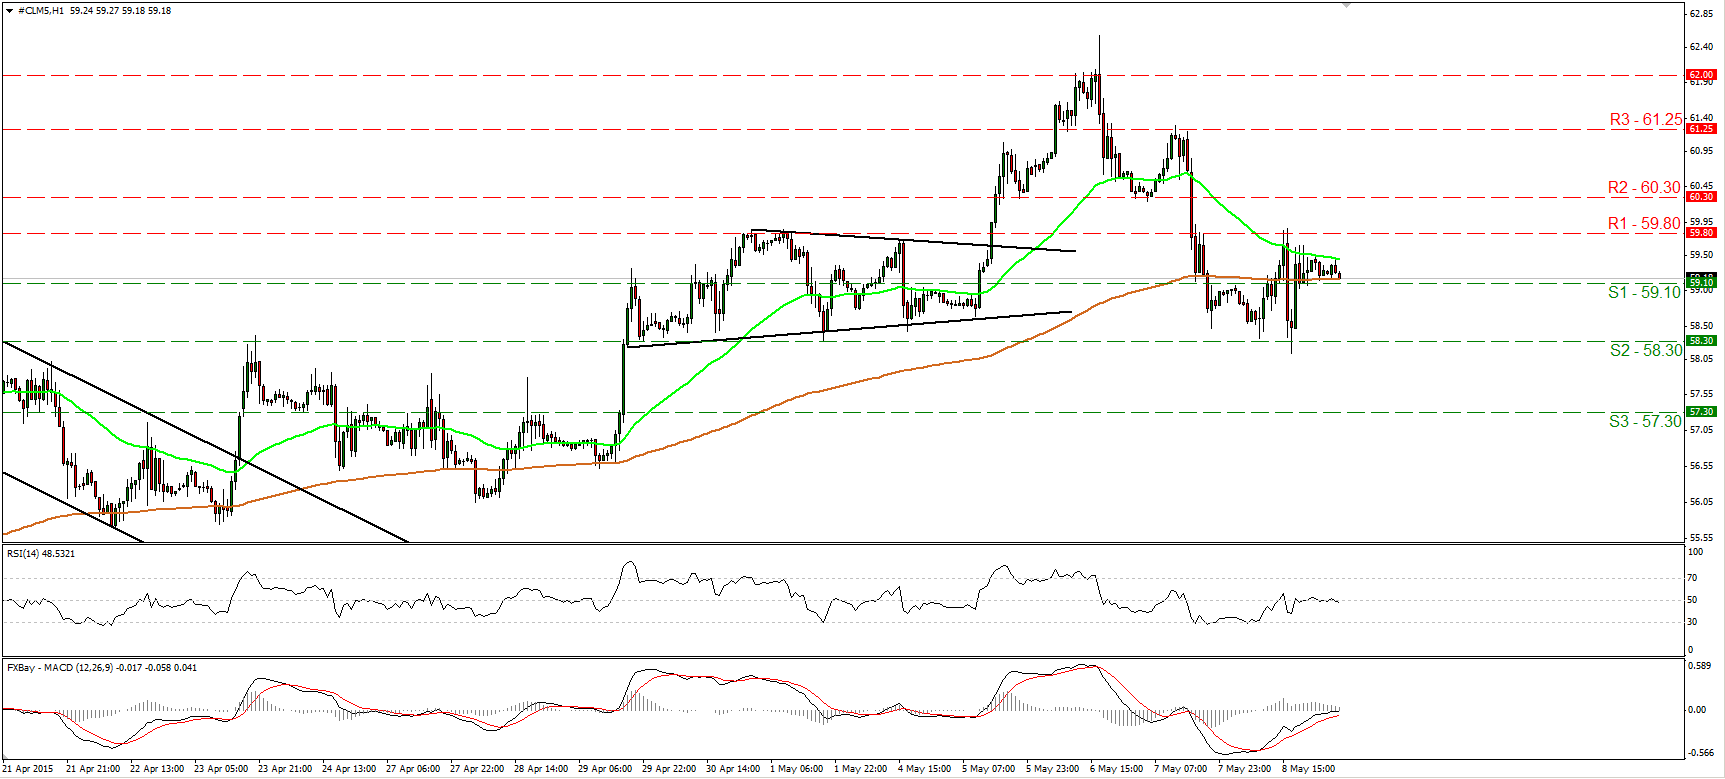
• WTI fell on Friday, but hit support marginally below 58.30 (S2) and subsequently rebounded to continue quietly above the 59.10 (S1) barrier. The quiet mode is also visible on our hourly momentum studies. Both the 14-hour RSI and the hourly MACD stand near their equilibrium lines. However, I believe that Thursday’s fall back below the 60.00 line shifted the short-term bias negative. A break below 59.10 (S1) is likely to pull the trigger for another test at the 58.30 (S2) territory. As for the broader trend though, on the daily chart, I see a positive medium term outlook. The break above 55.00 on the 14th of April signalled the completion of a double bottom formation, something that could carry larger bullish implications in the not-too-distant future. As a result, I would treat any short-term declines that stay limited above 55.00, as a corrective move before the next positive leg.
• Support: 59.10 (S1), 58.30 (S2), 57.30 (S3)
• Resistance: 59.80 (R1) 60.30 (R2), 61.25 (R3)

