ADP miss hits USD
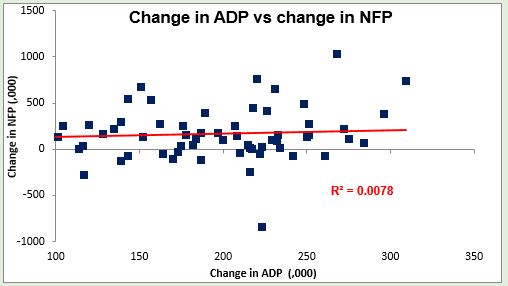
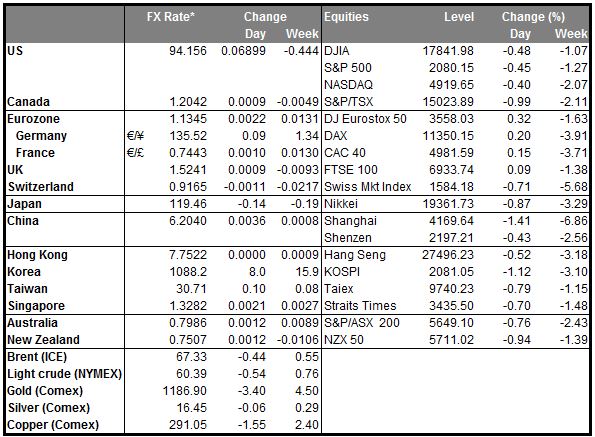
The dollar was down across the board after the US ADP report came in with only 175k jobs, below estimates of 200k. The fact is though that the ADP report is a fairly poor indicator of the nonfarm payrolls. As the graph to the right shows, the relation between the change in ADP and change in NFP is not statistically significant. Going back to 2001, the change in the NFP has been higher than the change in ADP 86 times and lower 85 times – exactly random! I’ve heard that the ADP report is a better forecaster of the final figure for NFP than it is of the preliminary figure – indeed, if I remember correctly, this person argued that it was better at forecasting the final NFP figure than the preliminary NFP figure itself was. However, I haven’t run those numbers myself so I can’t attest to it. Nonetheless, you can’t fight the market. If the market wants to take the ADP report as a preliminary estimate of the NFP figure it certainly will, and there’s no sense taking the opposite view. Expectations of a weak NFP on Friday simply lower the bar for a USD recovery then.
Fed funds expectations keep rising
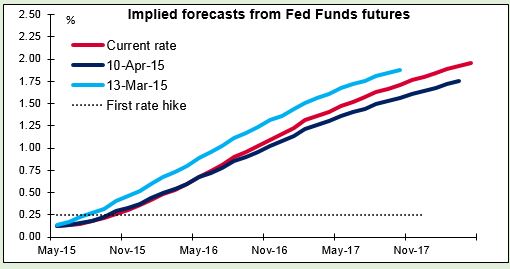
The disappointing data did not dampen Fed rate expectations. On the contrary, Fed fund futures show that rate expectations are higher than they were on 10 April, the day that DAX peaked and the eurozone trade started to turn around, and are down only slightly from 13 March, the day the DXY index peaked. Indeed rate expectations were up 4.5 bps in the long end yesterday despite the disappointing ADP report. This may be because of Atlanta Fed President Lockhart’s comment that investors’ expectations of a rate hike in September is “reasonable.” “All meetings are in play, including June,” he said. What this says to me is that the dollar’s decline is more a matter of positioning than reassessing the fundamental situation and at some point the monetary divergence story will return and USD will resume its rise.
ECB puts off decision on Greek haircut till next week
The ECB meeting yesterday reportedly raised the amount of Emergency Liquidity Assistance (ELA) that the ECB would supply to the Greek banks by EUR 2bn to EUR 78.9bn while putting off until next week a decision on whether to increase the haircut charged on collateral. One anonymous official was quoted as saying the ECB would increase the haircut unless the government shows a willingness to compromise in the bailout talks. The ECB apparently wants to see what happens at next Monday’s meeting of European finance ministers before pulling the plug. An EU official said the negotiations have made “good progress,” but there still seem to be some questions. Apparently next week is the crunch time, especially as Greece has to make a EUR 767mn payment to the IMF on Tuesday, May 12th.
Australia’s unemployment rate rises
Australia’s unemployment rate rose to 6.2% from 6.1%, as expected. To make matters worse, the number of employed people fell, while the job mix worsened – fewer full-time jobs, more part-time jobs. Even though the RBA cut rates on Tuesday, the AUD has strengthened as the statement sounded a bit optimistic over the country’s fundamentals. Added to that the rise in iron ore prices, Australia’s main export, AUD remained well supported and could strengthen even more if iron ore prices continue to rise. AUD gained on the day despite the disappointing number, showing continued demand for AUD. I believe this strength is temporary from a fundamental point of view, but the technicals suggest further strength is in store. Watch for the quarterly Statement on Monetary Policy due out tomorrow, with an update on economic growth and inflation forecasts.
Today’s highlights:
German factory orders rose 0.9% mom in March, a rebound from the decline in February but below expectations. From France, we get industrial production for March. Even though neither of these indicators is a major market mover, they could add to the recent positive data from eurozone economies.
Norges Bank to stay on hold
The main event during the European day will be the Norges Bank policy meeting. In their last meeting, the Bank surprised the market and kept its interest rates unchanged at 1.25%. The Bank argued that the effects of low oil prices on the real economy have been relatively small and house prices are still rising at a fast pace, justifying their decision to remain on hold. Since then, not much has changed fundamentally in the country and the rise in oil prices have been strengthening NOK. With Brent crude oil just below USD 70, we expect the Bank to remain on hold again, which could prove NOK-positive.
In the US, initial jobless claims for the week ended May 2 are coming out.
As for the speakers, Norges Bank Governor Oeystein Olsen holds a press conference after the rate decision. ECB Executive Board member Yves Mersch also speaks.
It’s UK election day!
The UK election takes place during the day. The polls are open from 0700 to 2200 local time (0600 GMT to 2100 GMT). Immediately after the polls close, the first exit polls will be released. For the last two elections the major broadcasters have jointly commissioned exit polls, which has improved the accuracy of their predictions. In the 2010 and 2005 elections, the exit polls predicted the results exactly, while the 2001 exit poll was just 10 seats off. Of course, given how close this election is likely to be, 10 seats would be a big margin of error.
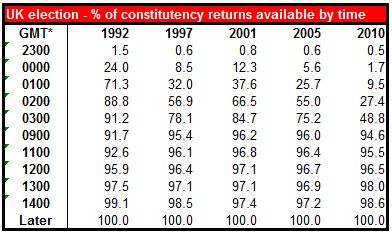
The first official results will probably start to be released around 2300 local time (2200 GMT) and will drip out a few constituencies at a time. The first two hours are usually dominated by safe Labour seats where the vote is easy to count. The results usually start coming more frequently after 0100 local time (0000 GMT). The largest group is due from 0200 to 0500 local time ( 0100 GMT to 0400 GMT), with around half due by 0300 local time (0200 GMT). By that time we should have a general feel for how it’s developing.
The last constituency will declare at around 1300 local time (1200 GMT) Friday morning. One complication is that local government elections will be taking place in most of England (not including London) at the same time, so the results from those constituencies will be known later. The latest polls and results from the betting odds suggest the following result:
- Conservatives 280-285
- Labour 265-270
- Liberal-Democrats 25
- Scottish Nat’l Party >50
- UKIP 3
Knowing the results are only half the story, if that. It’s almost certain that neither of the two major parties will get a majority (326 are necessary in theory, but since the 5 Northern Ireland representatives normally don’t take up their seats, 323 is the actual figure). The question then becomes which one can form a government. Last time, the negotiations started right away – there were hints in various MP’s acceptance speeches when the results of their constituencies were declared. Moreover, it was fairly straightforward then as the possibilities were limited. Even so, it took five days. This time around it could last until 27 May, when the government is required to submit a legislative program for the Queen’s Speech. If there is no government by then, or if the program fails to pass a vote in the House of Commons (which is possible if a minority party attempts to form a government) then the government would fall and either another party would try to form a government or there would be another election. I expect the political uncertainty to weigh on the pound and for the currency to weaken at least until agreement on the government has been reached.
The Market
EUR/USD breaks above 1.1260 following a weak ADP report
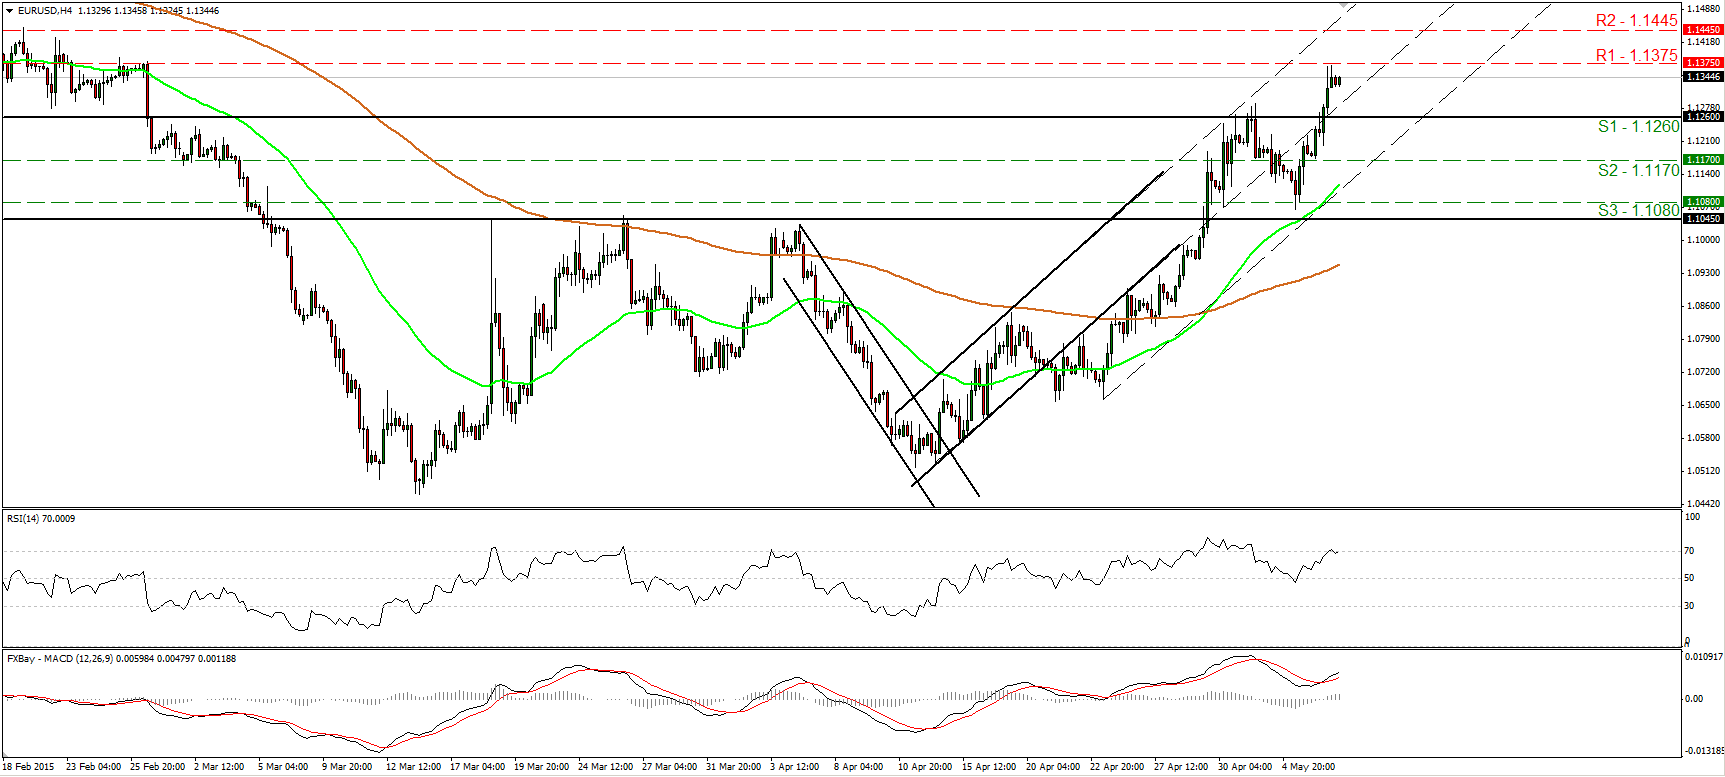
EUR/USD surged on Thursday after the US ADP report showed that the private sector gained fewer jobs than expected in April. The pair broke above the key area of 1.1260 (S1) at the release and climbed to hit resistance fractionally below the 1.1375 (R1) barrier. This confirms a forthcoming higher high on the 4-hour chart and keeps the short-term picture positive, in my view. I believe that a move above 1.1375 (R1) is likely to set the stage for extensions towards our next resistance at 1.1445 (R2), marked by the peaks of the 13th, 17th and 19th of February. Our daily oscillators detect strong upside speed and amplify the case for further advances. The 14-day RSI entered its overbought territory, while the MACD stands above both its zero and signal lines pointing north. As for the broader trend, the break above 1.1045 signaled the completion of a possible double bottom formation, something that could carry larger bullish implications.
• Support: 1.1260 (S1), 1.1170 (S2), 1.1080 (S3).
• Resistance: 1.1375 (R1), 1.1445 (R2), 1.1500 (R3).
GBP/USD higher ahead of the UK general elections
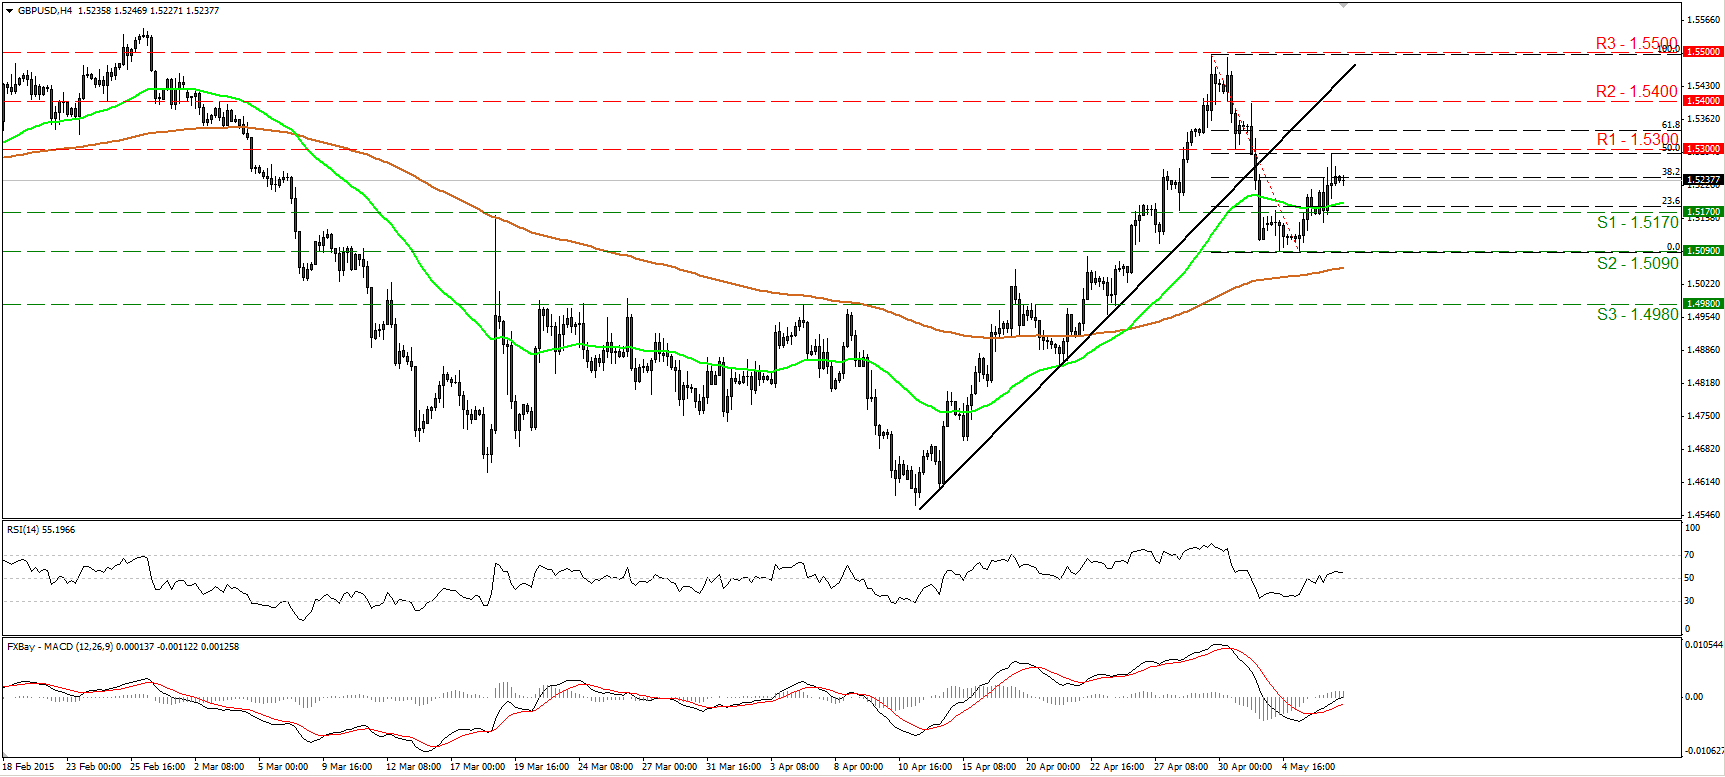
GBP/USD continued to trade higher on Thursday, but the advance was halted at the 50% retracement level of the 29th of April – 5th of May decline, fractionally below the 1.5300 (R1) resistance line. However, I still believe that the short-term outlook is negative and that this is only a pause before the bears seize control again. In my view, the near-term picture has turned negative after the violation of the uptrend line taken from the low of the 14th of April. A break below the support line of 1.5170 (S1) is likely to support the case and perhaps open the way for another test at the 1.5090 (S2) obstacle. On the daily chart, the rate is back below the 80-day exponential moving average, but since the possibility for a higher low still exists, I will adopt a flat stance as far as the overall outlook of Cable is concerned.
• Support: 1.5170 (S1), 1.5090 (S2), 1.4980 (S3).
• Resistance: 1.5300 (R1), 1.5400 (R2), 1.5500 (R3).
AUD/USD continues higher
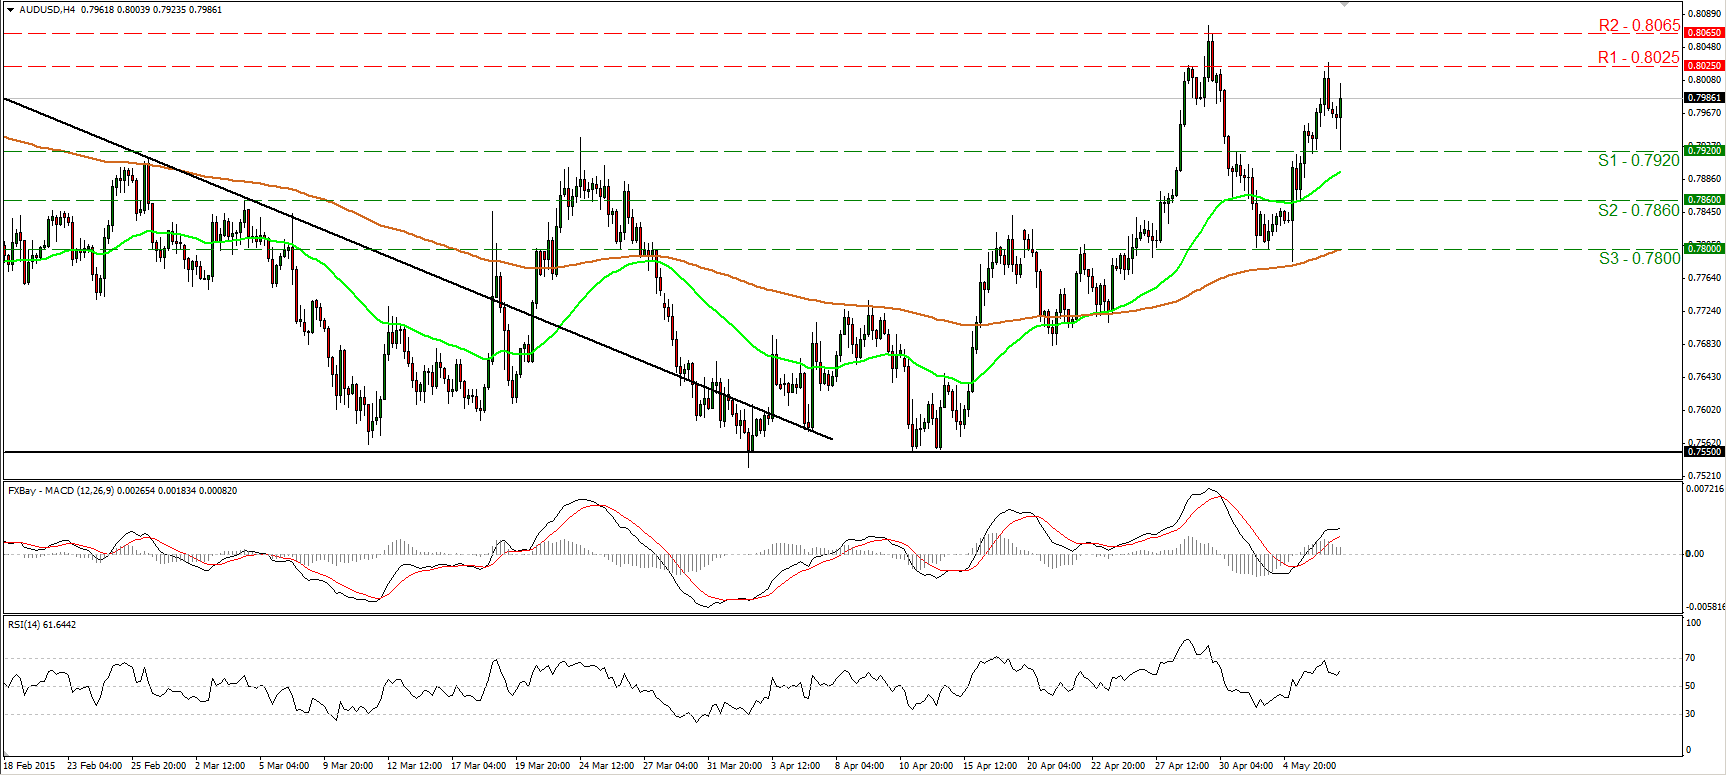
AUD/USD continued to trade higher, but yesterday hit resistance near 0.8025 (R1) and pulled back. Subsequently, the rate tested the 0.7920 (S1) line as a support this time and rebounded. I still see a somewhat positive near-term picture and therefore I would expect a move above 0.8025 (R1) to challenge again the 0.8065 (R2) territory. Our oscillators corroborate my view. The RSI, already above its 50 line, has turned up, while the MACD stays above both its zero and signal lines. In the bigger picture, the rebound from around 0.7800 (S3) confirmed a higher low on the daily chart, and this keeps the medium term picture positive as well.
• Support: 0.7920 (S1), 0.7860 (S2), 0.7800 (S3)
• Resistance: 0.8025 (R1), 0.8065 (R2), 0.8135 (R3)
Gold tumbles back towards 1186
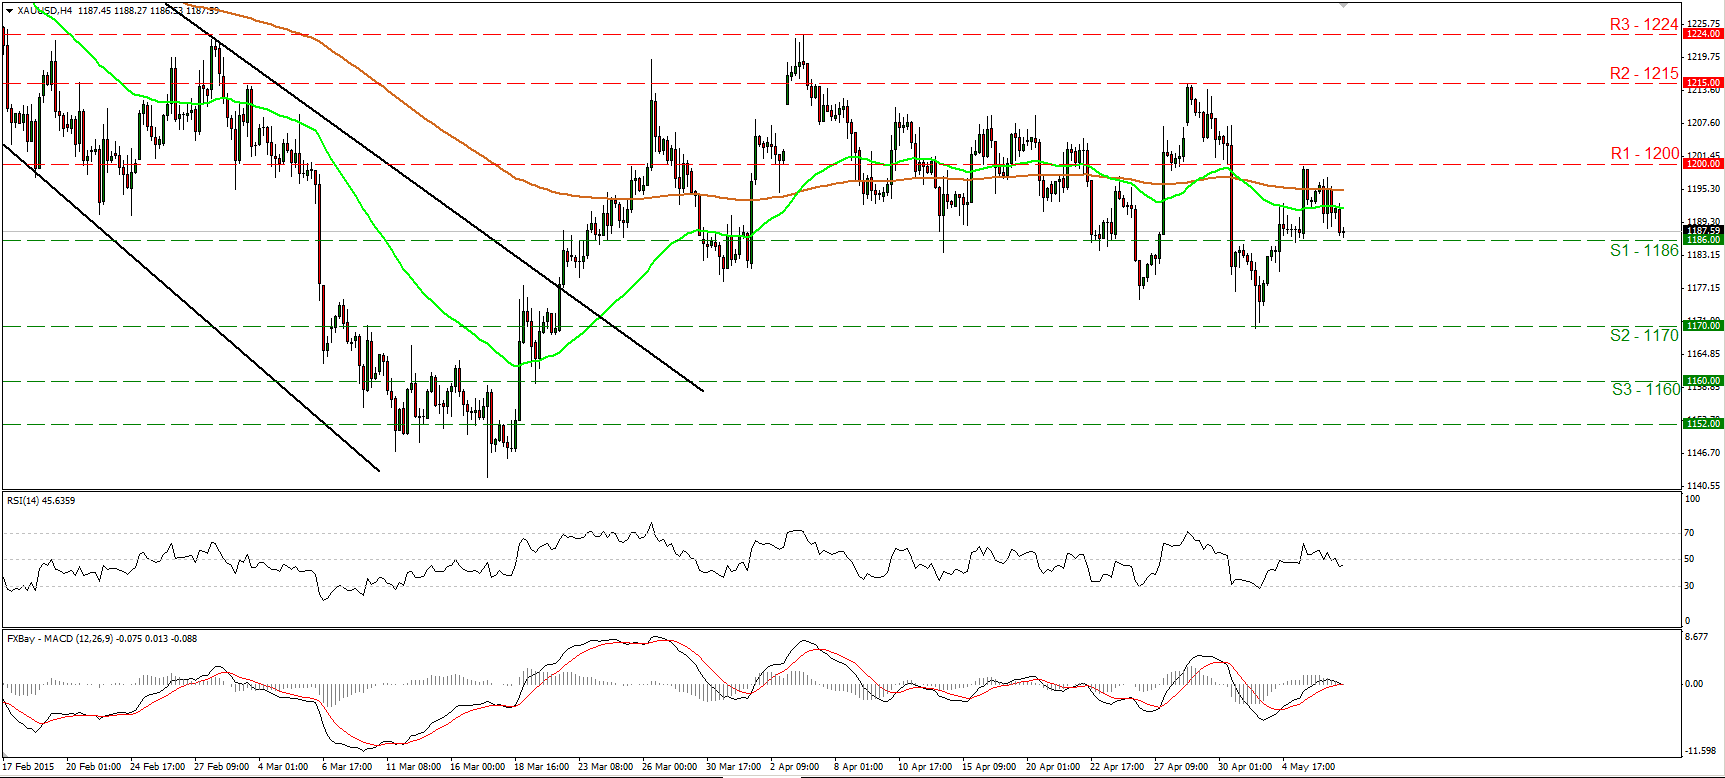
Gold traded lower after hitting resistance at the psychological area of 1200 (R1). The decline was halted marginally above the support barrier of 1186 (S1), where a clear break is likely to pave the way for our next support at 1170 (S2). Our momentum studies support the notion. The RSI has turned down and fell again below 50, while the MACD has topped slightly above its zero line, obtained a negative sign and fell below its trigger line. Although the decline may continue, with no clear trending structure on the 4-hour chart, I maintain my view that the outlook is neutral. On the daily chart, both our short-term oscillators gyrate around their equilibrium lines, confirming the trendless short-term picture.
• Support: 1186 (S1), 1170 (S2), 1160 (S3).
• Resistance: 1200 (R1), 1215 (R2), 1224 (R3).
WTI hits resistance at 62.55 and tumbles
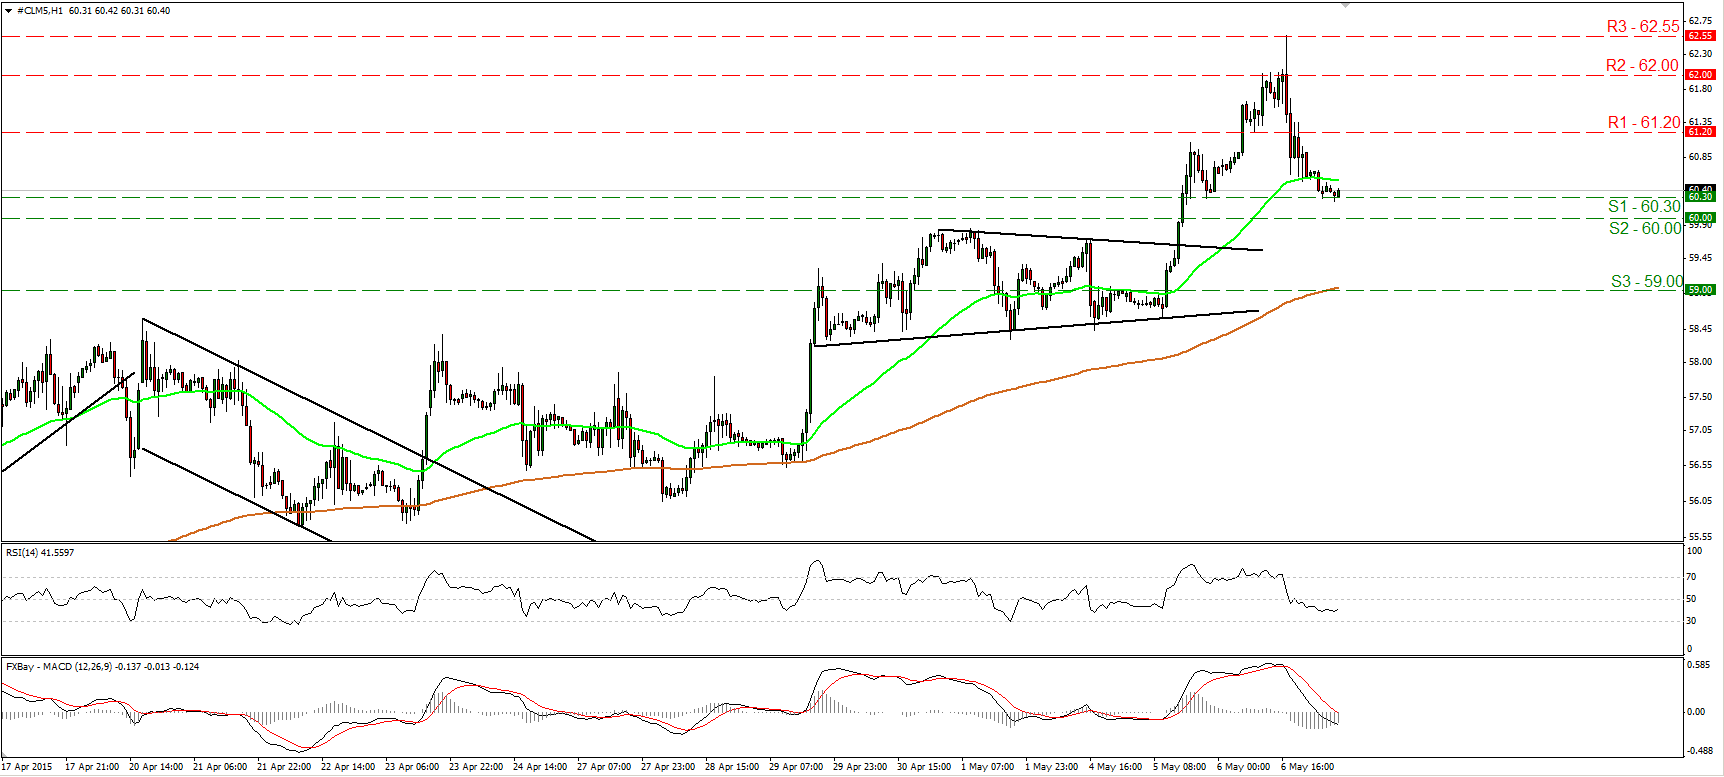
WTI continued to trade higher on Thursday, but after hitting resistance at 62.55 (R3), it fell sharply to settle slightly above 60.30 (S1). Despite the sharp decline, I believe that the short-term picture remains positive and there is a likelihood that we see the forthcoming wave to be positive. Our short-term oscillators leave the door open for the occurrence of the aforementioned scenario. The RSI, although below 50, has bottomed and could cross again above 50 soon, while the MACD shows signs that it could start bottoming. On the daily chart, I still see a positive medium term outlook. The break above 55.00 on the 14th of April signalled the completion of a double bottom formation, something that could carry larger bullish implications in the not-too-distant future.
• Support: 60.30 (S1), 60.00 (S2), 59.00 (S3).
• Resistance: 61.20 (R1) 62.00 (R2), 62.55 (R3).

