Poor US GDP figures followed by mixed FOMC = weaker USD for now
The market will now pay more attention to the Atlanta Fed! The market consensus forecast for Q1 GDP was +1.0% qoq SAAR, with estimates ranging from flat to +1.5%. Meanwhile the Atlanta Fed was forecasting +0.1%. In the event it came in at +0.2%, lower than all but four out of 76 economists had estimated. Even that meagre growth was because of a larger-than-expected rise from inventories, which makes a correction in Q2 a risk. Weather and the port strikes were temporary drags on growth but that appeared to be only a small part of the story.
The FOMC statement did not try to put a good face on the news. It said that “economic growth slowed during the winter months, in part reflecting transitory factors.” This was nowhere near as optimistic as the statement it made last April, when it said that ”growth in economic activity has picked up recently, after having slowed sharply during the winter in part because of adverse weather conditions.” It noted several ways in which indicators have not picked up: “the pace of job gains moderated” “underutilization of labor resources was little changed;” household spending growth “declined” even though real incomes rose strongly; business investment “softened;” etc. The description of inflation was also a bit more dovish; the Committee said inflation was running below target only “partly” instead of “largely” because of “earlier declines in energy prices.” It added “decreasing prices of non-energy imports” to the causes, which probably refers to the impact of the strong dollar on the price of imported goods.
Nonetheless, most of the changes were in the first paragraph, which described the existing state of affairs. The remainder of the statement, which describes the FOMC’s expectations and intentions, was virtually unchanged. Moreover, the March statement noted that a rise in rates was “unlikely” in April, but this statement gave no time-dependent guidance on rates whatsoever. This is the first time in years that there has been no such calendar-based guidance. From now on, the market will have to figure out meeting-by-meeting whether the FOMC “has seen further improvement in the labor market and is reasonably confident that inflation will move back to its 2 percent objective over the medium term.” In theory this leaves them the option of raising rates as early as June if the data warrant such a move, although that seems unlikely. As a result, Fed funds rate expectations actually rose after the statement, with the implied interest rate on the March 2018 contract gaining 4 bps. I expect that after the initial action has faded, the reaction will set in as people realize that the FOMC is still determined to hike rates – it is just thinking of when, not whether. Accordingly the monetary divergence that has been driving the FX market is still in place and USD should resume its rally.
BoJ stands pat even while downgrading outlook
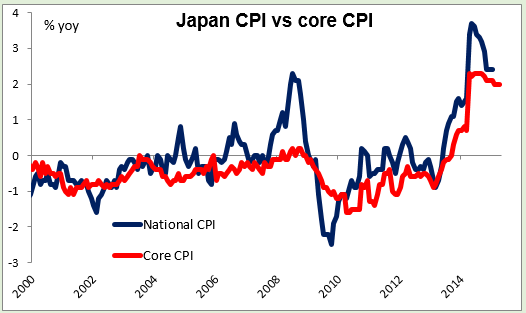
The Bank of Japan made no changes in its QE program despite downgrading its inflation forecast. It now sees inflation reaching the 2% target “around the first half of fiscal 2016, assuming that crude oil prices will rise moderately from the recent level.” Previously, it had forecast reaching its target “in or around fiscal 2015.” (The Japanese fiscal year begins in April, so FY2015 is April 2015-March 2016 and FY2016 is April 2016-March 2017.) By blaming low inflation on oil, the BoJ can try to escape responsibility despite the fact that core inflation, which excludes food and energy, is also running at around zero after taking the hike in the consumption tax into account. In any event, as I said yesterday, I would expect them to wait to take any more action at least until July, when the results of this year’s wage negotiation should be known and the MPC members update their forecasts again. October, when the next official outlook report comes out, is the favored month for the market.
RBNZ turns dovish Meanwhile, the Reserve Bank of New Zealand (RBNZ), the first developed-nation central bank to hike rates in this cycle, turned dovish. It dropped the previous month’s line about “a period of stability in the OCR” and “future interest rate adjustments, either up or down…” Instead, it said only that “(i)t would be appropriate to lower the OCR if demand weakens, and wage and price-setting outcomes settle at levels lower than is consistent with the inflation target.” In other words, no more mention of the conditions for raising rates, only dropping them. As usual, the RBNZ also repeated its displeasure with the value of the NZD. To add to the negative background for the currency, Fonterra cut its forecast milk payout for the current season because of oversupply.
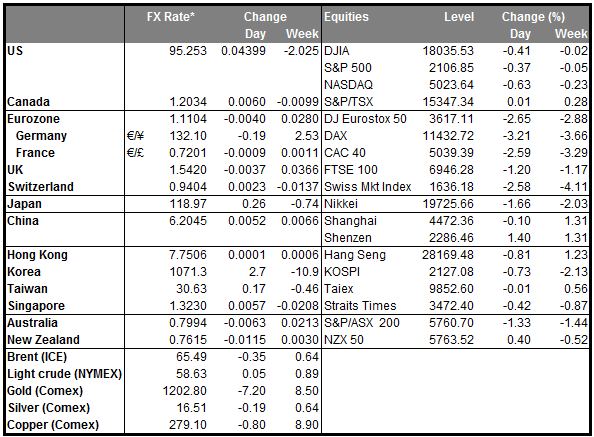
NZD weakened considerably -- it was the only G10 currency to fall against the dollar over the last 24 hours. The decline seems to have momentum and I would expect to see NZD continue to weaken. However, over the medium term there is no indication that the NZ economy will fulfil the conditions that RBNZ set out for easing policy further. On the contrary, most indicators remain robust. So I do not think the weaker trend will continue indefinitely. I would watch the technicals for the appropriate time to put on short AUD/NZD positions again.
Greece update: According to the Greek press, a reinforced Greek team is to resume negotiations with the country’s creditors in Brussels today. There are said to be some new proposals from the Greek side that may include changes to Greece’s public sector and tax administration but not to pensions and the labor market, which are key areas of disagreement. A Greek government official reportedly indicated that the government’s “red lines” would remain in place. That implies no agreement. The drive to disaster continues.
Today’s highlights: During the European day, eurozone’s flash CPI for April and unemployment rate for March are coming out. The rise of the German inflation rate on Wednesday increased the likelihood that the bloc could jump from its deflationary territory. This could prove EUR-supportive. However, following the introduction of the QE program by the ECB, the impact of the CPI on EUR is not as great as it used to. Thus the reaction in the markets could be limited. German retail sales for March (a disappointing -2.3% mom) and unemployment rate for April are also due out.
In Norway, AKU unemployment rate for February is expected to increase a bit. The official unemployment rate for the same month had declined somewhat, so we could see a positive surprise in the AKU unemployment figure. This could strengthen NOK.
From Canada, the monthly GDP rate for February is expected to decline, at the same pace as in the previous month. This is expected to cause the annual growth rate to decelerate and could prove CAD-negative.
In the US, we get the personal income and personal spending for March. Personal income is expected decelerate a bit, while personal spending is anticipated to accelerate from the previous month. The nation’s yoy rate of the PCE deflator and core PCE are also coming out. The nation’s yoy rate of the PCE deflator is expected to rise a bit, while the core PCE rate is forecast to remain unchanged.
The employment cost index (ECI) for Q1, a closely followed gauge that reflects how much firms and government pay their employees in wages and benefits, is expected to accelerate a bit from Q4. This could add to Fed officials’ view that the labor market continues to improve and they are on their way to fulfilling their mandate. The risk for this indicator seems to be on the upside, because of year-over-year base effects. The BLS earlier this week put out its annual revision of data going back five years, incorporating updated seasonal factors ( http://www.bls.gov/ncs/ect/sp/ecisf5yr.pdf ). The revisions still show low figures for Q1 2014. Given the uncertainty about the underlying trend in what is a rather erratic series, there could be a significant surprise in the figure. A solid increase in the ECI would tend to make Fed officials feel more confident about their inflation forecast. In any event, Chair Yellen has said that rising wage and price inflation is not a precondition for liftoff.
Initial jobless claims and the Chicago Purchasing managers’ index for April are also coming.
As for the speakers, Fed Governor Daniel Tarullo speaks.
The Market
EUR/USD surges above 1.1045
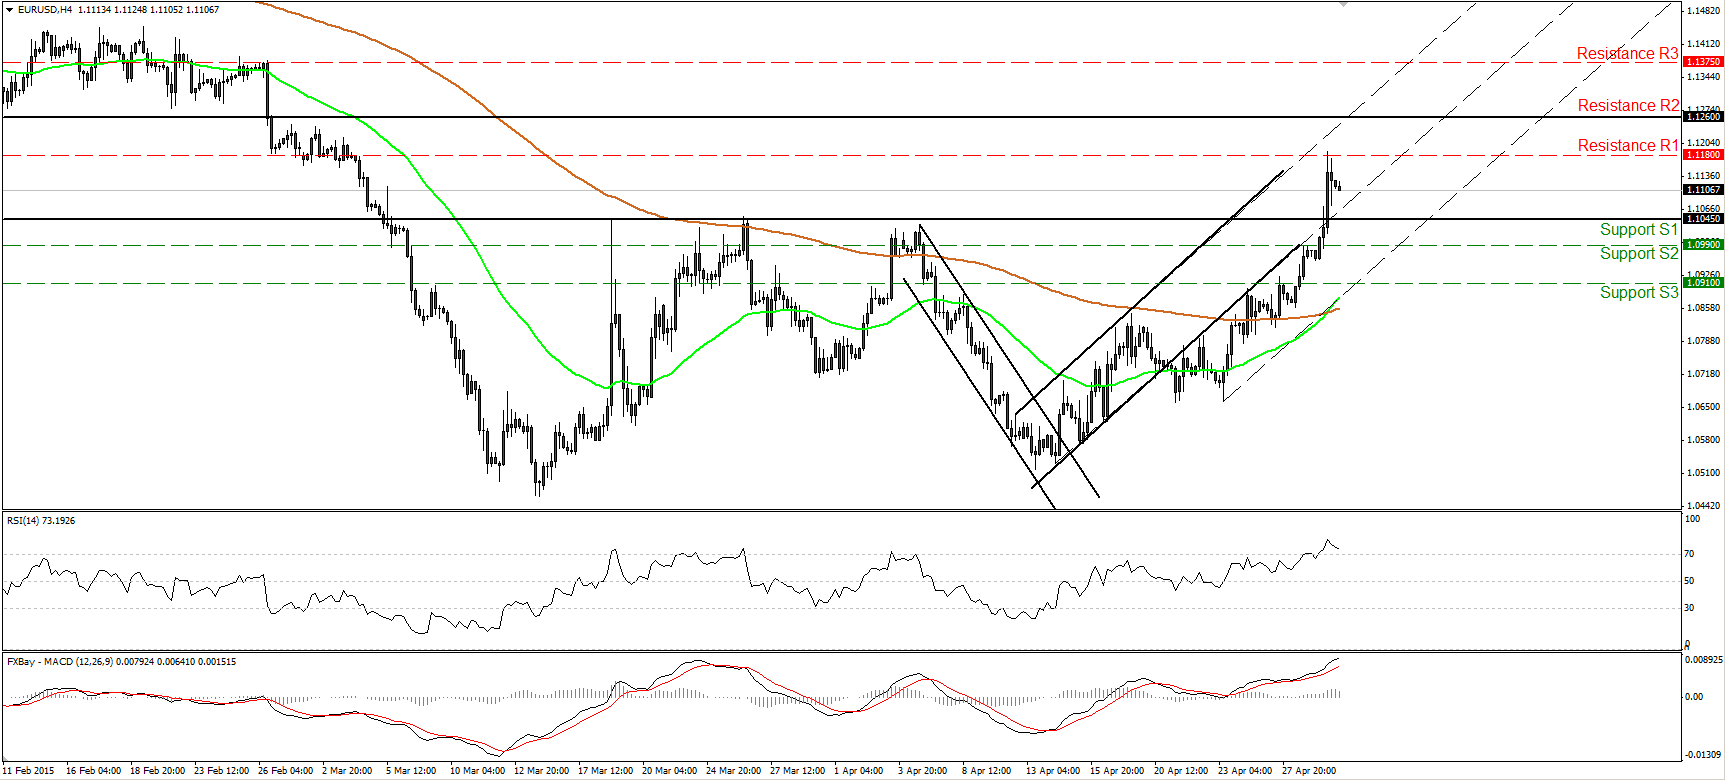
EUR/USD surged on Wednesday following the surprising weak US Q1 GDP report. The rate broke above the key resistance (now turned into support) line of 1.1045 (S1) and hit resistance near 1.1180 (R1). Subsequently the rate retreated somewhat. The near-term bias stays positive, in my view. I believe that a clear move above 1.1180 (R1) is likely to set the stage for extensions towards the next critical resistance line of 1.1260 (R2). Nevertheless, bearing in mind that the RSI has topped within its overbought territory, I would stay cautious that further pullback may be looming before the bulls pull the trigger again. On the daily chart, the break above 1.1045 (S1) signaled the completion of a possible double bottom formation, something that could carry larger bullish extensions.
• Support: 1.1045 (S1), 1.0990 (S2), 1.0910 (S3).
• Resistance: 1.1180 (R1), 1.1260 (R2), 1.1375 (R3).
GBP/USD touches 1.5500
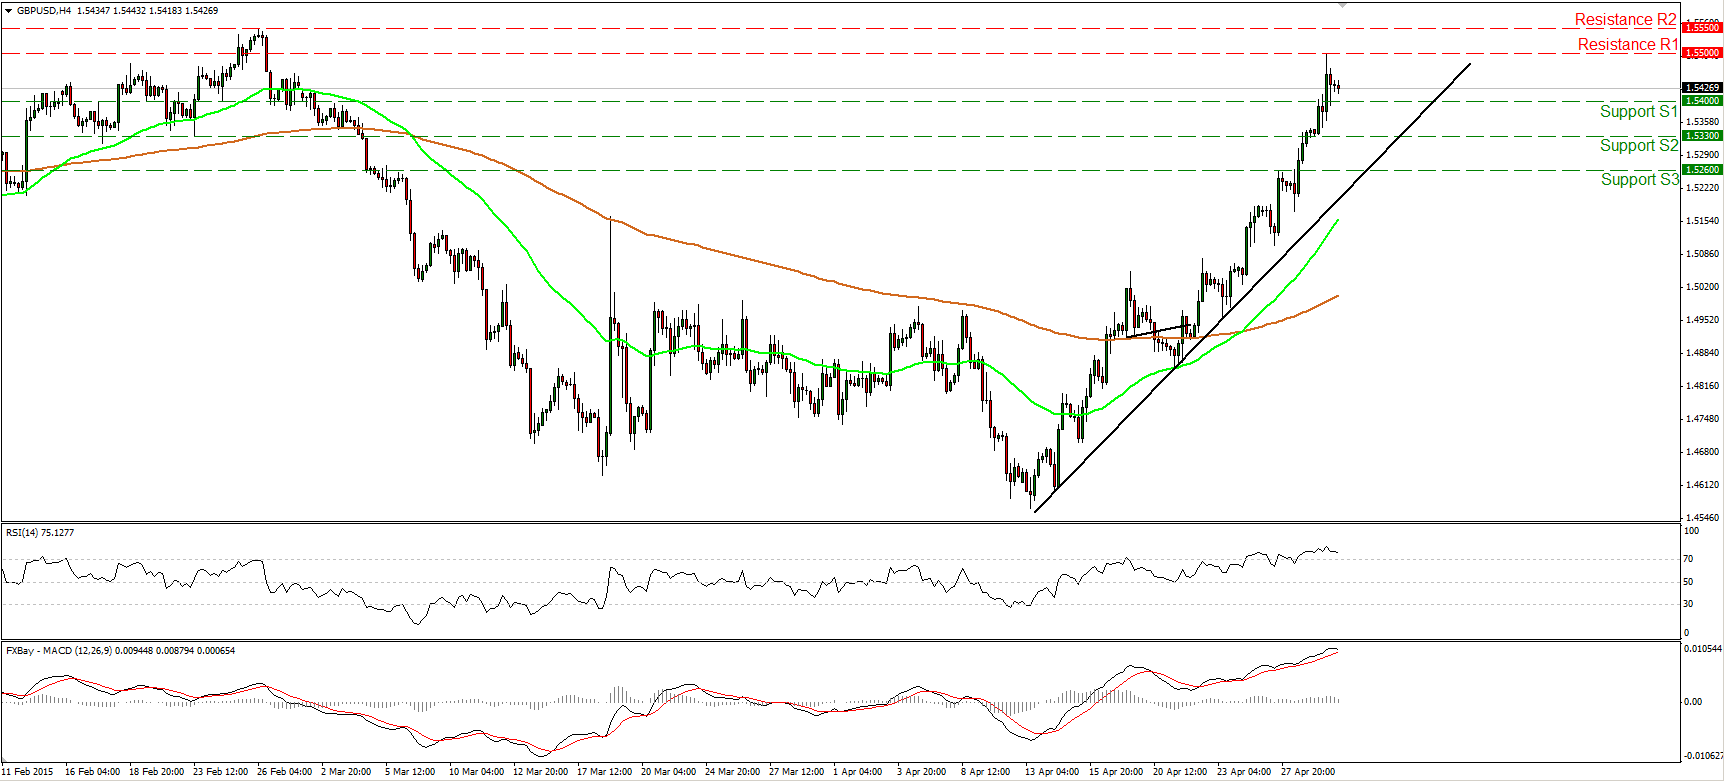
GBP/USD continued to race higher yesterday, breaking above the resistance (now turned into support) of 1.5400 (S1) and reaching the psychological line of 1.5500 (R1). The price structure on the 4-hour chart remains higher highs and higher lows above the black short-term uptrend line. As a result I believe that the short-term bias is to the upside. A clear break above the key line of 1.5500 (R1) is likely to challenge the next resistance at 1.5550 (R3). A move above that line is likely to open the way for the 1.5620 (R3) obstacle. However, taking a look at our short-term oscillators, I would be careful of a possible pullback before the bulls prevail again. The RSI shows signs that it could exit its overbought territory in the near future, while the MACD has topped and could move below its trigger soon. On the daily chart, Cable is trading well above the 80-day exponential moving average, and this prints a positive medium term picture, in my view.
• Support: 1.5400 (S1), 1.5330 (S2), 1.5260 (S3).
• Resistance: 1.5500 (R1), 1.5550 (R2), 1.5620 (R3).
USD/CAD triggers some buy orders slightly below 1.2000
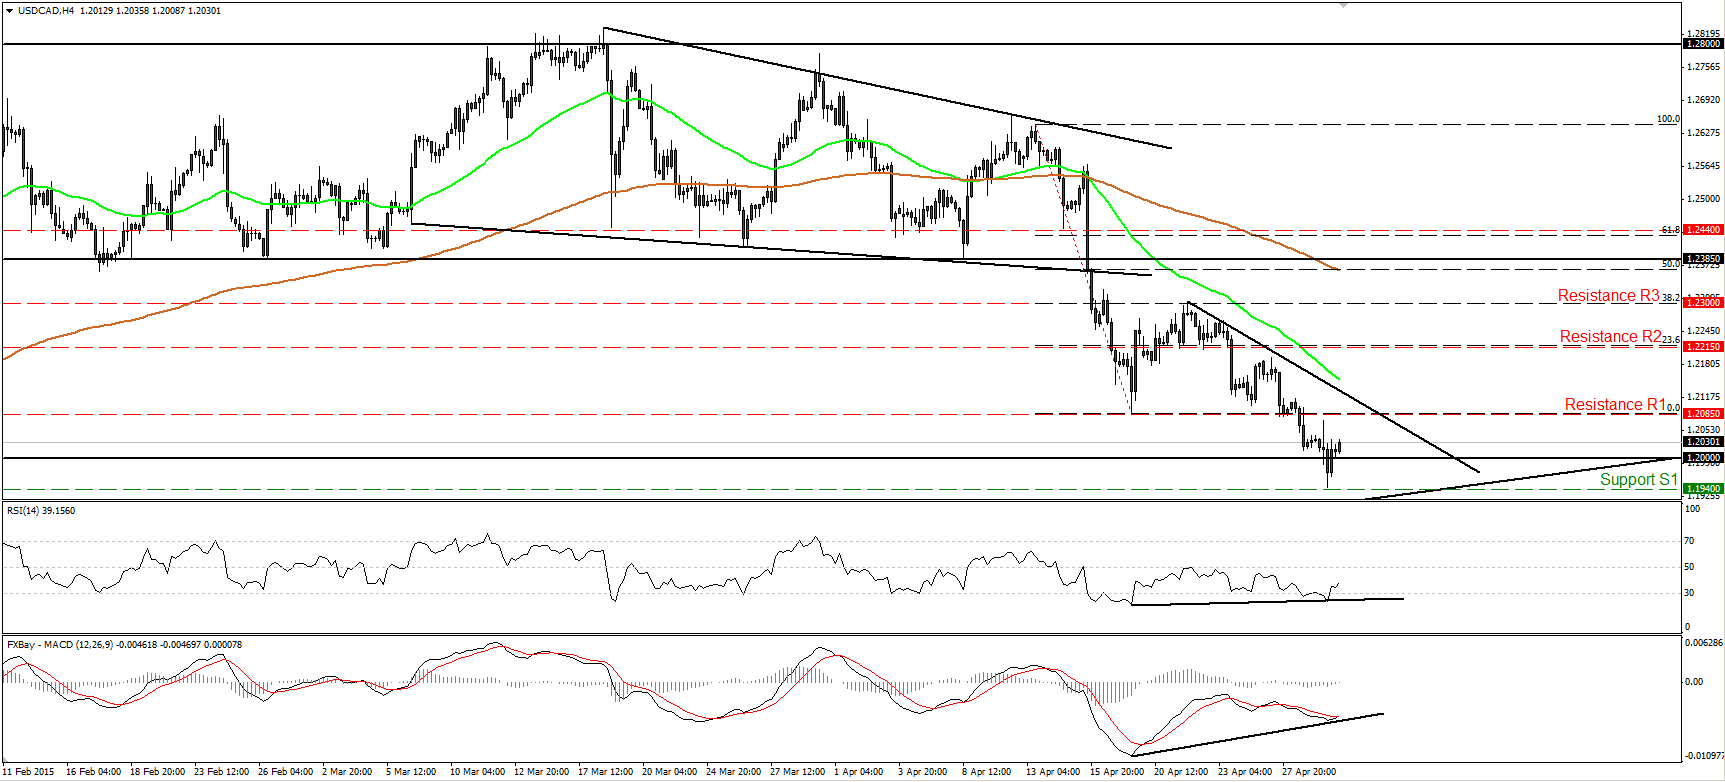
USD/CAD continued to trade lower, breached the psychological line of 1.2000 (S1), but triggered some buy orders below that key line. Although the short-term outlook still seems somewhat negative, I would expect the forthcoming wave to be positive. This is because I see positive divergence between both our short-term oscillators and the price action. Also, the RSI exited its oversold territory and is pointing somewhat up, while the MACD has bottomed and appears ready to move above its trigger line soon. What is more, on the daily chart, the rate is trading near the longer-term uptrend line taken from back the 11th of July. In my opinion, a daily close below that uptrend line is needed to make me confident that further declines are on the cards. Furthermore, the 1.2000 (S1) psychological zone happens to be the 38.2% retracement level of the 38.2% retracement level of the July – March longer-term uptrend, and also the 200% extension level of the height of the trading range USD/CAD had been trading from the 22nd of January until the 15th of April.
• Support: 1.2000 (S1), 1.1940 (S2), 1.1800 (S3).
• Resistance: 1.2085 (R1), 1.2215 (R2), 1.2300 (R3).
Gold pulls back
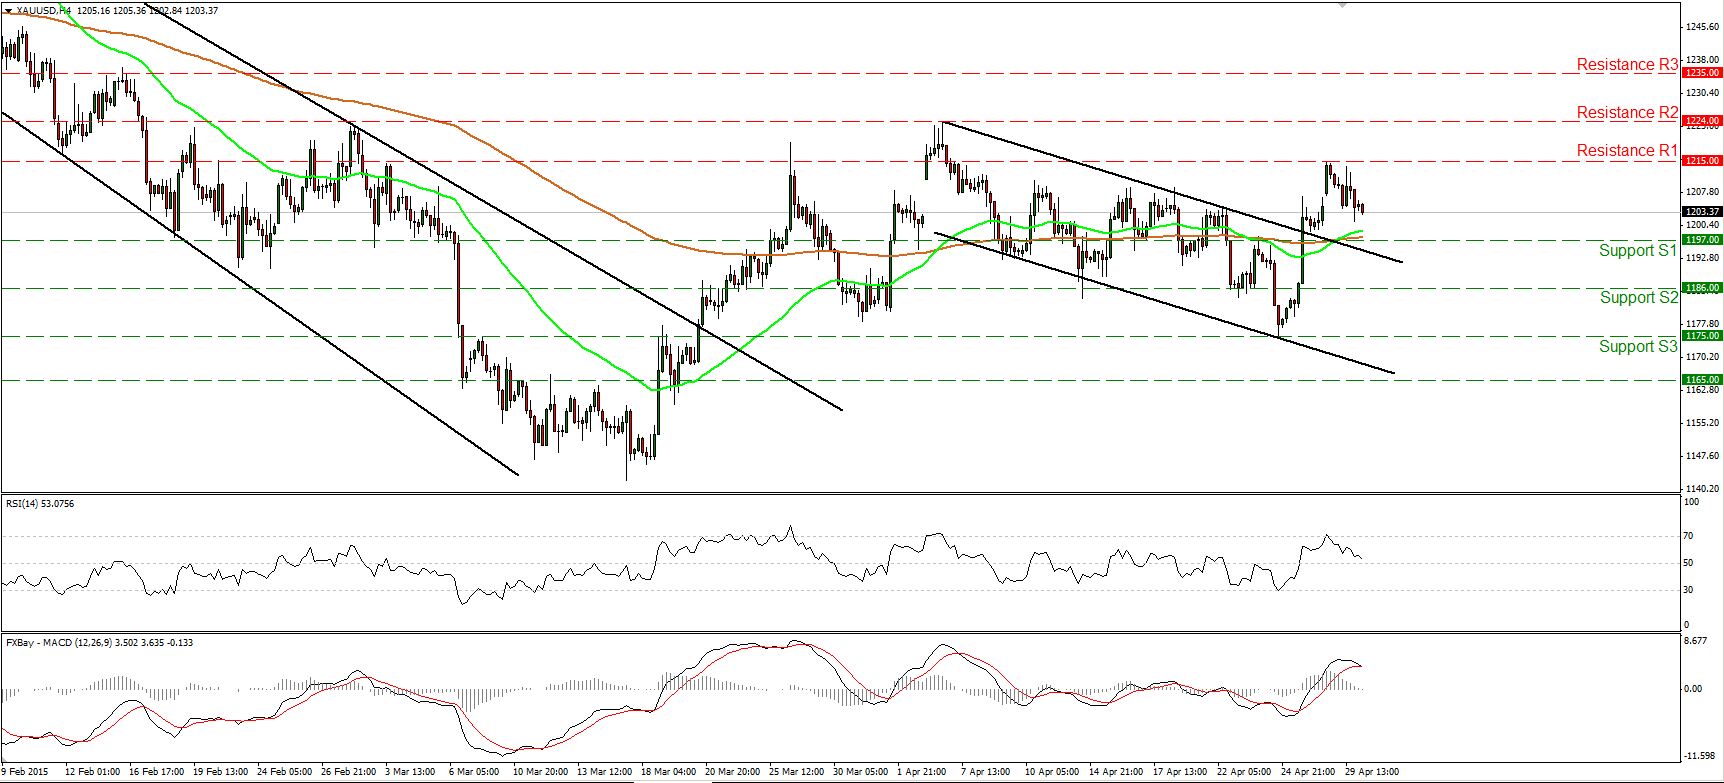
Gold pulled back after hitting resistance at 1215 (R1). Nevertheless, the metal is still trading above the upper bound of the near-term downside channel, thus the picture stays somewhat positive. A clear break above 1215 (R1) could probably set the stage for extensions towards the next resistance at 1224 (R2), defined by the peak of the 6th of April. The RSI continue to decline after hitting resistance at its 70 line, while the MACD has topped and fallen below its signal line. These momentum signs make me believe that the pullback may continue a bit more, perhaps to test the 1197 (S1) line as a support this time. As for the bigger picture, this Monday’s and Tuesday’s rallies bring into question my view that the metal is likely to trade lower in the not-too-distant future. As a result, I would take to the sidelines as far as the overall picture is concerned. A clear close above 1224 (R2) could signal the completion of an inverted head and shoulders formation and perhaps carry larger bullish implications.
• Support: 1197 (S1), 1186 (S2), 1175 (S3).
• Resistance: 1215 (R1), 1224 (R2), 1235 (R3).
WTI climbs and hits 59.30
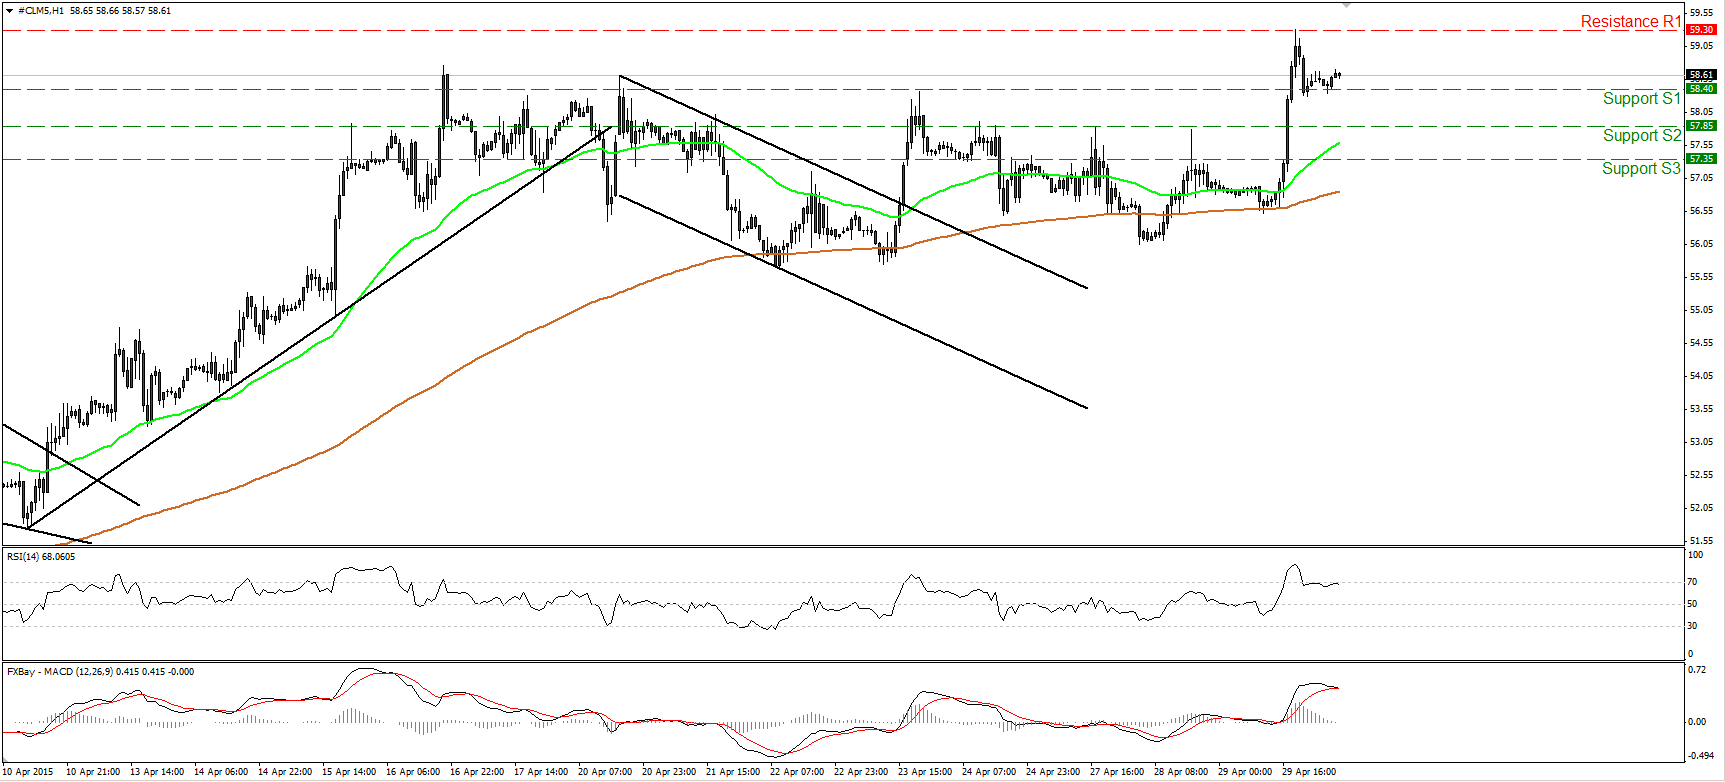
WTI rallied on Wednesday breaking three resistance lines in a row, to eventually stop around 59.30 (R1) before sliding to sit at the support of 58.40 (S1). Yesterday’s move shifted the bias back to the upside, thus I would expect the bulls to take advantage of the pullback and shoot for the psychological zone of 60.00 (R2). Nevertheless, our hourly momentum studies show signs of weakness, and therefore the pullback may continue for a while before the next leg up. The 14-hour RSI exited its overbought territory and stood slightly below its 70 line, while the hourly MACD has topped and could fall below its trigger any time soon. On the daily chart, I still see a positive medium term outlook. The break above 55.00 on the 14th of April signalled the completion of a double bottom formation, something that could carry larger bullish implications in the not-too-distant future.
• Support: 58.40 (S1), 57.85 (S2), 57.35 (S3).
• Resistance: 59.30 (R1) 60.00 (R2), 60.50 (R3).

