Dallas Fed survey disappoints
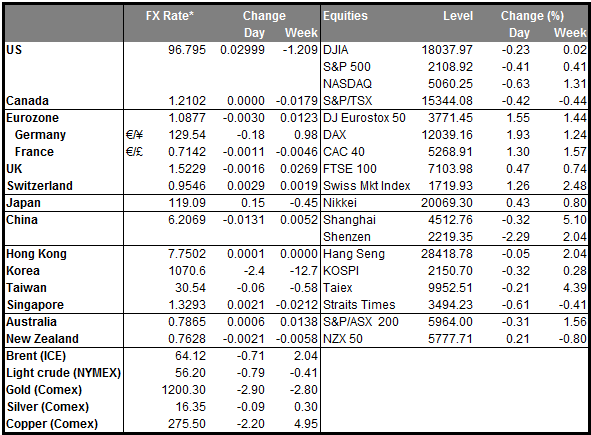
Those who were hoping for signs of recovery in the US were disappointed yesterday when the Dallas Fed survey for April just barely rose. Given the recovery in oil prices over the last month, people were hoping for more. Furthermore, the Markit service sector PMI disappointed and the composite PMI fell too, albeit both remain solidly in expansionary territory. Nonetheless those who believe in a robust US economy are going more on faith than on facts nowadays. As a result the dollar slipped against most currencies, particularly the EM currencies as commodities jumped (see China section below). Oddly enough Fed funds futures rate expectations edged a bp or so higher anyway, limiting the damage to USD. Wednesday’s Q1 GDP figure and FOMC meeting will decide the debate over growth and the dollar’s direction, at least for the short term.
Varoufakis sidelined
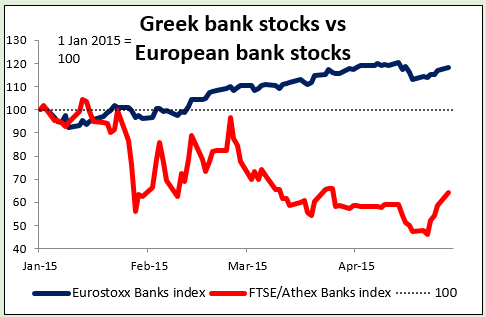
The Greek government Monday changed the team negotiating with the country’s international creditors, after Finance Minister Varoufakis was called a “time-waster, a gambler and an amateur” by his EU peers on Friday. The administration has created a new “political negotiation team” that is to be “coordinated” by Alternate Foreign Minister Euclid Tsakalotos under Varoufakis’s leadership. The move was widely seen as an attempt to sideline Varoufakis, although of course the administration denied this and insisted that Varoufakis would remain in command. There were several other new teams and new leaders put in charge of various parts of the negotiations. It’s not clear what the impact will be, but relations between Greece and its creditors can hardly get worse. Apparently some people in Greece think they’re likely to improve as Greek bank stocks were up 9.3% yesterday. I would say the change is mildly EUR-positive, but it remains to be seen whether any group of people can reach agreement in time. Watch tomorrow’s ECB meeting to see what they decide about the haircut on collateral they require in exchange for ELA funds. That will reveal the official reaction.
Chinese QE on the way?
Reuters reported yesterday that the Chinese government would soon initiate a round of “Chinese Quantitative Easing” with the People’s Bank of China (PBOC), the central bank, directly purchasing assets from commercial banks so as to support the upcoming CNY 1tn ($160bn) “local government debt swap program.” In fact this has nothing to do with QE except insofar as the central bank is buying assets from the private sector. QE is a monetary policy measure that central banks resort to when interest rates are down to zero and further easing of nominal rates is difficult. In China, the official policy rate (1-year benchmark lending rate) is 5.35%, quite high when compared with the CPI inflation rate of 1.4%, and the reserve requirement ratio (RRR) is 18.5% -- signifying pretty tight monetary conditions. If they wanted to loosen monetary policy further, they would be moving those rates, not buying bonds. In this instance, the PBOC is simply acting as lender-of-last-resort for local governments that are struggling to find new buyers under a new debt-swap regime that was initiated earlier this year to reform regional finances.
So while this is not stimulus at all, that didn’t stop investors from getting excited. Commodity prices soared on the initial news yesterday, although they later came back to reality. Copper and oil ended slightly lower, while precious metals held more of their gains. Further easing in China would tend to support the commodity currencies, particularly AUD. Nonetheless, I doubt if the authorities will ease enough to boost growth (as opposed to cushioning the decline) so I don’t think policy measures will change the long-term trend.
GBP gains as Conservatives gain
Sterling continued to rise as polls showed the Conservatives gaining at the expense of the UK Independence Party (UKIP). I think this is a kneejerk reaction to the idea that right-wing is good for the economy, left-wing is bad. The past performance of the pound after elections has shown that this is not true at all as concerns the FX market. This time is likely to be no exception, in my view. The Conservatives probably wouldn’t raise taxes for wealthy people who don’t live in Britain all the time, but they would hold a referendum on whether to stay in the EU, and I think that would be a much bigger risk for GBP.
FOMC meeting: what to expect
As we said yesterday, the big event of the week is Wednesday’s Federal Open Market Committee (FOMC) meeting. The Committee last month said it was “unlikely” to raise rates in April, and there is no press conference scheduled or new forecasts, so all we will have to go on will be the accompanying statement. The main question will be whether they think the current stream of sluggish data is simply a temporary “soft patch,” like in early 2014, or whether they think the US economy is undergoing a more significant downturn. This question will probably be answered in the first paragraph, which usually describes how the Fed sees the economy developing. So far most of the comments I’ve heard from members are that they do indeed think the sluggish data recently are due to the bad weather and port strike so I would expect to see comments about how the slowdown is likely to prove transitory. The second main point will be whether they see March’s smaller increase in nonfarm payrolls as an anomaly or a change in the trend. The stunning recovery in jobs and fall in the unemployment rate has allowed many members to feel they are near to meeting at least half of their dual mandate, so any comments about the labor market will be significant. Ditto for inflation, of course, the other half of the mandate. The key will be the sentence “the Committee expects inflation to rise gradually toward 2 percent over the medium term as the labor market improves further and the transitory effects of energy price declines and other factors dissipate.” Do they still see the labor market improving, and do they still believe the factors depressing inflation are transitory? Any change there would probably mean a significant delay in hiking rates. In fact since the March meeting, the outlook for US inflation has improved considerably: the US trade-weighted index against major currencies is down 2.4%, oil prices are up 16%, and the 5year breakeven inflation rate has risen to 1.71% from 1.33%. As for the international situation, that was discussed at some length in the press conference in March but received only cursory attention in the statement. I would not expect it to play a major part this time, either. If anything, the Eurozone is in better shape than in March, so the international background is more supportive of US growth than it was before.
How to play the FOMC
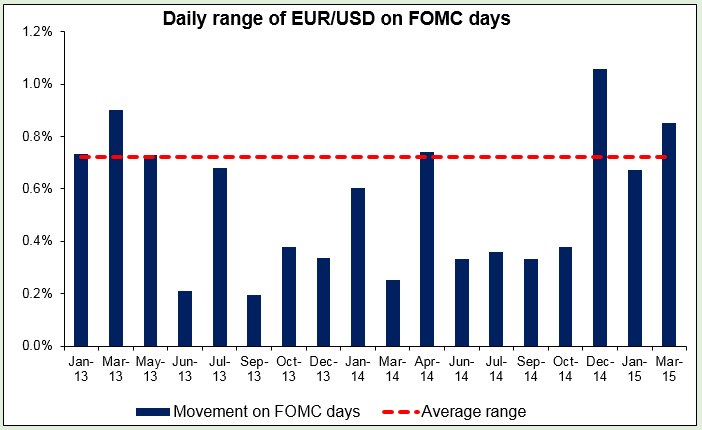
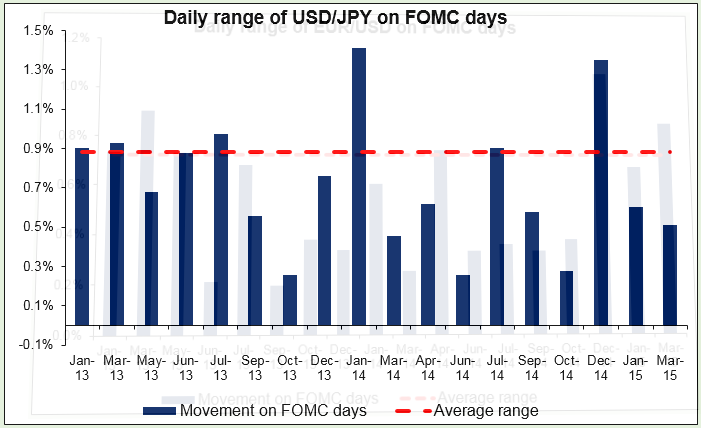
Although the FOMC meetings are closely watched, in fact the Committee is quite good at telegraphing its moves and therefore we don’t necessarily get a lot of volatility on the day. Meetings over the last year or so have often seen below-average volatility in both EUR/USD and USD/JPY. This time especially, the statement is unlikely to contain any major surprises. Like in the UK, there may be more action when the minutes are released on 21 May and the details of the discussions are known.
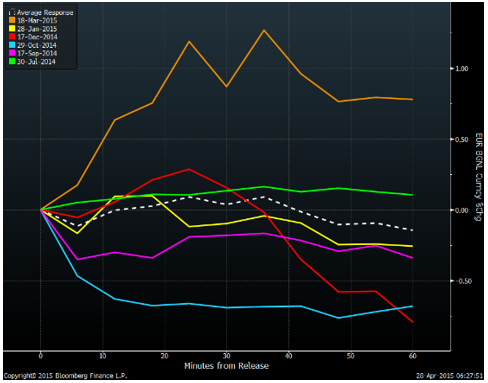
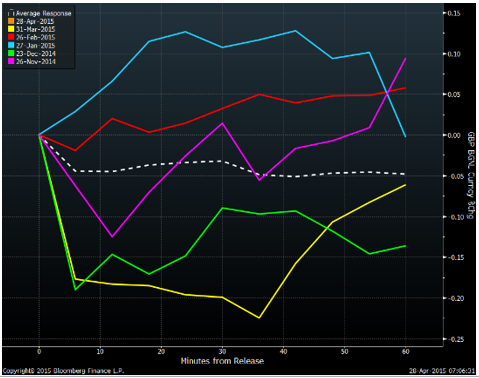
The graph below from Bloomberg shows the movement of EUR/USD in the hour following the release for the last six meetings. The dotted line, which is the average, demonstrates that on average, nothing happens. But as you can see from the March meeting (the orange line), when they removed the “patient” phrase, and the October meeting (the light blue line), when they ended QE, there can be considerable volatility on the day.
Today’s highlights:
During the European day, the main event will be the UK’s 1st estimate of Q1 GDP. The forecast is for the growth rate to decelerate a bit despite the strong industrial production in January and February and robust retail sales figures in Q1. A weak growth figure along with the zero inflation rate and the uncertain political outcome in the upcoming elections could result in rate hike expectations getting pushed back even further. This could put selling pressure on GBP. However, as the second reaction graph shows, this indicator has had surprisingly little impact on GBP/USD the last several times.
In France, consumer confidence index for April is coming out.
In , we get the economic tendency survey for April and retail sales for March. The first is likely to increase a bit reflecting an improved sentiment, while retail sales are expected to show another strong reading. Nevertheless, given the fact that the Riksbank is expected to cut rates at its Wednesday meeting, any setback in USD/SEK could be seen as a renewed buying opportunity.
In the US, only secondary importance data are due to be released. Conference Board leading index and Richmond Fed manufacturing activity index both for April are coming out. S & P/Case-Shiller house price index for February is also due out.
As for the speakers, Bank of Canada Governor Stephen Poloz and ECB Governing Council member Jens Weidmann speak.
The Market
EUR/USD continues a bit higher
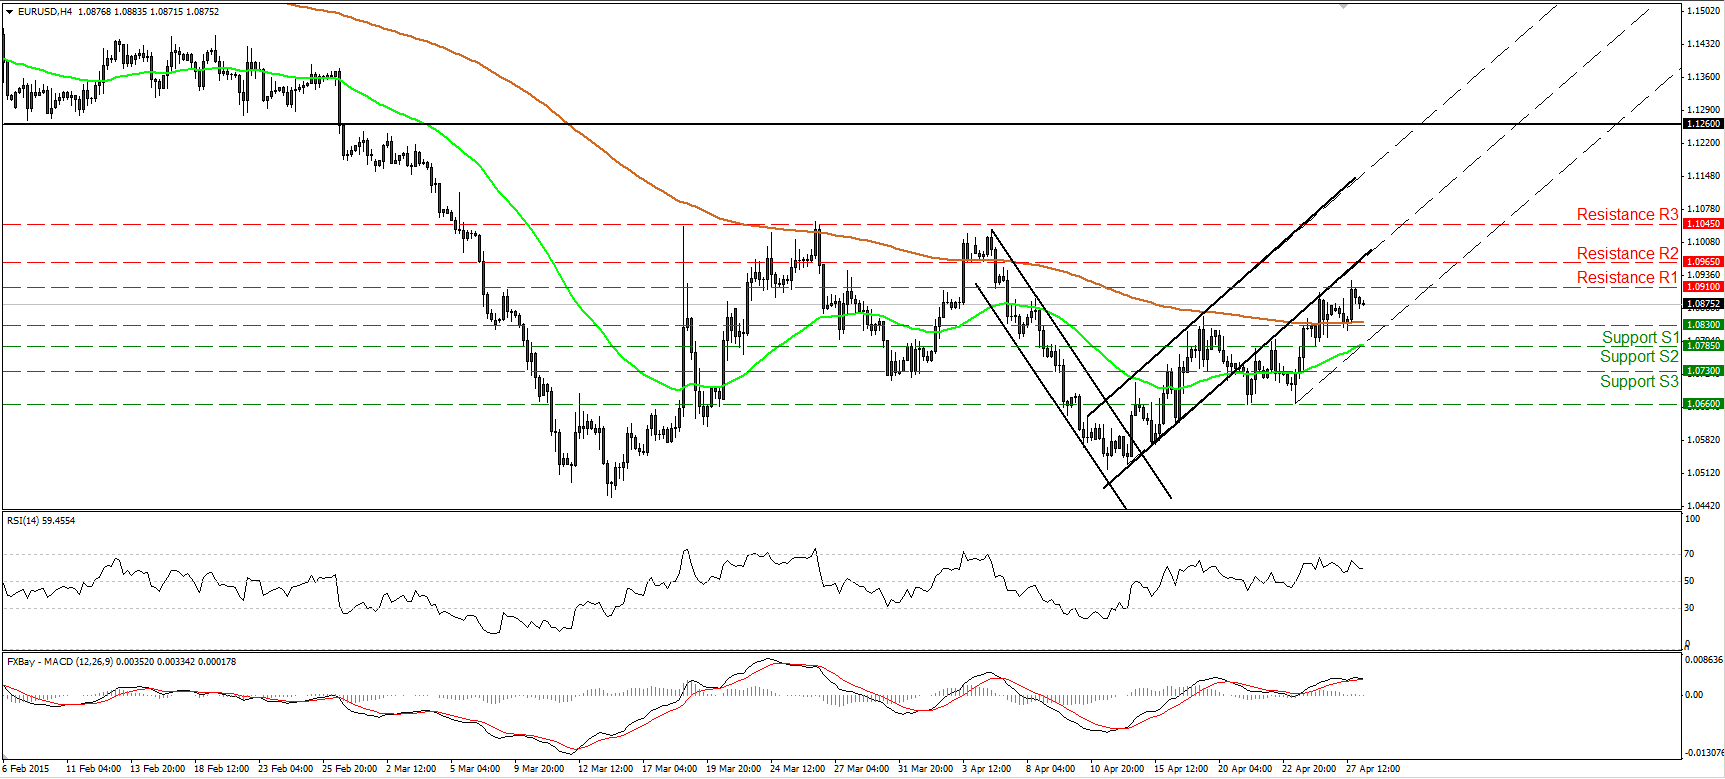
EUR/USD continued to trade higher, but hit resistance at 1.0910 (R1). The near-term bias stays positive in my view, therefore I still expect the bulls to target the 1.0965 (R2) line in the near future. Nevertheless, our short-term oscillators still give evidence that a minor pullback could be in the works. The RSI turned down after hitting resistance near its 70 line, while the MACD has topped and could cross below its trigger line soon. In the bigger picture, EUR/USD is still trading below both the 50- and the 200-day moving averages. However, a clear close below 1.0460 is needed to confirm a forthcoming lower low and trigger the resumption of the larger downtrend. On the other hand, a close above 1.1045 (R3) could signal the completion of a double bottom and perhaps set the stage for larger bullish extensions.
• Support: 1.0830 (S1), 1.0785 (S2), 1.0730 (S3).
• Resistance: 1.0910 (R1), 1.0965 (R2), 1.1045 (R3).
NZD/USD hits resistance at 0.7660
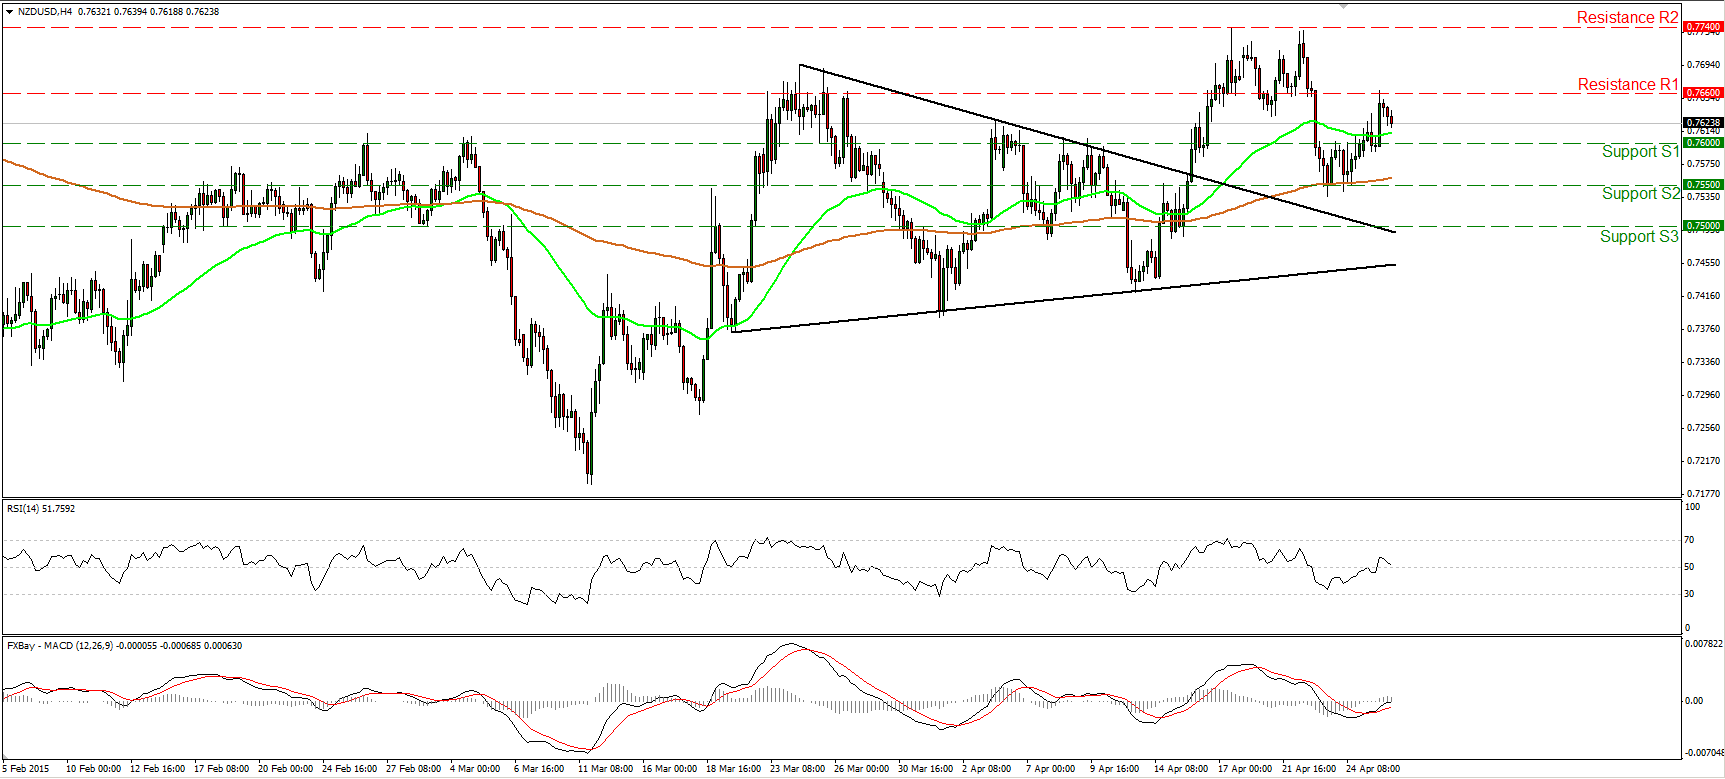
NZD/USD traded higher on Monday, but hit resistance near 0.7660 (R1) and retreated somewhat. Taking into account that on the 15th of April, the rate exited a possible triangle formation, and that the rate is still trading above the upper line of that pattern, I would consider the short-term bias to be positive. A clear move above the 0.7660 (R1) zone is likely to set the stage for the key resistance line of 0.7740 (R2), defined by the peaks of the 17th and 22nd of April. Nevertheless, if we look at our short-term oscillators, I see signs of a possible corrective move before the next leg up. The RSI turned down and could move below 50 soon, while the MACD, already negative, shows signs that it could top and fall below its signal line. On the daily chart, a close above 0.7740 (R2) could confirm a forthcoming higher high and perhaps turn the medium term picture positive.
• Support: 0.7600 (S1), 0.7550 (S2), 0.7500 (S3).
• Resistance: 0.7660 (R1), 0.7740 (R2), 0.7785 (R3).
EUR/GBP hits resistance at 0.7170 and slides
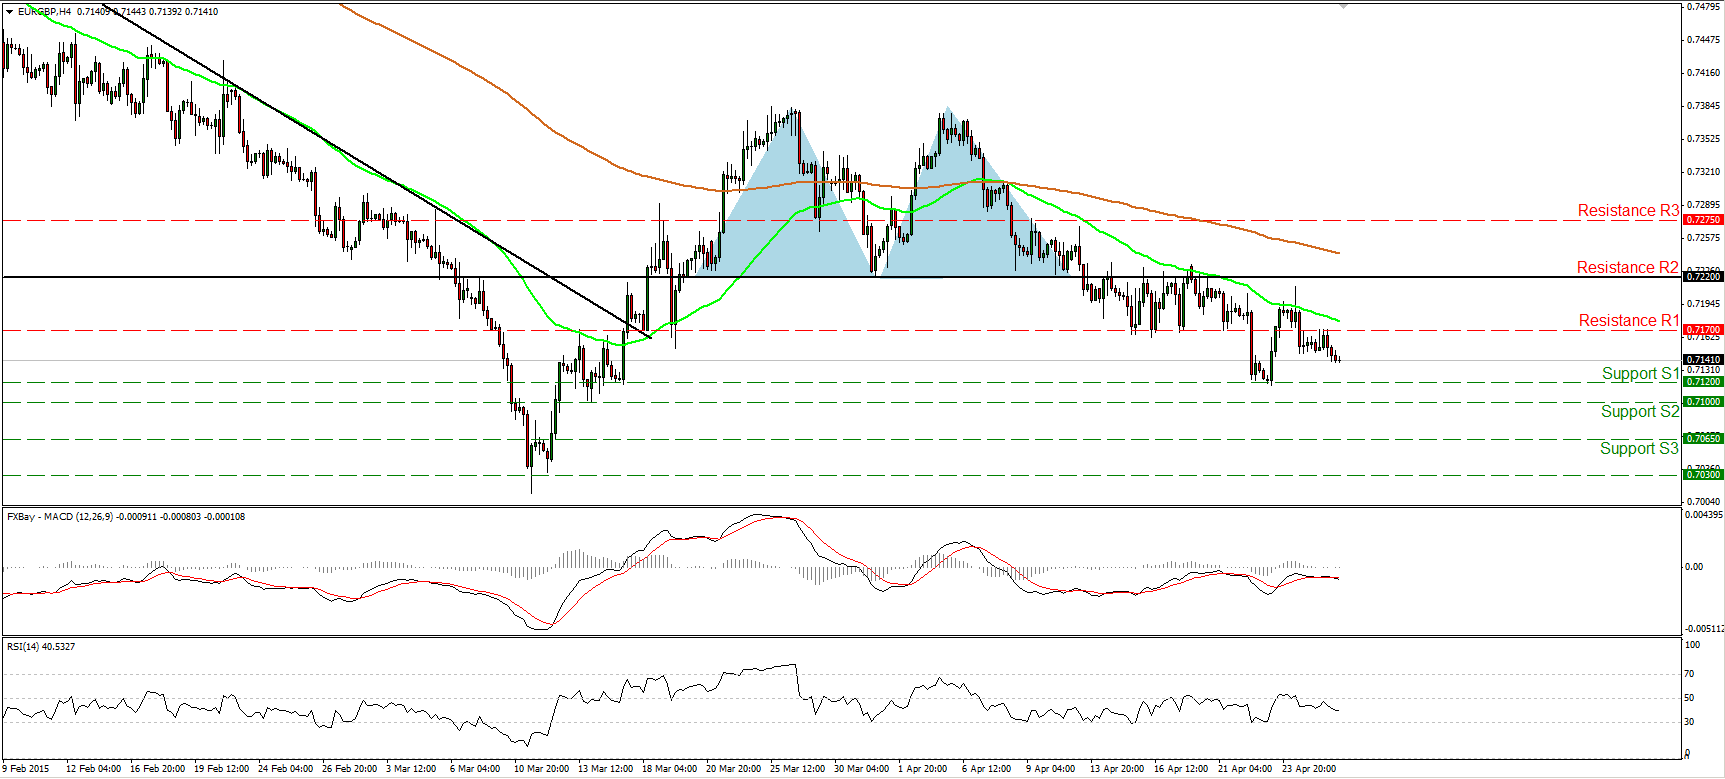
EUR/GBP traded lower on Monday after hitting resistance at 0.7170 (R1). I still expect the rate to trade lower and challenge the support barrier of 0.7100 (S2). After the completion of a double top formation back on the 13th of April, the picture has turned negative in my view. Our short-term oscillators support the short-term picture. The RSI moved lower after hitting resistance near its 50 line, while the MACD, already negative, has fallen below its trigger line. However, today, the 1st estimate of the UK GDP for Q1 is expected to show a slowdown. This could trigger an upside corrective move before the bears take control again. On the daily chart, the completion of the double top confirms that the 11th of March – 3rd of April recovery was just a 38.2% retracement of the 16th December – 11th of March decline, and that the overall downtrend is gaining momentum again.
• Support: 0.7120 (S1), 0.7100 (S2), 0.7065 (S3).
• Resistance: 0.7170 (R1), 0.7220 (R2), 0.7275 (R3).
Gold rallies towards 1200
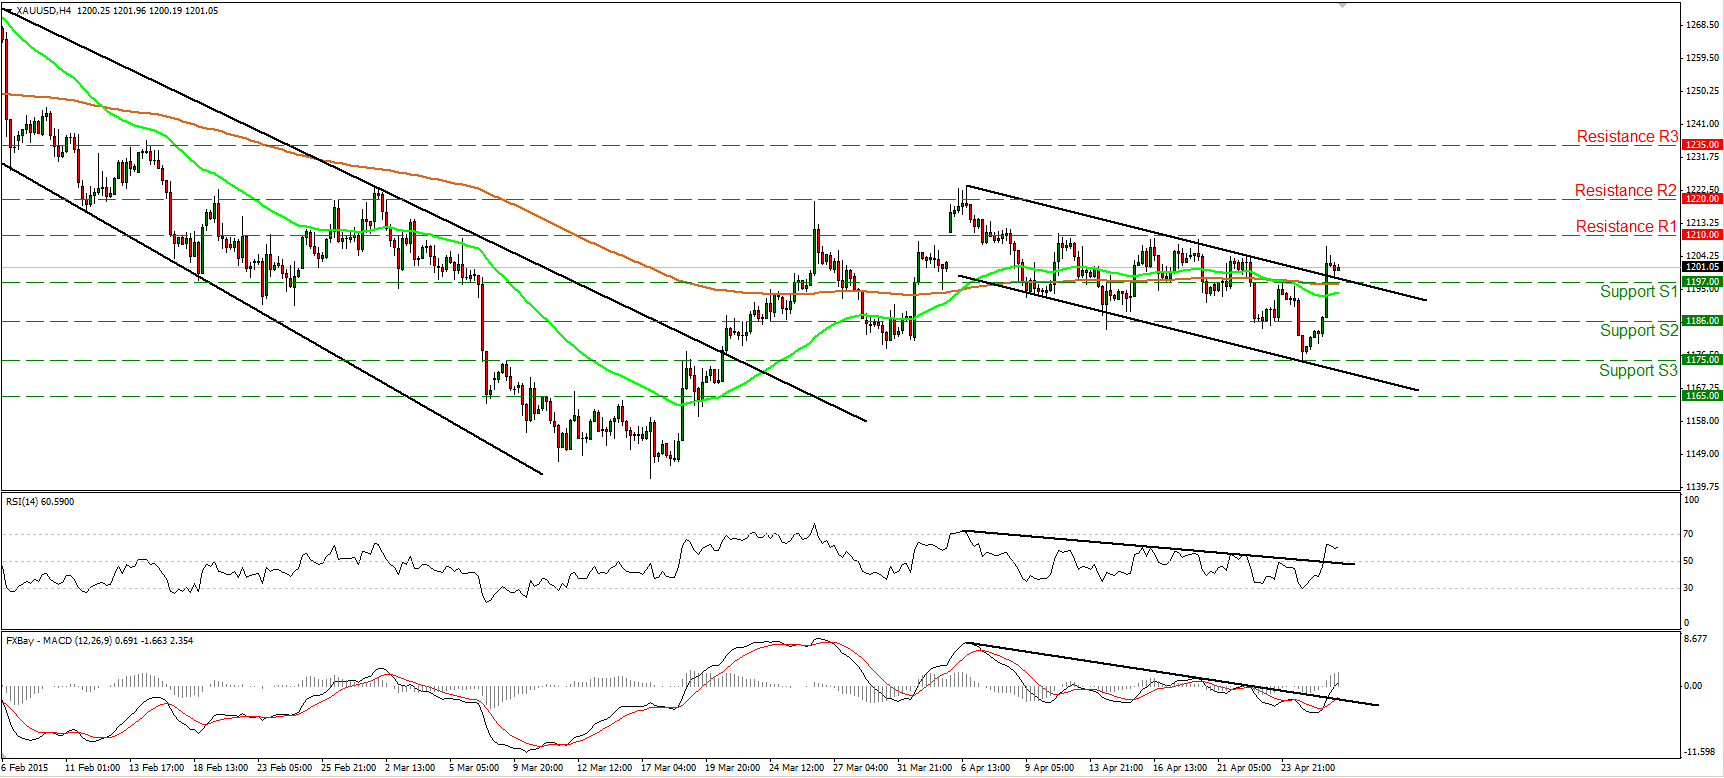
Gold shot up yesterday, breaking above the resistance (now turned into support) of 1197 (S1) and the upper bound of a near-term upside channel. This shifts the short-term picture somewhat positive, and makes me believe that we are likely to experience a test of 1210 (R1) soon. A break above there could extend the bullish wave, perhaps towards the next resistance at 1220 (R2). Both of our short-term oscillators have crossed above their respective upside resistance lines, supporting the idea that further upside could be on the cards. What is more, the RSI edged higher after crossing above its 50 line, while the MACD, already above its trigger, just obtained a positive sign. As for the bigger picture, yesterday’s rally brings into question my view that we could see the metal trading lower in the not-too-distant future. As a result, I would take to the sidelines as far as the overall picture is concerned.
• Support: 1197 (S1), 1186 (S2), 1175 (S3).
• Resistance: 1210 (R1), 1220 (R2), 1235 (R3).
WTI breaks below 56.55
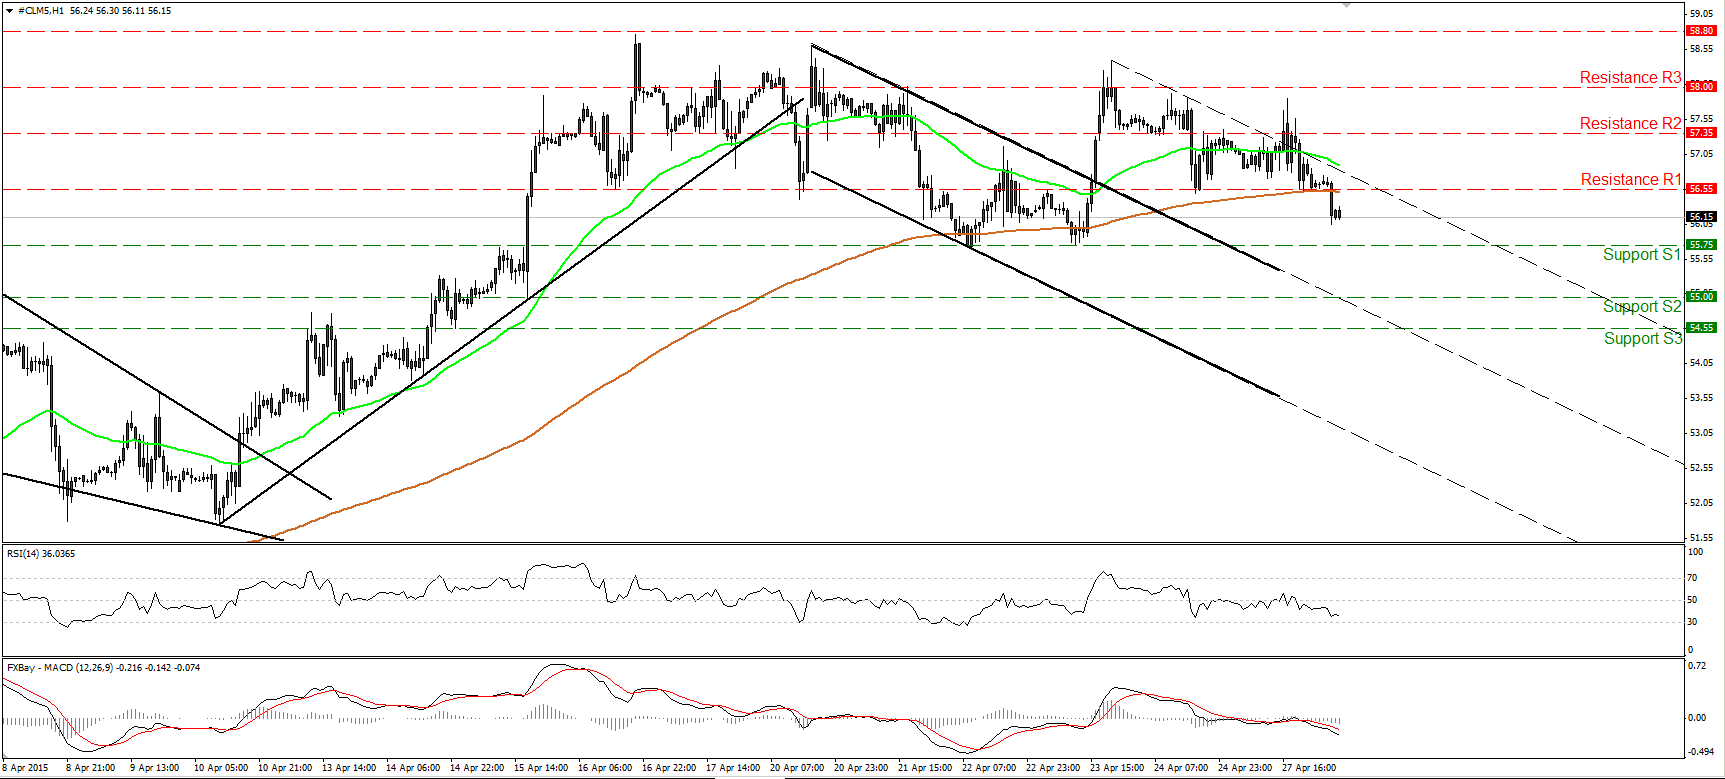
WTI tumbled on Monday, breaking below the support (now turned into resistance) barrier of 56.55 (R1). Given that this confirmed a forthcoming lower low on the 1-hour chart, I would hold the view that the short-term bias is negative. I would expect WTI to continue lower and to challenge the support line of 55.75 (S1). If the bears are strong enough to drive the battle below that line, I would expect them to pull the trigger for the psychological zone of 55.00 (S2). Taking a look at our momentum studies, I see that the RSI continued lower and is now approaching its 30 line, while the MACD stands below both its zero and signal lines. These signs corroborate my view that the decline is likely to continue. However, on the daily chart, I still see a positive medium term outlook. The break above 55.00 on the 14th of April signalled the completion of a double bottom formation, something that could carry larger bullish implications in the not-too-distant future. Therefore, I would treat any further downside extensions as a corrective move, at least for now.
• Support: 55.75 (S1), 55.00 (S2), 54.55 (S3).
• Resistance: 56.55 (R1) 57.35 (R2), 58.00 (R3).

