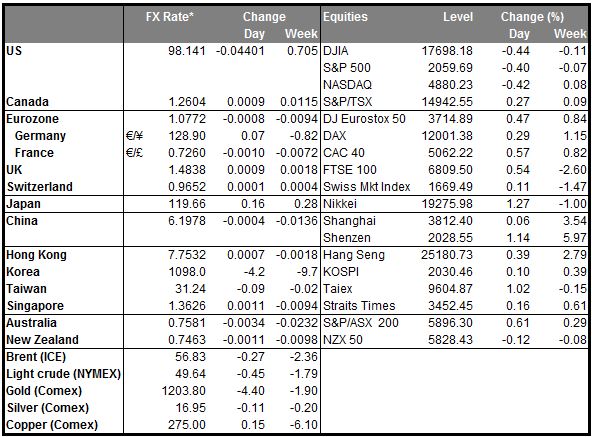
USD mixed despite weaker than expected data
The US data yesterday was weak, no doubt about it --- the ADP employment report missed expectations and came in below 200k, while the ISM manufacturing PMI fell 1.4 points to a two-year low after a 6-point drop in the past four months. Benchmark Treasury yields ended down 2- bps while Fed funds futures pricing continued moving more dovish, with greater downside risks to Friday’s employment report now seen.
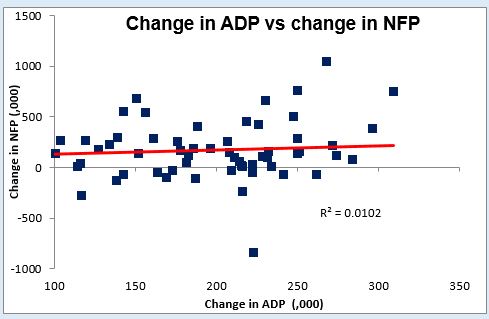
Nonetheless please note that a weak ADP report does not guarantee a weak employment report; the average absolute difference between the release ADP number and the NFP is 68k. Moreover, the errors are random: they are equally distributed between being higher than and lower than the NFP print. So it would be quite normal for the below-expectations ADP report to coincide with an above-expectations NFP report. The ADP report may be the best predictor we have of the NFP, but that doesn’t mean it’s a good predictor. On the other hand, the very strong run of job gains seen in recent months, averaging 322k over the last four months, is looking increasingly disconnected from many other indications of slower economic growth. Thus it would be reasonable to see some payback in the March report, too.
Against this background, the dollar’s performance was actually quite impressive. It’s opening unchanged to higher against most of the G10 currencies this morning, although lower against the bulk of the EM currencies that we track. The steady performance vs the G10 shows that the end-period buying we saw earlier this week was not just a seasonal pattern.
The big losers were SEK, which has been notoriously weak recently, and AUD, which continues to fall as expectations mount for a rate cut at next week’s Reserve Bank of Australia (RBA) meeting. The market now sees an 84% probability of a cut next week, i.e. it’s almost certain. Today’s Australian data was fairly disappointing; job vacancies rose at a slower pace in February than in January and the trade deficit widened out considerably. Plus iron ore prices continue to decline.
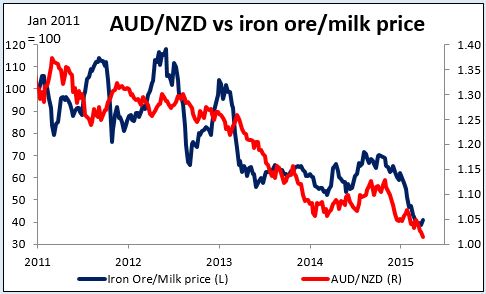
Iron ore prices have been generally falling faster than New Zealand’s milk prices since last August, leading to a lower AUD/NZD. However, milk prices lurched lower at yesterday’s auction, leading to a slight rise in the iron ore/milk price ratio. It wouldn’t be surprising if AUD/NZD moved up temporarily as a result. However, I think the market is more focused on the deteriorating outlook for iron ore than for milk exports. Plus the divergence in monetary policy between the two countries (the market sees an overwhelming 81% probability of no change at the 11 June RBNZ meeting) is supportive of NZD relative to AUD. Therefore I think any strength in the pair is likely to prove temporary. I still see AUD/NZD headed to parity.
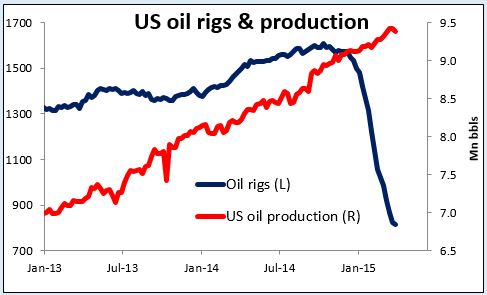
Surge in oil prices support oil currencies The dollar did decline vs CHF, CAD and NOK. The latter two were no doubt bolstered by the surge in oil prices on news that US oil output declined in the latest reporting week, the first fall since January. That probably caused some short-covering in this shortened trading week. The number of oil rigs in the US has fallen almost in half since the recent peak in early October. It may be that the drop in oil rigs is finally starting to offset the increase in production from wells that are still pumping. However I still remain bearish on oil. The fact that US Secretary of State Kerry has remained in Lausanne for the talks with Iran even though the deadline is passed demonstrates the US determination to reach some agreement with the country. That could release up to 1mn b/d onto the market. Besides, as I mentioned last week, I expect US oil output to surge in June. Thus I remain bearish vs CAD and NOK. There is a Bank of Canada meeting on April 15th, but the market sees a 74% likelihood of no change in rates.
Today’s highlights: During the European day, the minutes of the ECB Governing Council March monetary policy meeting are released. The accounts will contain an overview of financial market, economic and monetary developments. It will be followed by a summary of the discussion, in an unattributed form, on the economic and monetary analyses and on the monetary policy stance.
In the UK, we get the construction PMI for March. The manufacturing PMI released on Wednesday, although strong, was not strong enough to counter the impact of the Q4 productivity report, which showed that labor productivity fell in Q4. However, a positive surprise in the construction PMI coming after the manufacturing PMI could perhaps overcome the impact of that report and strengthen GBP somewhat.
In the US, initial jobless claims for the week ended March 28 are coming out. Last week’s jobless claims were better than expected, confirming the strong labor market and bolstering the dollar, as “maximum employment” is one of the two key points in the Fed’s mandate. Another strong reading would be consistent with a firming labor market and could overcome any lingering fears from the weak ADP report. We will also get the revised figures for the initial jobless claims for the period from 2010-2014. Trade balance and factory orders, both for February are also due out.
As for the speakers, Fed Chair Janet Yellen and Fed Governor Lael Brainard speak. Yellen will simply be making the opening remarks at a conference on economic mobility, so I do not expect any great revelations from her.
The Market
EUR/USD trades in a consolidative manner
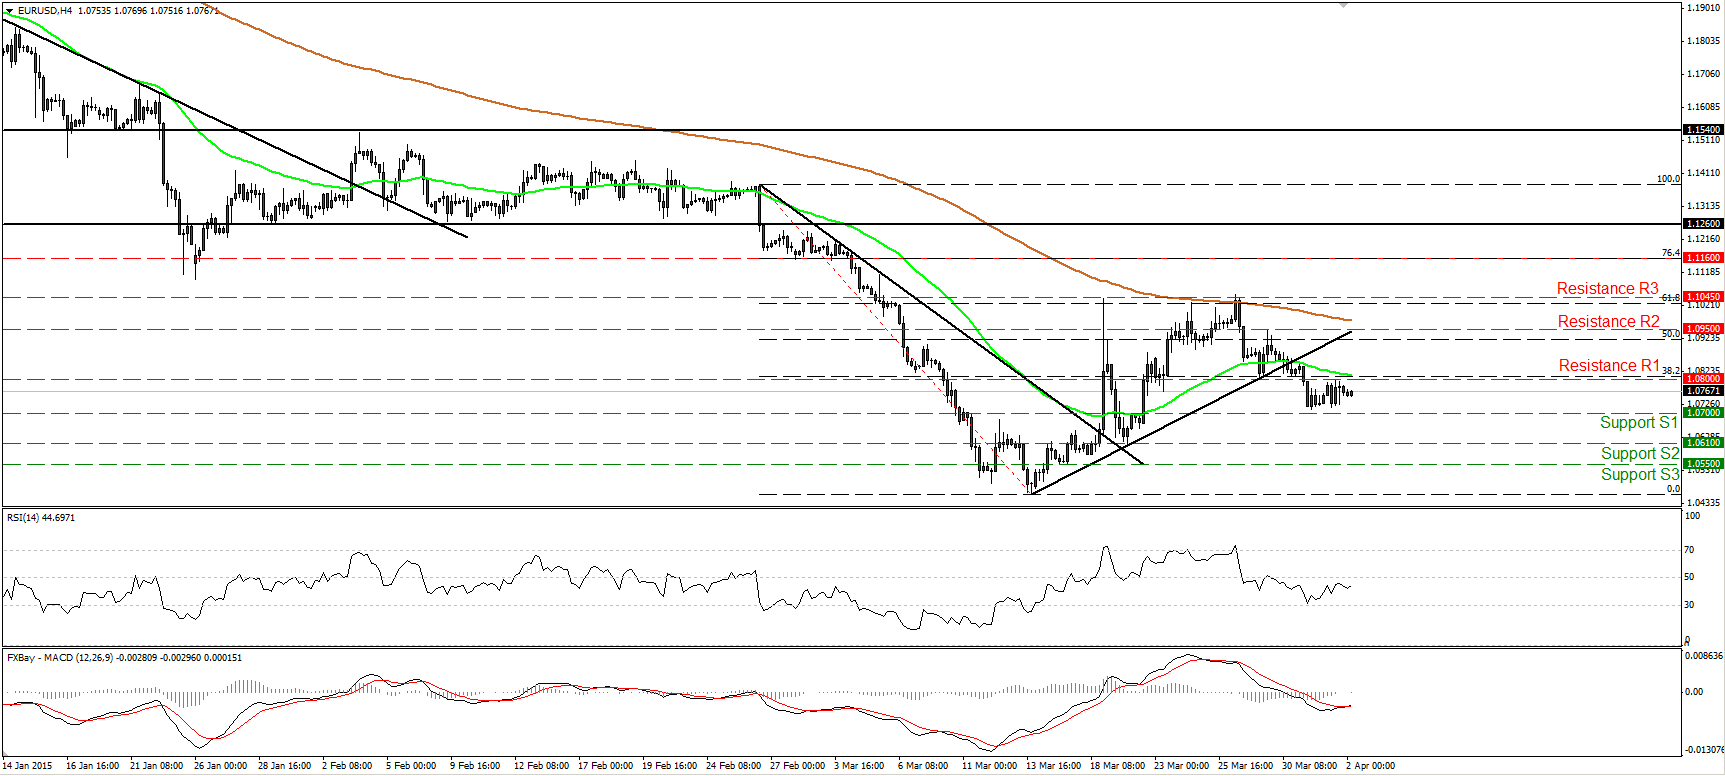
EUR/USD traded in a consolidative manner on Wednesday, staying between the support of 1.0700 (S1) and the resistance of 1.0800 (R1). The fact that the rate stays below the 1.0800 (R1) barrier keeps the short-term bias negative in my view, and I still expect the bears to challenge the 1.0700 (S1) line. A break below that support could extend the bearish wave and perhaps target the 1.0610 (S2) line. Nevertheless, bearing in mind our momentum signals, I would stay cautious that an upside bounce could be in the works before the next leg down. The RSI continued higher and is now approaching its 50 line, while the MACD has bottomed and crossed above its trigger line. As for the broader trend, I still see a longer-term downtrend. The pair is forming lower highs and lower lows below both the 50- and the 200- day moving averages. As a result, I would treat the recovery from 1.0460 as a corrective phase of the larger down path.
• Support: 1.0700 (S1), 1.0610 (S2), 1.0550 (S3).
• Resistance: 1.0800 (R1), 1.0950 (R2), 1.1045 (R3).
EUR/GBP stays within a downside channel
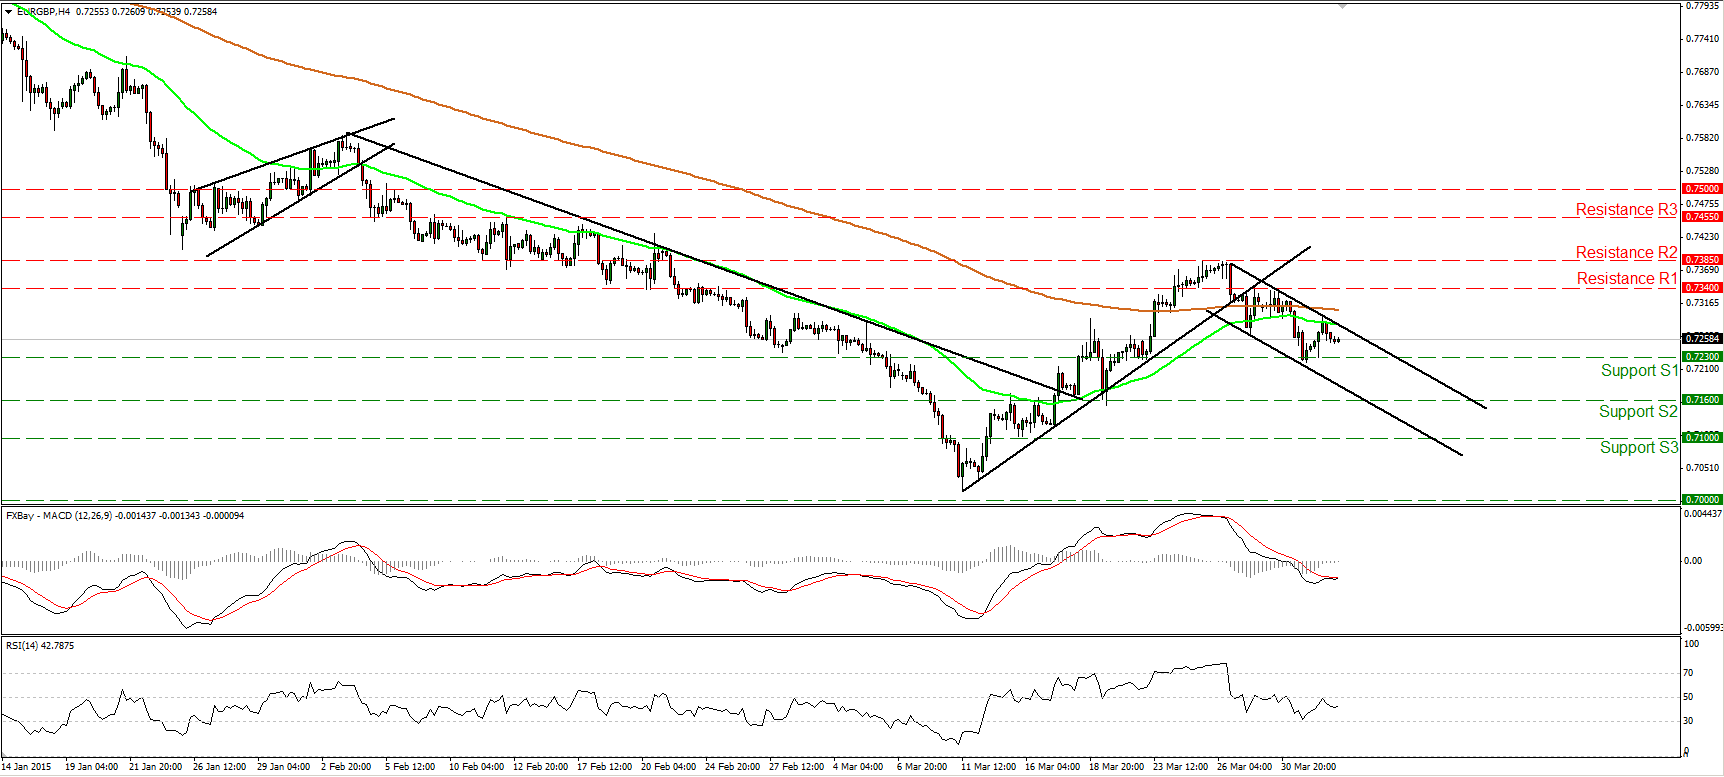
EUR/GBP rebounded from near our support line of 0.7230 (S1), but the bounce was stopped at the upper boundary of the near-term black downside channel. My opinion is that as long as the rate is trading within that channel, the short-term outlook stays negative. A clear break below 0.7230 (S1) would confirm a forthcoming lower low on the 4-hour chart and perhaps pave the way for our next support at 0.7160 (S2). Our daily oscillators reveal negative momentum and support the continuation of the new-born short-term downtrend. The 14-day RSI fell below its 50 line, while the MACD, already negative, shows signs of topping. The broader trend is negative as well. After the downside exit of the triangle pattern on the 18th of December, the price structure has been lower peaks and lower troughs below both the 50- and the 200-day moving averages. The recent decline came after EUR/GBP hit resistance at the 50-day moving average on the 26th of March, and this supports my stance to treat the recovery started on the 11th of March as a corrective move of the larger negative path.
• Support: 0.7230 (S1), 0.7160 (S2), 0.7100 (S3).
• Resistance: 0.7340 (R1), 0.7385 (R2), 0.7455 (R3).
NZD/USD hits support at 0.7390
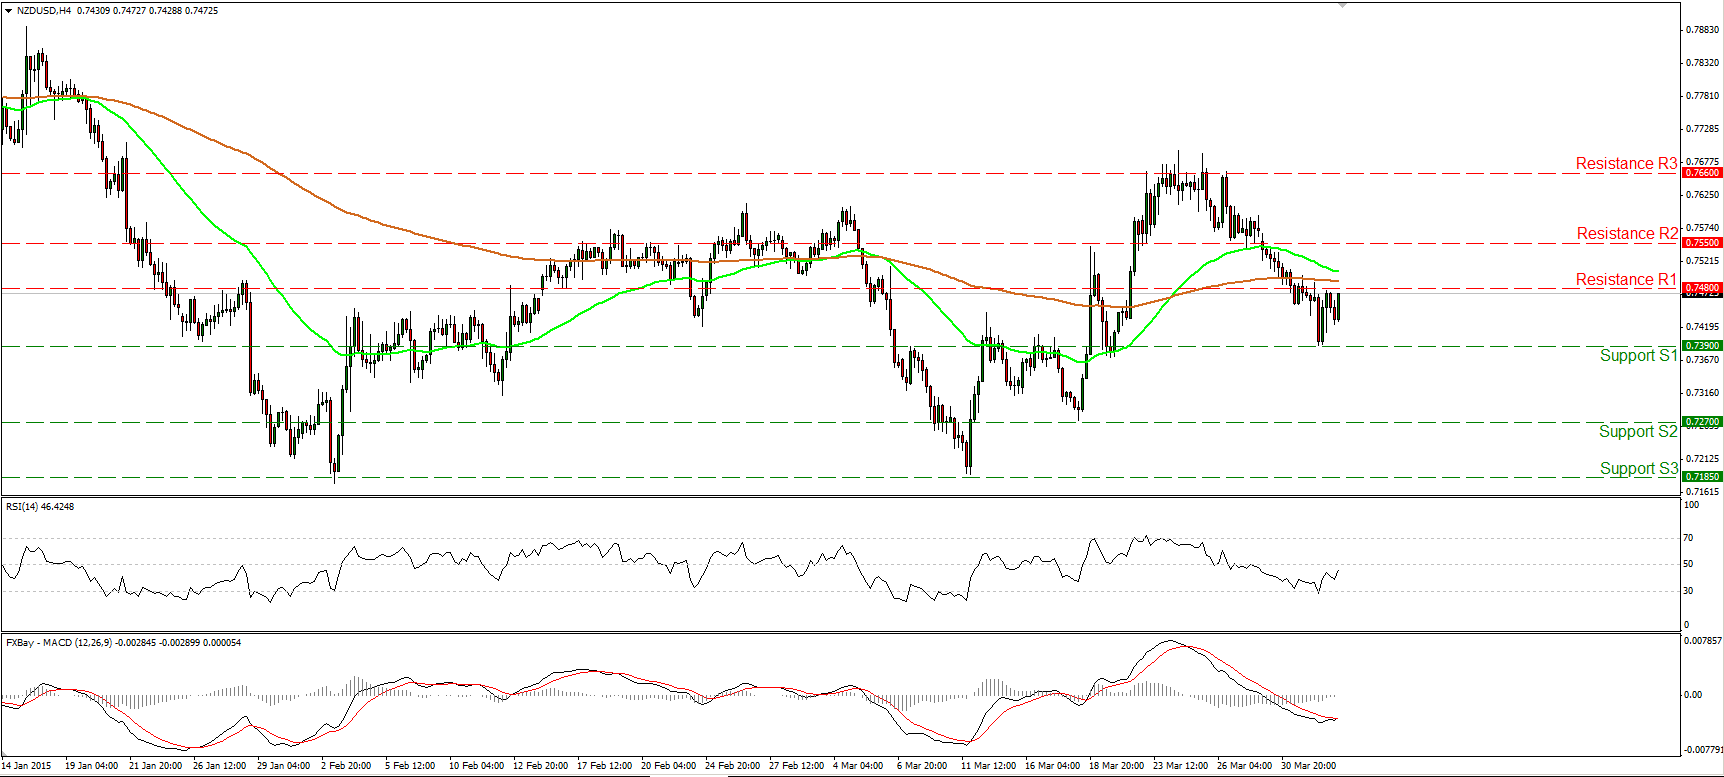
NZD/USD moved somewhat higher after hitting support at 0.7390 (S1) and today during the early European morning is heading towards the resistance of 0.7480 (R1). Based on our momentum studies, I would expect the forthcoming wave to be positive. The RSI hit resistance at its 30 line and edged higher, while the MACD has bottomed and poked its noes above its trigger line. If the bulls manage to drive the battle above 0.7480 (R1), I would expect them to trigger extensions towards our next resistance at 0.7550 (R2). In the bigger picture, I don’t see a clear trending structure. There is also positive divergence between our daily momentum studies and the price action. On the 3rd of February and the 11th of March, NZD/USD printed two lows at the same about level. However, our oscillators printed two higher lows back then. Having all these in mind, I prefer to wait for a while, before getting confident on the next directional move of this pair.
• Support: 0.7390 (S1), 0.7270 (S2), 0.7185 (S3).
• Resistance: 0.7480 (R1), 0.7550 (R2), 0.7660 (R3).
Gold surges above 1200
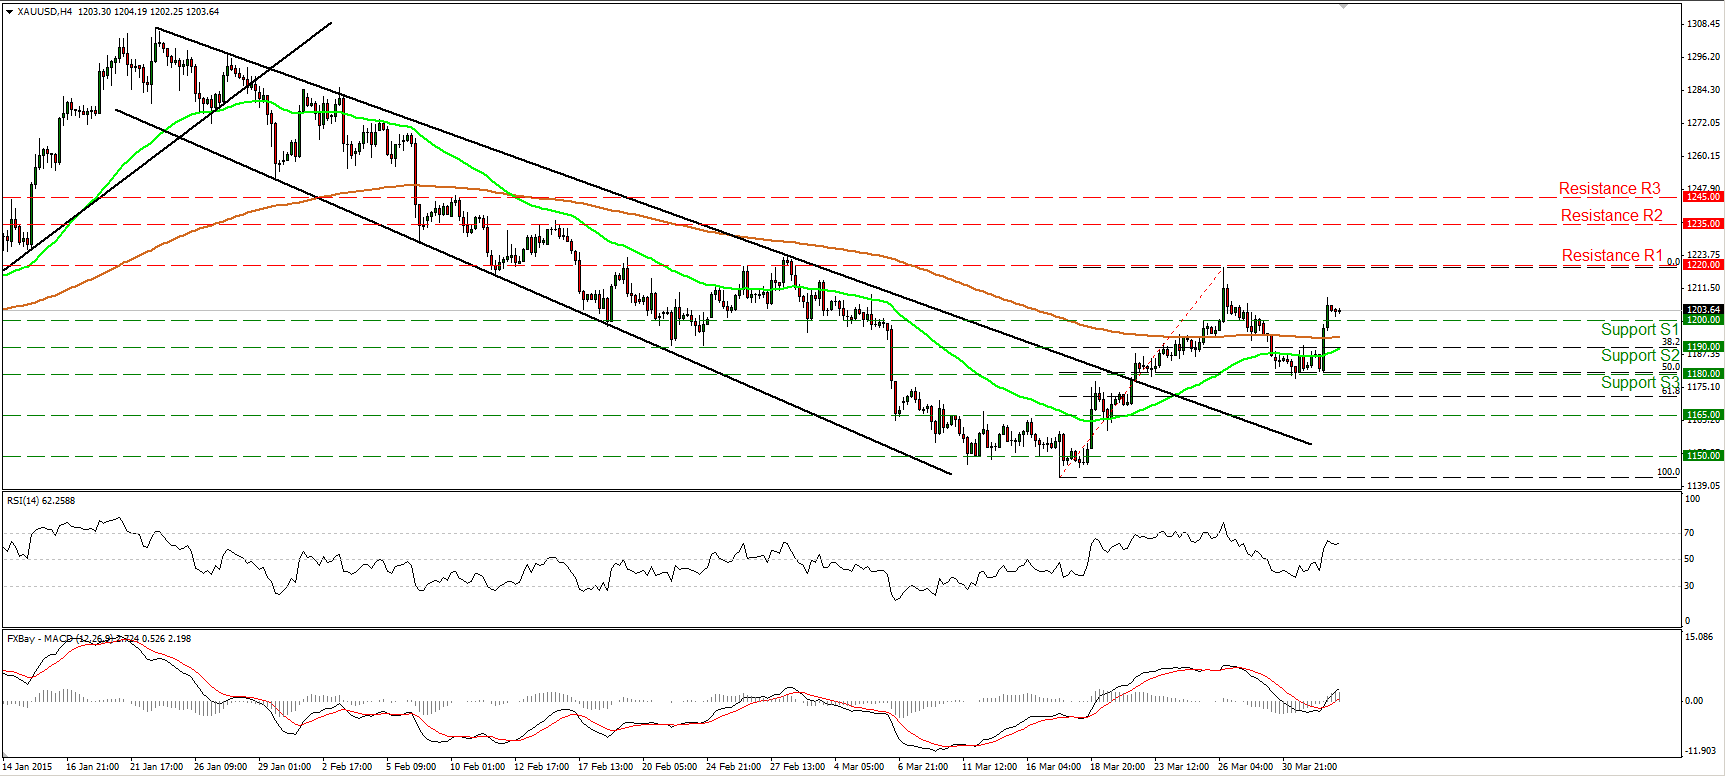
Gold rallied on Wednesday after finding support at 1180 (S3), near the 50% retracement level of the 17th – 26th of March up leg, and traded back above the round figure of 1200 (S1). The likelihood for a lower high still exists, but now there is a possibility for the completion of an inverted head and shoulders formation if the 1220 area is violated. For those reasons I would prefer to switch my stance to neutral and wait for clearer directional signals. On the daily chart, the rebound at 1180 (S3) printed a higher low, while our daily oscillators support further advances. The 14-day RSI stands above its 50 line, while the daily MACD, already above its trigger, appears ready to obtain a positive sign. These signs give me extra reasons to take the sidelines for now.
• Support: 1200 (S1), 1190 (S2), 1180 (S3).
• Resistance: 1220 (R1), 1235 (R2), 1245 (R3).
WTI flies and hits resistance above 50.00
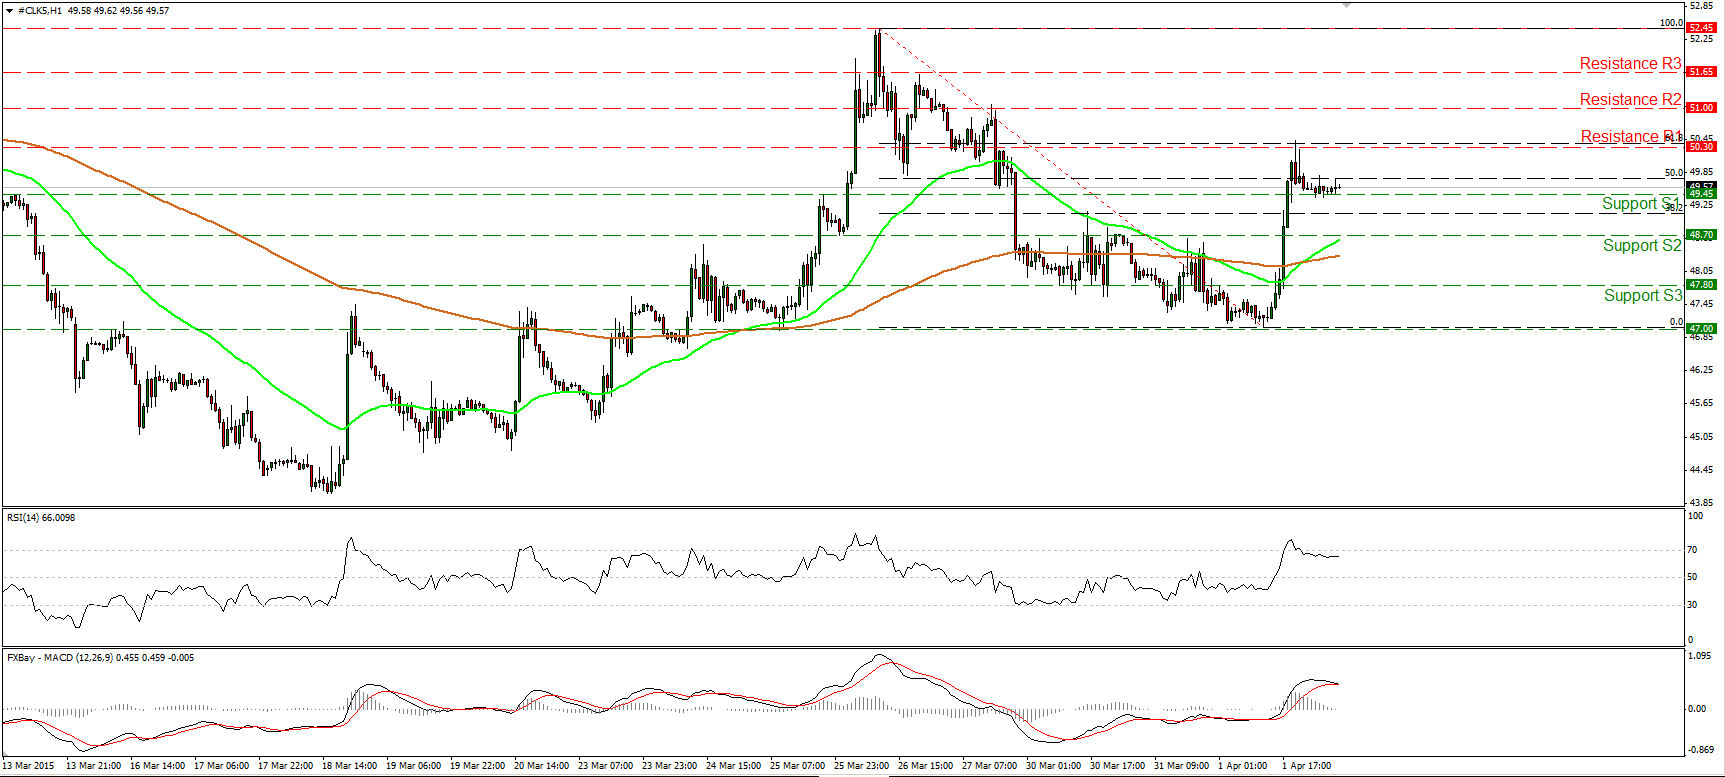
WTI shot up yesterday and managed to trade above 50.00 for a while. Nevertheless, it found resistance near 50.30 (R1), which stands close to the 61.8% retracement level of the 26th of March - 1st of April decline. The rally changed the short-term outlook from the downside to the upside in my view, as it printed a higher high on the 1-hour chart. A clear break above 50.30 (R1) would confirm my stance and perhaps target our next resistance at 51.00 (R2). Our hourly momentum studies though show that a further retreat could be on the cards before the next leg up. The RSI exited its overbought territory and stands slightly below it, while the MACD has topped and could move below its trigger any time soon. On the daily chart, WTI is trading below both the 50- and the 200-day moving averages. Nevertheless, there is still positive divergence between the daily oscillators and the price action. Therefore, I would prefer to wait for price and momentum alignment before getting confident again on the larger down path.
• Support: 49.45 (S1), 48.70 (S2), 47.80 (S3).
• Resistance: 50.30 (R1) 51.00 (R2), 51.65 (R3).

